
13-141
160. Financial statements for Maraby Corporation appear below:
Maraby Corporation
Balance Sheet
December 31, Year 2 and Year 1
(dollars in thousands)
Year 2 Year 1
Current assets:
Cash and marketable securities $220 $190
Accounts receivable, net 190 160
Inventory 140 150
Prepaid expenses 70 80
Total current assets 620 580
Noncurrent assets:
Plant & equipment, net 1,180 1,150
Total assets $1,800 $1,730
Current liabilities:
Accounts payable $100 $120
Accrued liabilities 100 70
Notes payable, short term 160 160
Total current liabilities 360 350
Noncurrent liabilities:
Bonds payable 450 500
Total liabilities 810 850
Stockholders’ equity:
Common stock, $5 par 160 160
Additional paid-in capital-common stock 200 200
Retained earnings 630 520
Total stockholders’ equity 990 880
Total liabilities & stockholders’ equity $1,800 $1,730
Maraby Corporation
Income Statement
For the Year Ended December 31, Year 2
(dollars in thousands)
Sales (all on account) $1,960
Cost of goods sold 1,370
Gross margin 590
Selling and administrative expense 230
Net operating income 360
Interest expense 50
Net income before taxes 310
Income taxes (30%) 93
Net income $217
Maraby Corporation’s inventory turnover for Year 2 was closest to:

13-143
161. Financial statements for Maraby Corporation appear below:
Maraby Corporation
Balance Sheet
December 31, Year 2 and Year 1
(dollars in thousands)
Year 2 Year 1
Current assets:
Cash and marketable securities $220 $190
Accounts receivable, net 190 160
Inventory 140 150
Prepaid expenses 70 80
Total current assets 620 580
Noncurrent assets:
Plant & equipment, net 1,180 1,150
Total assets $1,800 $1,730
Current liabilities:
Accounts payable $100 $120
Accrued liabilities 100 70
Notes payable, short term 160 160
Total current liabilities 360 350
Noncurrent liabilities:
Bonds payable 450 500
Total liabilities 810 850
Stockholders’ equity:
Common stock, $5 par 160 160
Additional paid-in capital-common stock 200 200
Retained earnings 630 520
Total stockholders’ equity 990 880
Total liabilities & stockholders’ equity $1,800 $1,730
Maraby Corporation
Income Statement
For the Year Ended December 31, Year 2
(dollars in thousands)
Sales (all on account) $1,960
Cost of goods sold 1,370
Gross margin 590
Selling and administrative expense 230
Net operating income 360
Interest expense 50
Net income before taxes 310
Income taxes (30%) 93
Net income $217
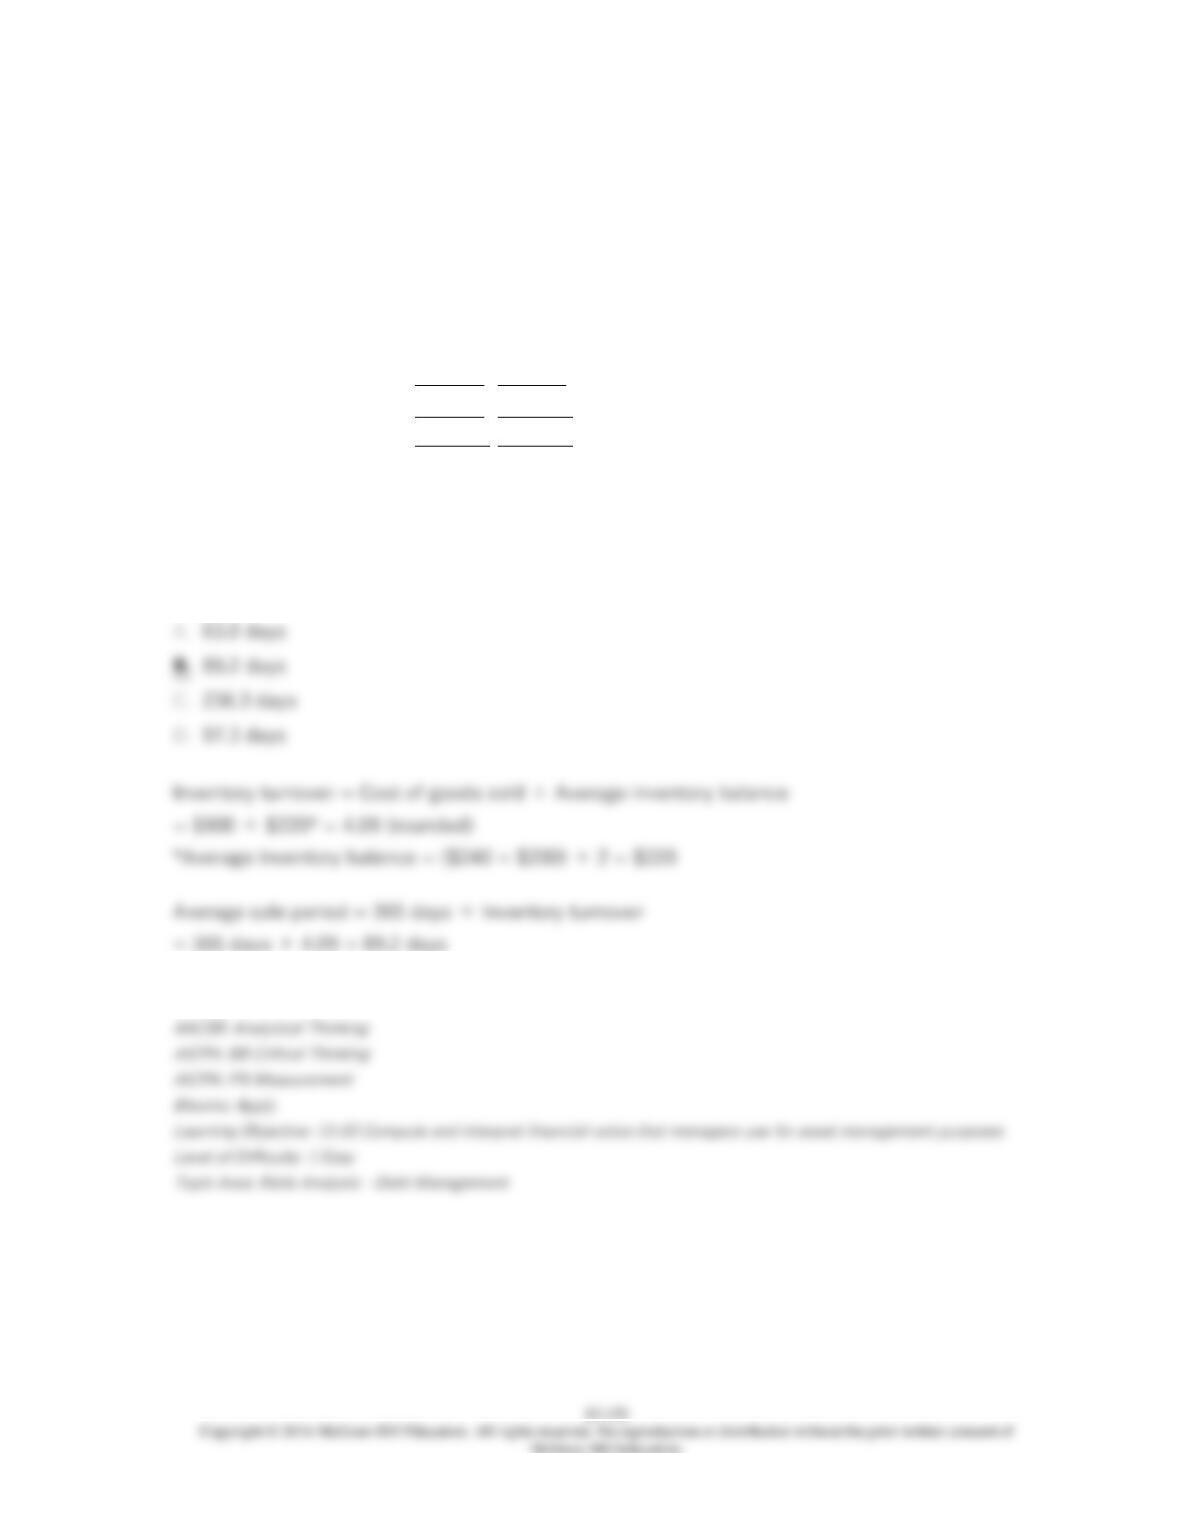
Maraby Corporation’s average sale period for Year 2 was closest to:
162. Excerpts from Sydner Corporation’s most recent balance sheet appear below:
Year 2 Year 1
Current assets:
Cash $140 $160
Accounts receivable 210 230
Inventory 240 200
Prepaid expenses 10 10
Total current assets $600 $600
Total current liabilities $360 $330
Sales on account in Year 2 amounted to $1,390 and the cost of goods sold was $900.
The working capital at the end of Year 2 is:
163. Excerpts from Sydner Corporation’s most recent balance sheet appear below:
Year 2 Year 1
Current assets:
Cash $140 $160
Accounts receivable 210 230
Inventory 240 200
Prepaid expenses 10 10
Total current assets $600 $600
Total current liabilities $360 $330
Sales on account in Year 2 amounted to $1,390 and the cost of goods sold was $900.
The current ratio at the end of Year 2 is closest to:
164. Excerpts from Sydner Corporation’s most recent balance sheet appear below:
Year 2 Year 1
Current assets:
Cash $140 $160
Accounts receivable 210 230
Inventory 240 200
Prepaid expenses 10 10
Total current assets $600 $600
Total current liabilities $360 $330
Sales on account in Year 2 amounted to $1,390 and the cost of goods sold was $900.
The acid-test ratio at the end of Year 2 is closest to:
165. Excerpts from Sydner Corporation’s most recent balance sheet appear below:
Year 2 Year 1
Current assets:
Cash $140 $160
Accounts receivable 210 230
Inventory 240 200
Prepaid expenses 10 10
Total current assets $600 $600
Total current liabilities $360 $330
Sales on account in Year 2 amounted to $1,390 and the cost of goods sold was $900.
The accounts receivable turnover for Year 2 is closest to:
166. Excerpts from Sydner Corporation’s most recent balance sheet appear below:
Year 2 Year 1
Current assets:
Cash $140 $160
Accounts receivable 210 230
Inventory 240 200
Prepaid expenses 10 10
Total current assets $600 $600
Total current liabilities $360 $330
Sales on account in Year 2 amounted to $1,390 and the cost of goods sold was $900.
The average collection period for Year 2 is closest to:
167. Excerpts from Sydner Corporation’s most recent balance sheet appear below:
Year 2 Year 1
Current assets:
Cash $140 $160
Accounts receivable 210 230
Inventory 240 200
Prepaid expenses 10 10
Total current assets $600 $600
Total current liabilities $360 $330
Sales on account in Year 2 amounted to $1,390 and the cost of goods sold was $900.
The inventory turnover for Year 2 is closest to:
168. Excerpts from Sydner Corporation’s most recent balance sheet appear below:
Year 2 Year 1
Current assets:
Cash $140 $160
Accounts receivable 210 230
Inventory 240 200
Prepaid expenses 10 10
Total current assets $600 $600
Total current liabilities $360 $330
Sales on account in Year 2 amounted to $1,390 and the cost of goods sold was $900.
The average sale period for Year 2 is closest to:
169. Ribaudo Corporation has provided the following financial data from its balance sheet and
income statement:
Year 2 Year 1
Cash $74,000 $130,000
Accounts receivable $255,000 $240,000
Inventory $173,000 $180,000
Total current assets $564,000 $610,000
Total assets $1,350,000 $1,330,000
Accounts payable $170,000 $160,000
Total liabilities $633,000 $620,000
Total stockholders’ equity $717,000 $710,000
Sales (all on account) $1,290,000
Cost of goods sold $700,000
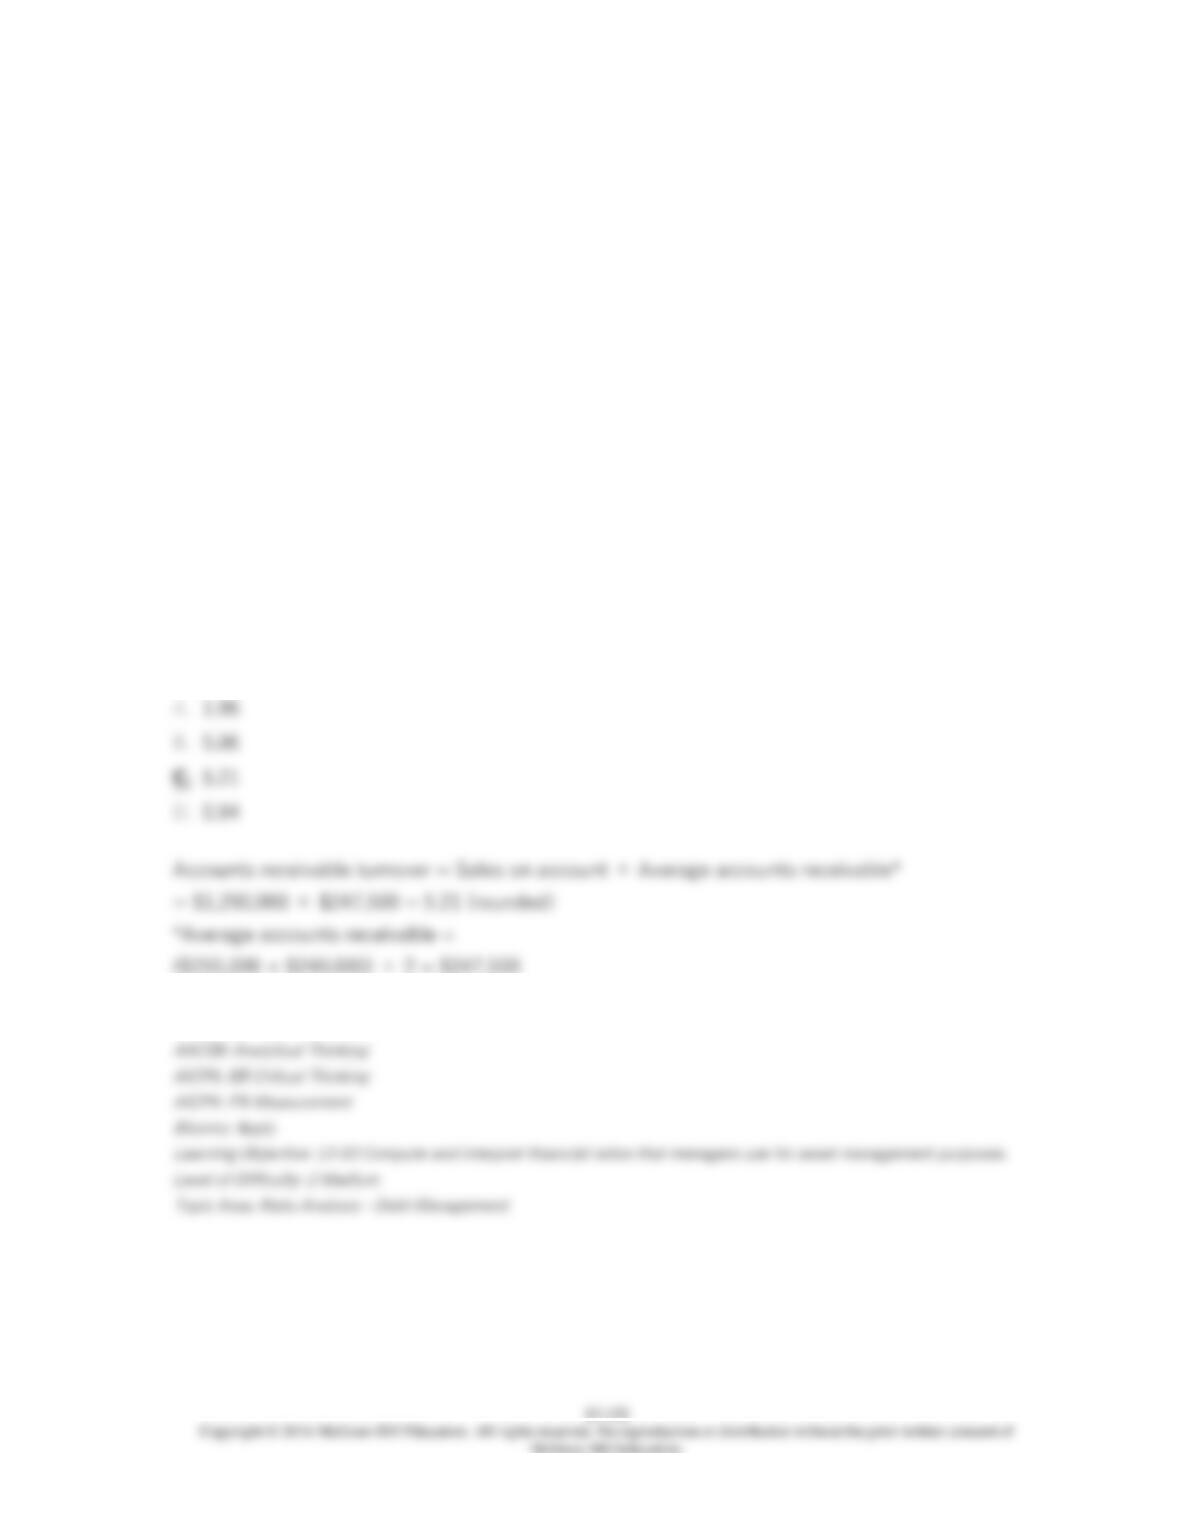
The company’s accounts receivable turnover for Year 2 is closest to:
170. Ribaudo Corporation has provided the following financial data from its balance sheet and
income statement:
Year 2 Year 1
Cash $74,000 $130,000
Accounts receivable $255,000 $240,000
Inventory $173,000 $180,000
Total current assets $564,000 $610,000
Total assets $1,350,000 $1,330,000
Accounts payable $170,000 $160,000
Total liabilities $633,000 $620,000
Total stockholders’ equity $717,000 $710,000
Sales (all on account) $1,290,000
Cost of goods sold $700,000
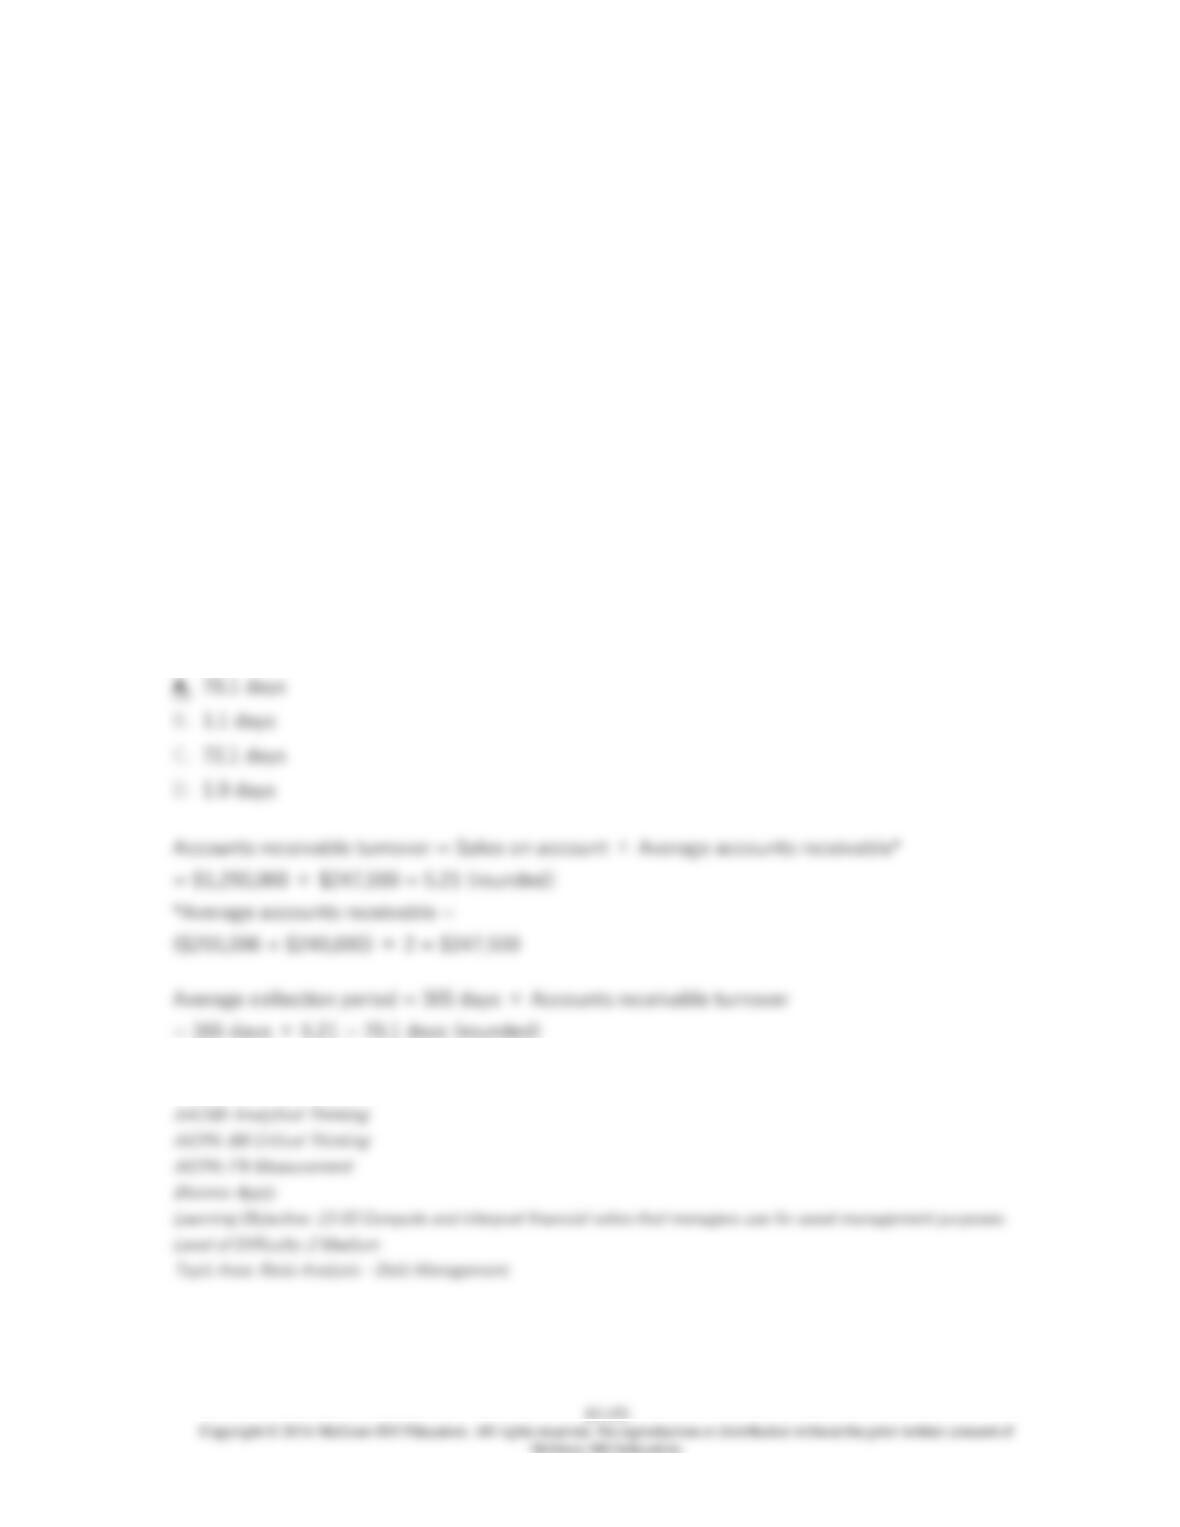
The company’s average collection period (age of receivables) for Year 2 is closest to:
171. Ribaudo Corporation has provided the following financial data from its balance sheet and
income statement:
Year 2 Year 1
Cash $74,000 $130,000
Accounts receivable $255,000 $240,000
Inventory $173,000 $180,000
Total current assets $564,000 $610,000
Total assets $1,350,000 $1,330,000
Accounts payable $170,000 $160,000
Total liabilities $633,000 $620,000
Total stockholders’ equity $717,000 $710,000
Sales (all on account) $1,290,000
Cost of goods sold $700,000
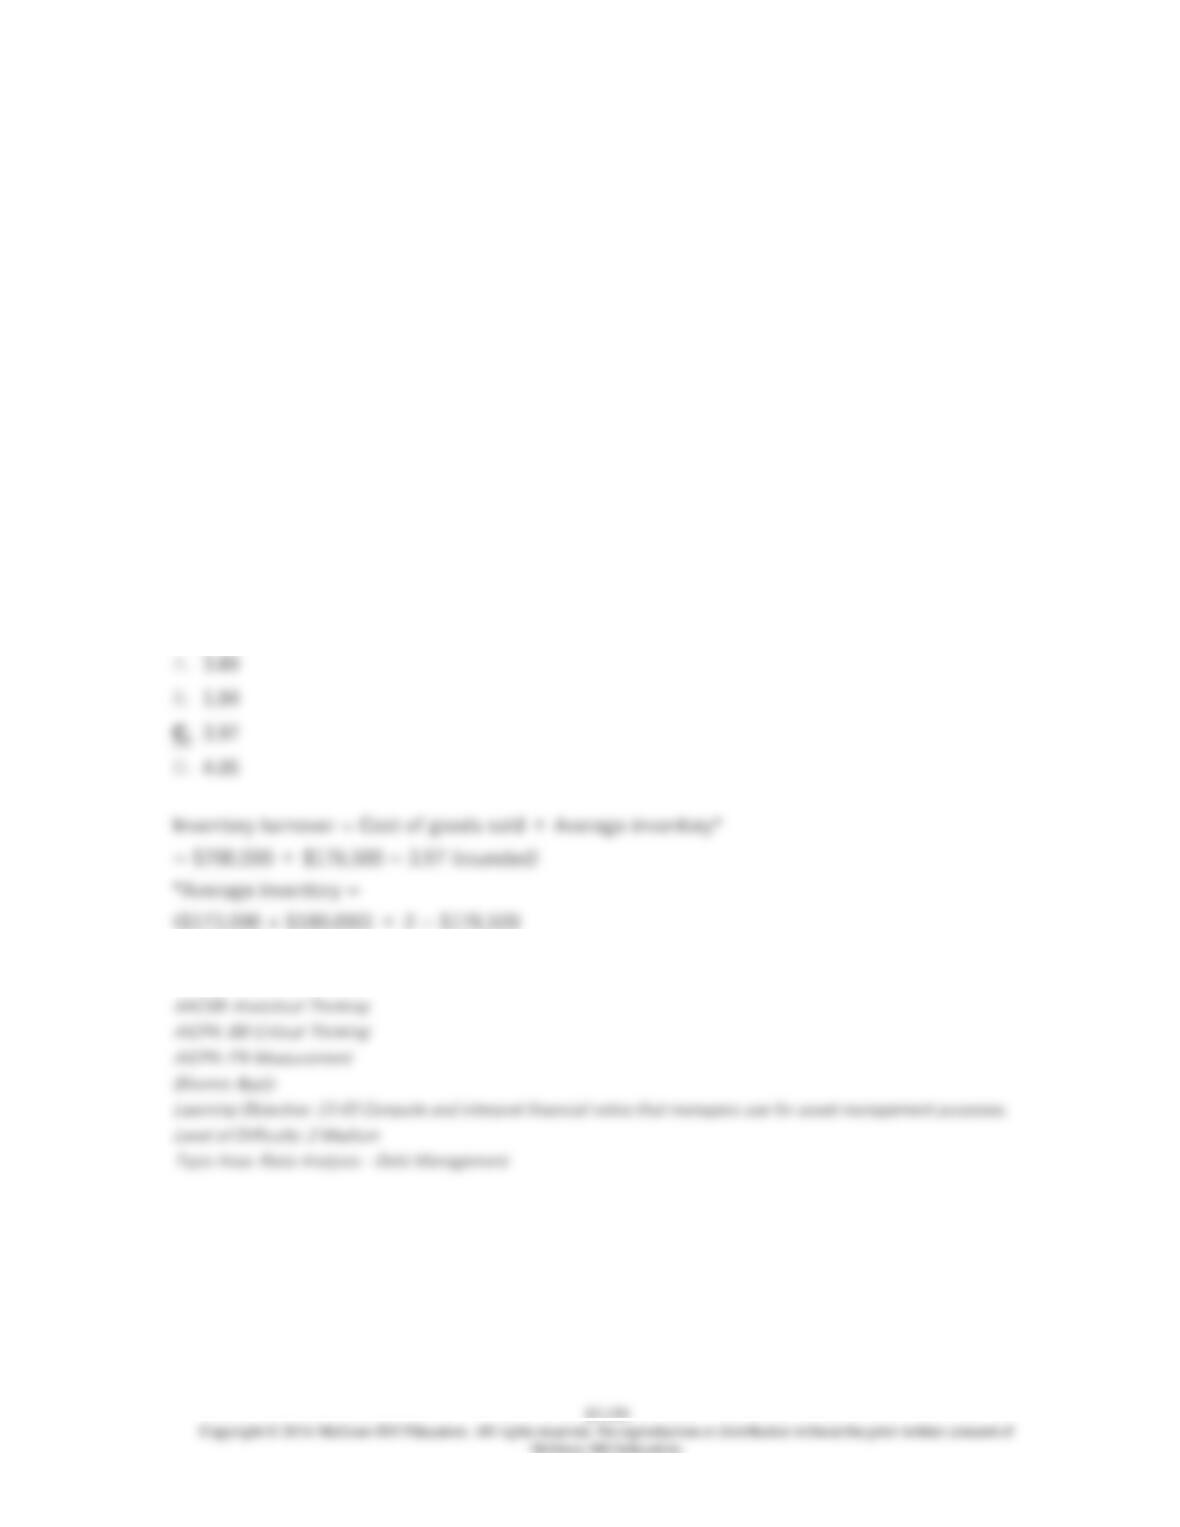
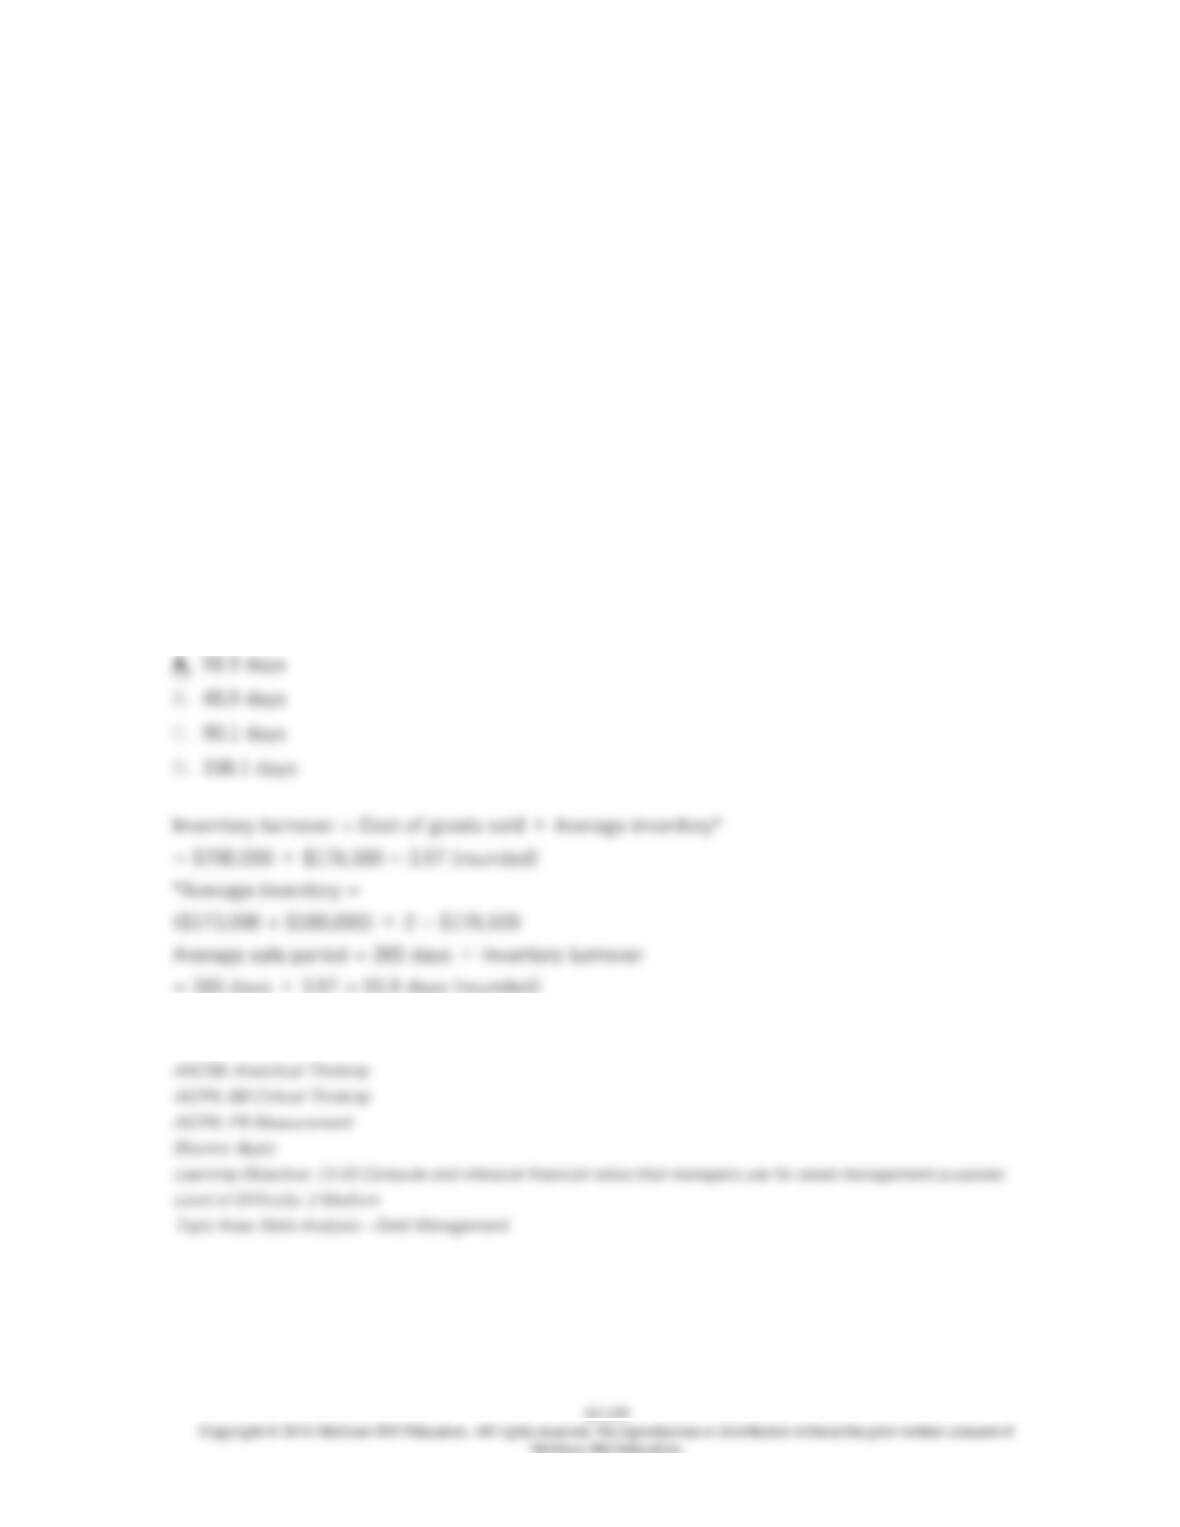
The company’s inventory turnover for Year 2 is closest to:
172. Ribaudo Corporation has provided the following financial data from its balance sheet and
income statement:
Year 2 Year 1
Cash $74,000 $130,000
Accounts receivable $255,000 $240,000
Inventory $173,000 $180,000
Total current assets $564,000 $610,000
Total assets $1,350,000 $1,330,000
Accounts payable $170,000 $160,000
Total liabilities $633,000 $620,000
Total stockholders’ equity $717,000 $710,000
Sales (all on account) $1,290,000
Cost of goods sold $700,000
The company’s average sale period (turnover in days) for Year 2 is closest to:
173. Ribaudo Corporation has provided the following financial data from its balance sheet and
income statement:
Year 2 Year 1
Cash $74,000 $130,000
Accounts receivable $255,000 $240,000
Inventory $173,000 $180,000
Total current assets $564,000 $610,000
Total assets $1,350,000 $1,330,000
Accounts payable $170,000 $160,000
Total liabilities $633,000 $620,000
Total stockholders’ equity $717,000 $710,000
Sales (all on account) $1,290,000
Cost of goods sold $700,000
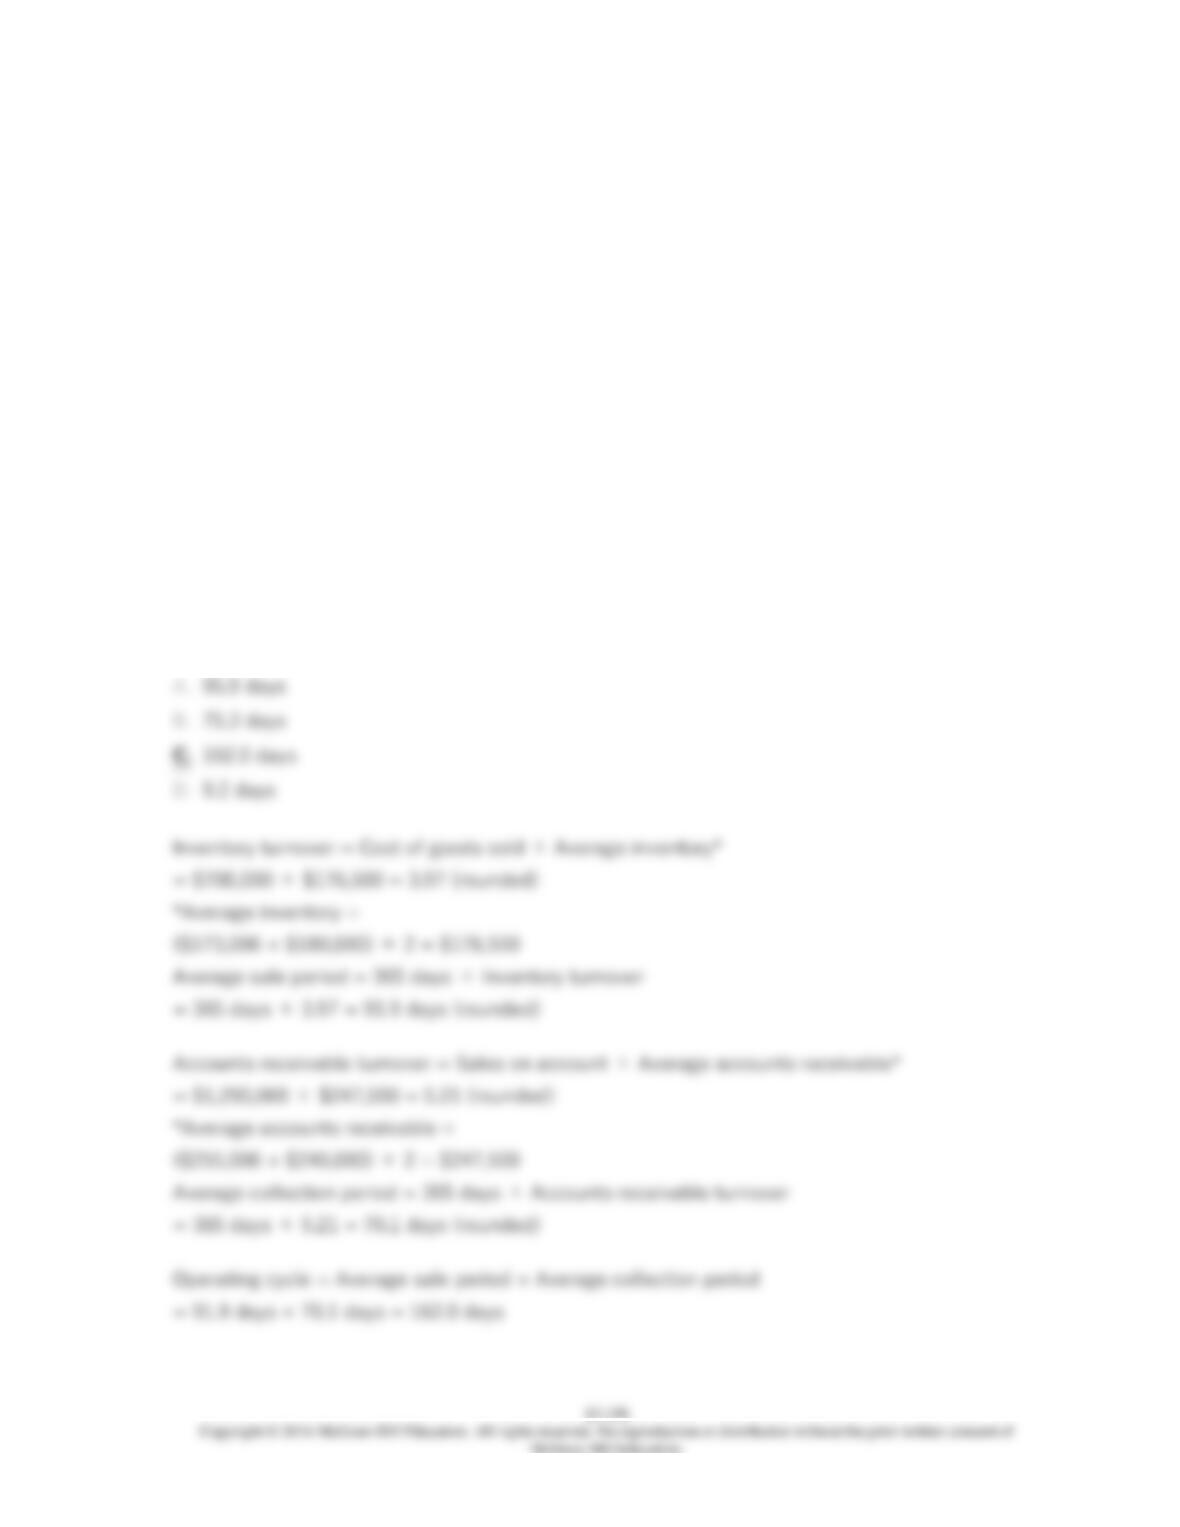
The company’s operating cycle for Year 2 is closest to:
174. Ribaudo Corporation has provided the following financial data from its balance sheet and
income statement:
Year 2 Year 1
Cash $74,000 $130,000
Accounts receivable $255,000 $240,000
Inventory $173,000 $180,000
Total current assets $564,000 $610,000
Total assets $1,350,000 $1,330,000
Accounts payable $170,000 $160,000
Total liabilities $633,000 $620,000
Total stockholders’ equity $717,000 $710,000
Sales (all on account) $1,290,000
Cost of goods sold $700,000
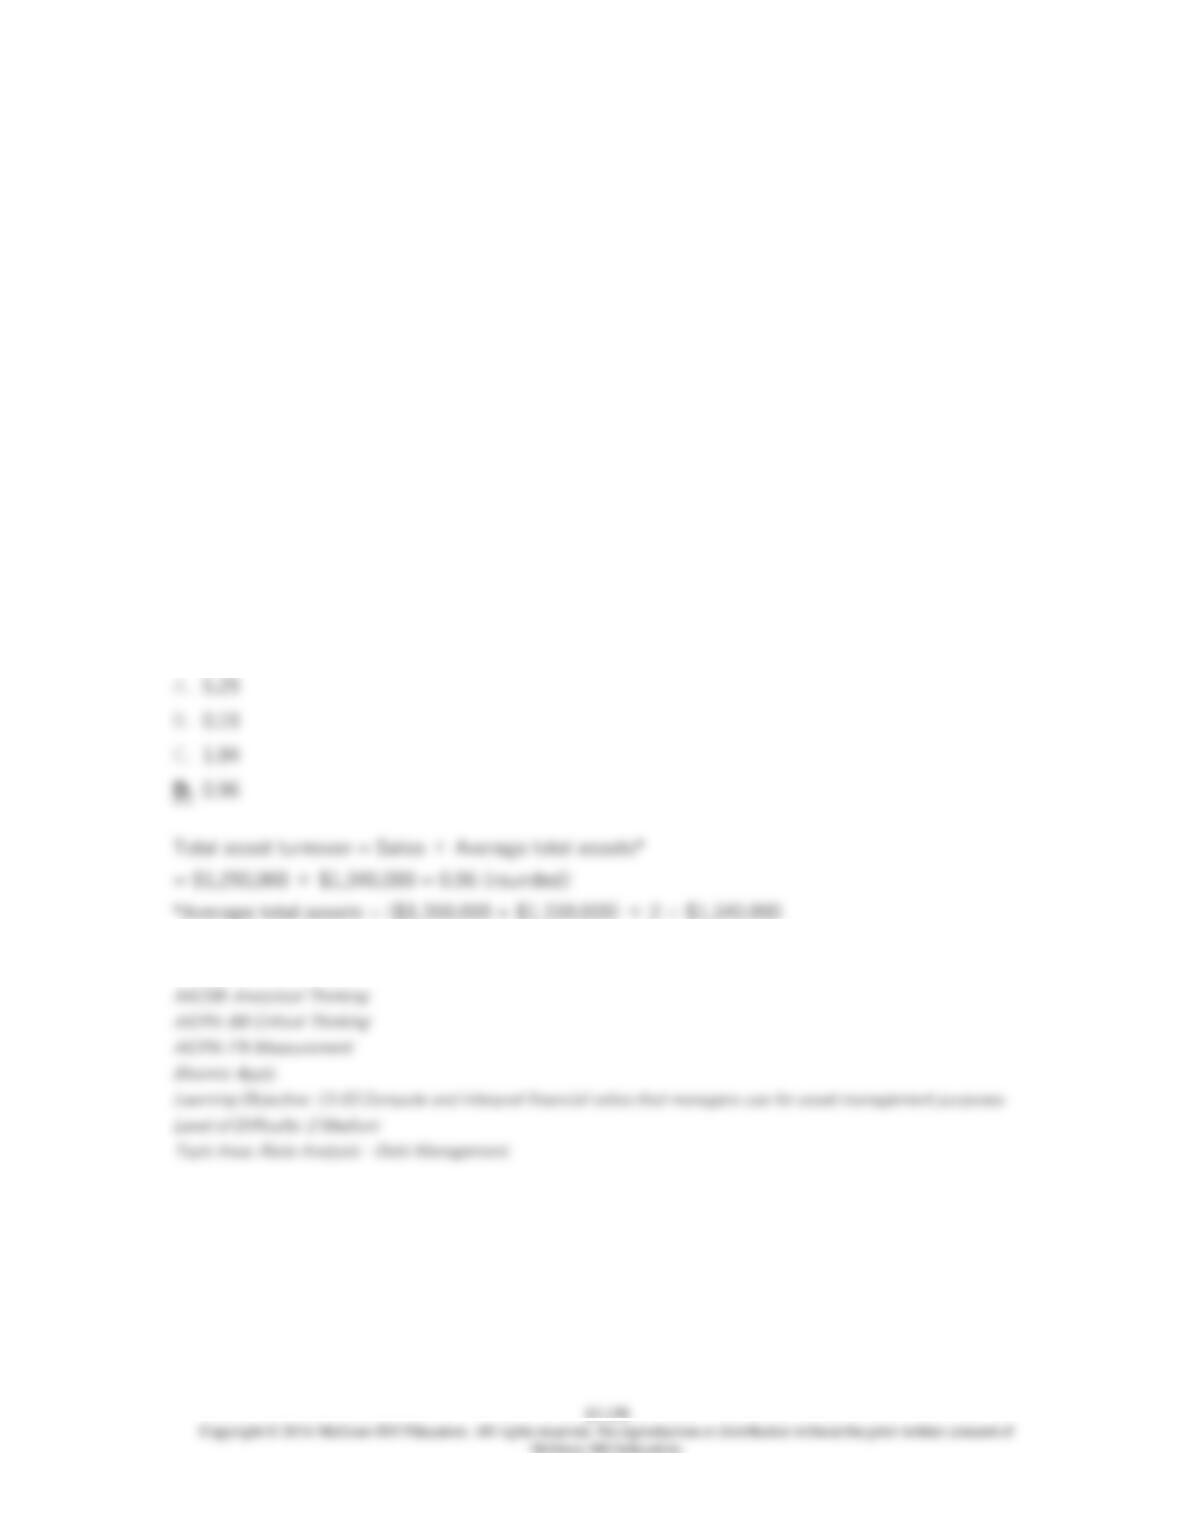
The company’s total asset turnover for Year 2 is closest to:

13-159
175. Dahn Corporation has provided the following financial data:
Balance Sheet
December 31, Year 2 and Year 1
Assets Year 2 Year 1
Current assets:
Cash $227,000 $150,000
Accounts receivable 134,000 130,000
Inventory 150,000 130,000
Prepaid expenses 83,000 80,000
Total current assets 594,000 490,000
Plant and equipment, net 769,000 840,000
Total assets $1,363,000 $1,330,000
Liabilities and Stockholders’ Equity
Current liabilities:
Accounts payable $200,000 $180,000
Accrued liabilities 63,000 70,000
Notes payable, short term 71,000 60,000
Total current liabilities 334,000 310,000
Bonds payable 290,000 290,000
Total liabilities 624,000 600,000
Stockholders’ equity:
Common stock, $5 par value 400,000 400,000
Additional paid-in capital-common stock 50,000 50,000
Retained earnings 289,000 280,000
Total stockholders’ equity 739,000 730,000
Total liabilities & stockholders’ equity $1,363,000 $1,330,000
Income Statement—Year 2
For the Year Ended December 31, Year 2
Sales (all on account) $1,370,000
Cost of goods sold 850,000
Gross margin 520,000
Operating expenses 482,692
Net operating income 37,308
Interest expense 21,000
Net income before taxes 16,308
Income taxes (35%) 5,708
Net income $10,600
Dividends on common stock during Year 2 totaled $1,600. The market price of common stock at
the end of Year 2 was $2.37 per share.
The company’s accounts receivable turnover for Year 2 is closest to: