Net income before taxes 136
Income taxes (30%) 41
Net income $95
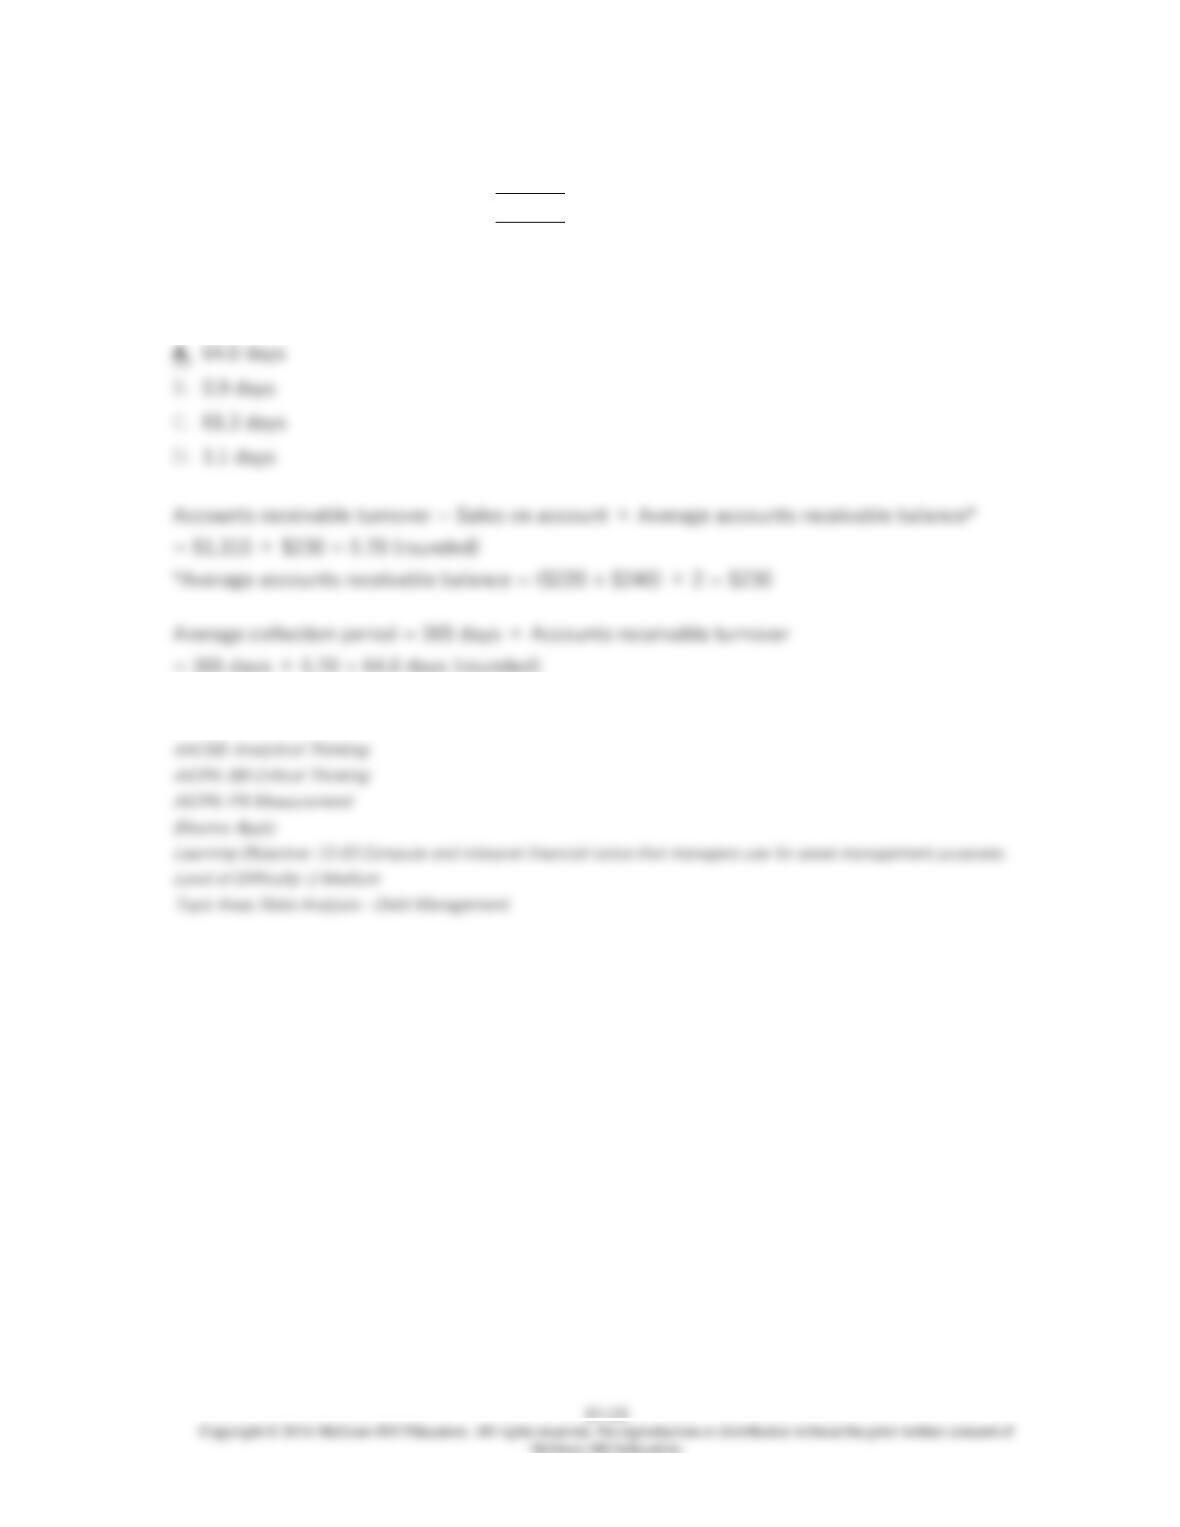
The average collection period for Year 2 is closest to:

13-122
148. Freiman Corporation’s most recent balance sheet and income statement appear below:
Balance Sheet
December 31, Year 2 and Year 1
(in thousands of dollars)
Assets Year 2 Year 1
Current assets:
Cash $160 $120
Accounts receivable 220 240
Inventory 120 130
Prepaid expenses 40 40
Total current assets 540 530
Plant and equipment, net 700 700
Total assets $1,240 $1,230
Liabilities and Stockholders’ Equity
Current liabilities:
Accounts payable $130 $150
Accrued liabilities 90 90
Notes payable, short term 60 70
Total current liabilities 280 310
Bonds payable 280 290
Total liabilities 560 600
Stockholders’ equity:
Common stock, $2 par value 100 100
Additional paid-in capital-common stock 200 200
Retained earnings 380 330
Total stockholders’ equity 680 630
Total liabilities & stockholders’ equity $1,240 $1,230
Income Statement
For the Year Ended December 31, Year 2
(in thousands of dollars)
Sales (all on account) $1,310
Cost of goods sold 780
Gross margin 530
Selling and administrative expense 359
Net operating income 171
Interest expense 35
Net income before taxes 136
Income taxes (30%) 41
Net income $95
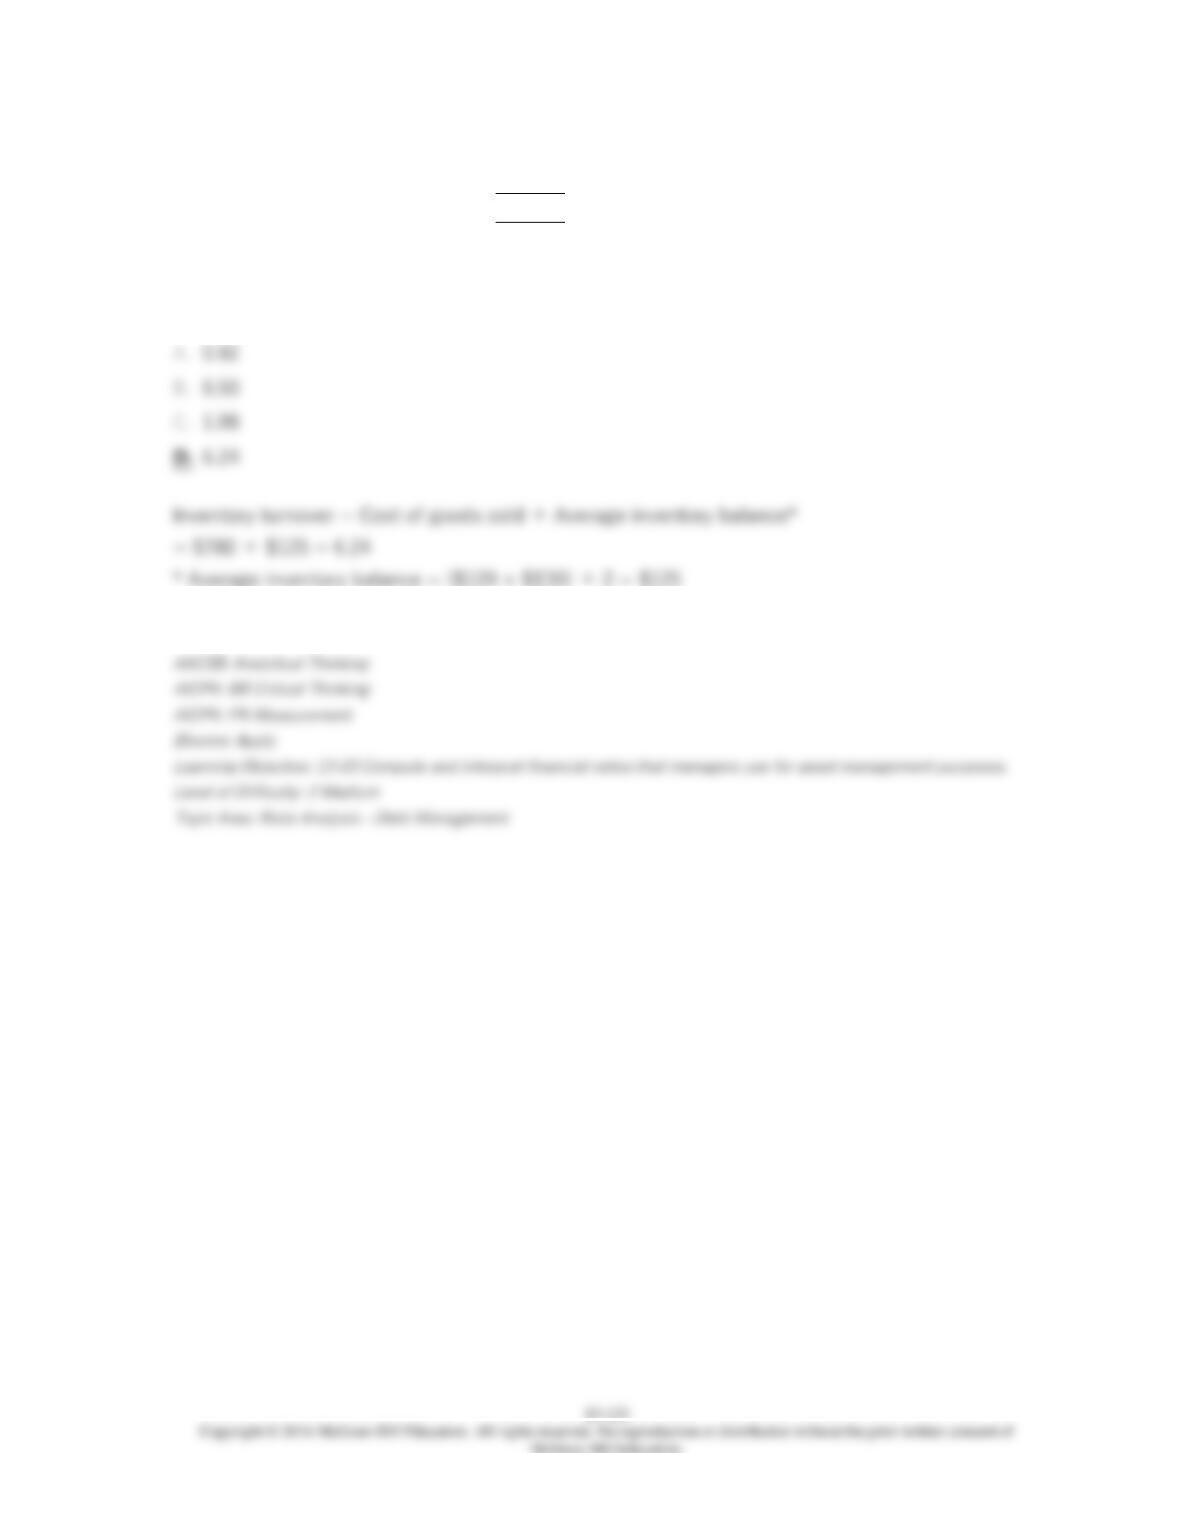
The inventory turnover for Year 2 is closest to:

13-124
149. Freiman Corporation’s most recent balance sheet and income statement appear below:
Balance Sheet
December 31, Year 2 and Year 1
(in thousands of dollars)
Assets Year 2 Year 1
Current assets:
Cash $160 $120
Accounts receivable 220 240
Inventory 120 130
Prepaid expenses 40 40
Total current assets 540 530
Plant and equipment, net 700 700
Total assets $1,240 $1,230
Liabilities and Stockholders’ Equity
Current liabilities:
Accounts payable $130 $150
Accrued liabilities 90 90
Notes payable, short term 60 70
Total current liabilities 280 310
Bonds payable 280 290
Total liabilities 560 600
Stockholders’ equity:
Common stock, $2 par value 100 100
Additional paid-in capital-common stock 200 200
Retained earnings 380 330
Total stockholders’ equity 680 630
Total liabilities & stockholders’ equity $1,240 $1,230
Income Statement
For the Year Ended December 31, Year 2
(in thousands of dollars)
Sales (all on account) $1,310
Cost of goods sold 780
Gross margin 530
Selling and administrative expense 359
Net operating income 171
Interest expense 35
Net income before taxes 136
Income taxes (30%) 41
Net income $95
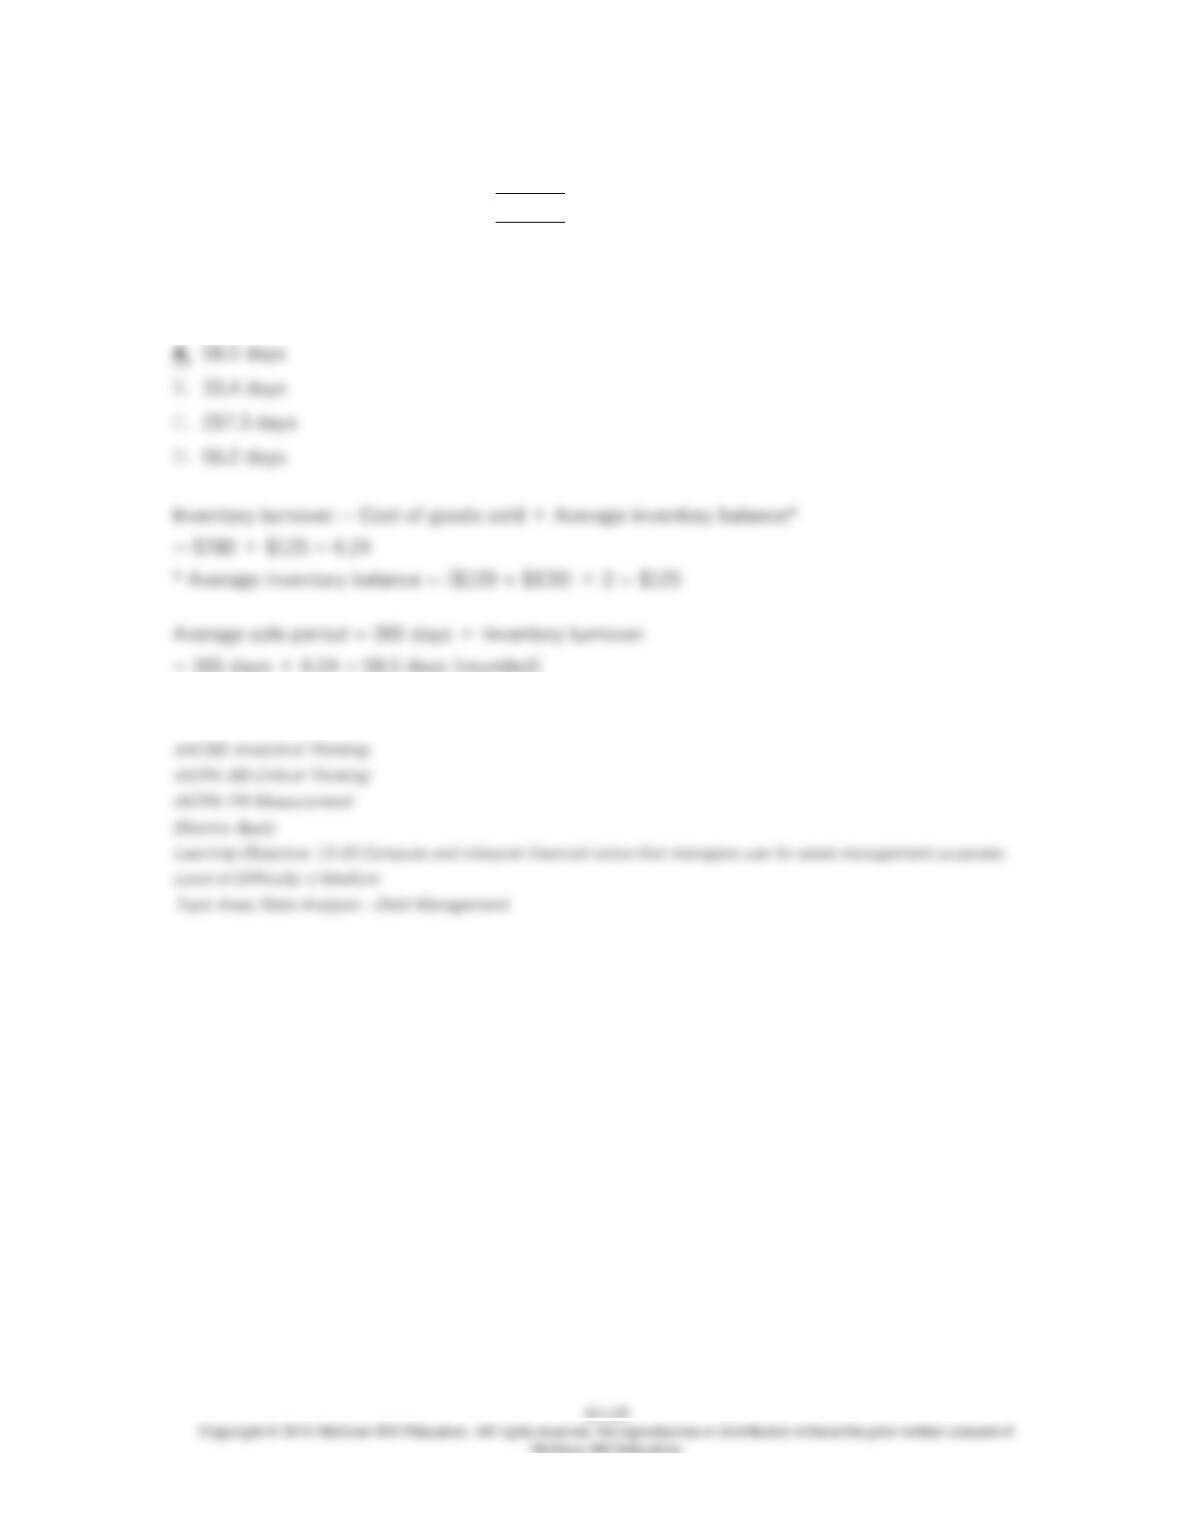
The average sale period for Year 2 is closest to:
150. Data from Dunshee Corporation’s most recent balance sheet appear below:
Year 2 Year 1
Current assets:
Cash $130 $100
Accounts receivable 270 290
Inventory 90 110
Prepaid expenses 10 10
Total current assets $500 $510
Total current liabilities $230 $220
Sales on account in Year 2 amounted to $1,170 and the cost of goods sold was $730.
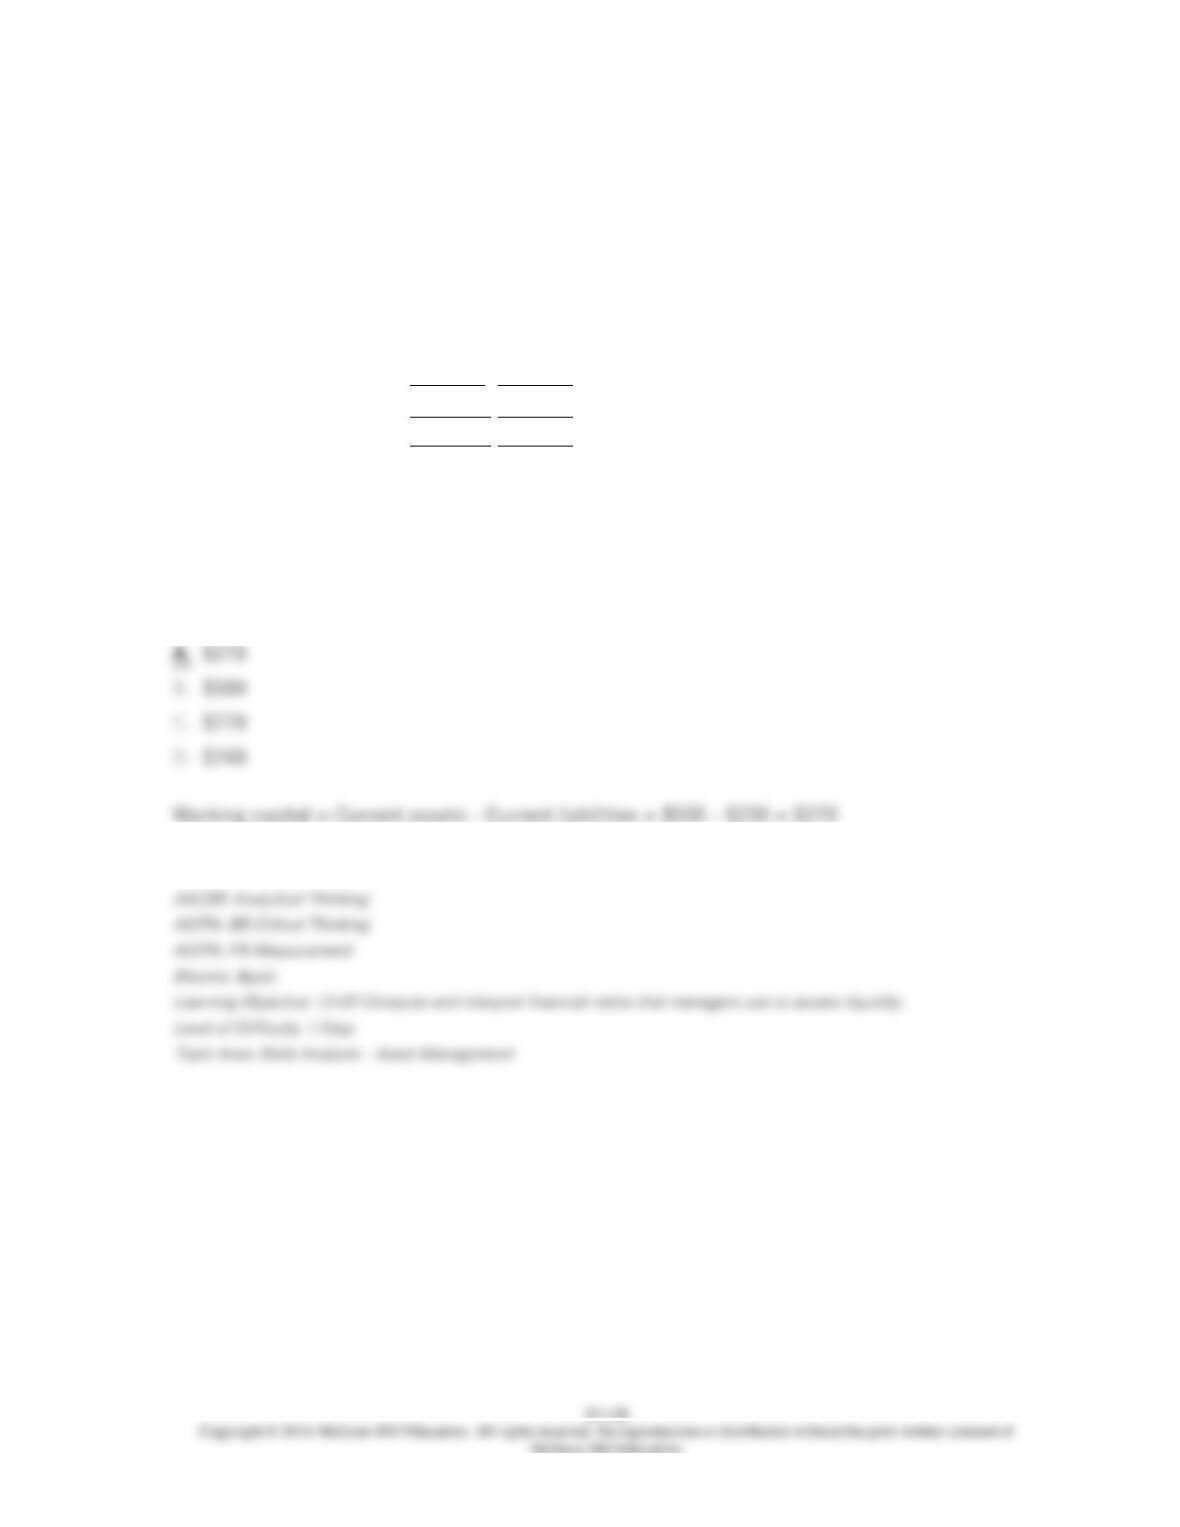
The working capital at the end of Year 2 is:
151. Data from Dunshee Corporation’s most recent balance sheet appear below:
Year 2 Year 1
Current assets:
Cash $130 $100
Accounts receivable 270 290
Inventory 90 110
Prepaid expenses 10 10
Total current assets $500 $510
Total current liabilities $230 $220
Sales on account in Year 2 amounted to $1,170 and the cost of goods sold was $730.
The current ratio at the end of Year 2 is closest to:
152. Data from Dunshee Corporation’s most recent balance sheet appear below:
Year 2 Year 1
Current assets:
Cash $130 $100
Accounts receivable 270 290
Inventory 90 110
Prepaid expenses 10 10
Total current assets $500 $510
Total current liabilities $230 $220
Sales on account in Year 2 amounted to $1,170 and the cost of goods sold was $730.
The acid-test ratio at the end of Year 2 is closest to:
153. Data from Dunshee Corporation’s most recent balance sheet appear below:
Year 2 Year 1
Current assets:
Cash $130 $100
Accounts receivable 270 290
Inventory 90 110
Prepaid expenses 10 10
Total current assets $500 $510
Total current liabilities $230 $220
Sales on account in Year 2 amounted to $1,170 and the cost of goods sold was $730.
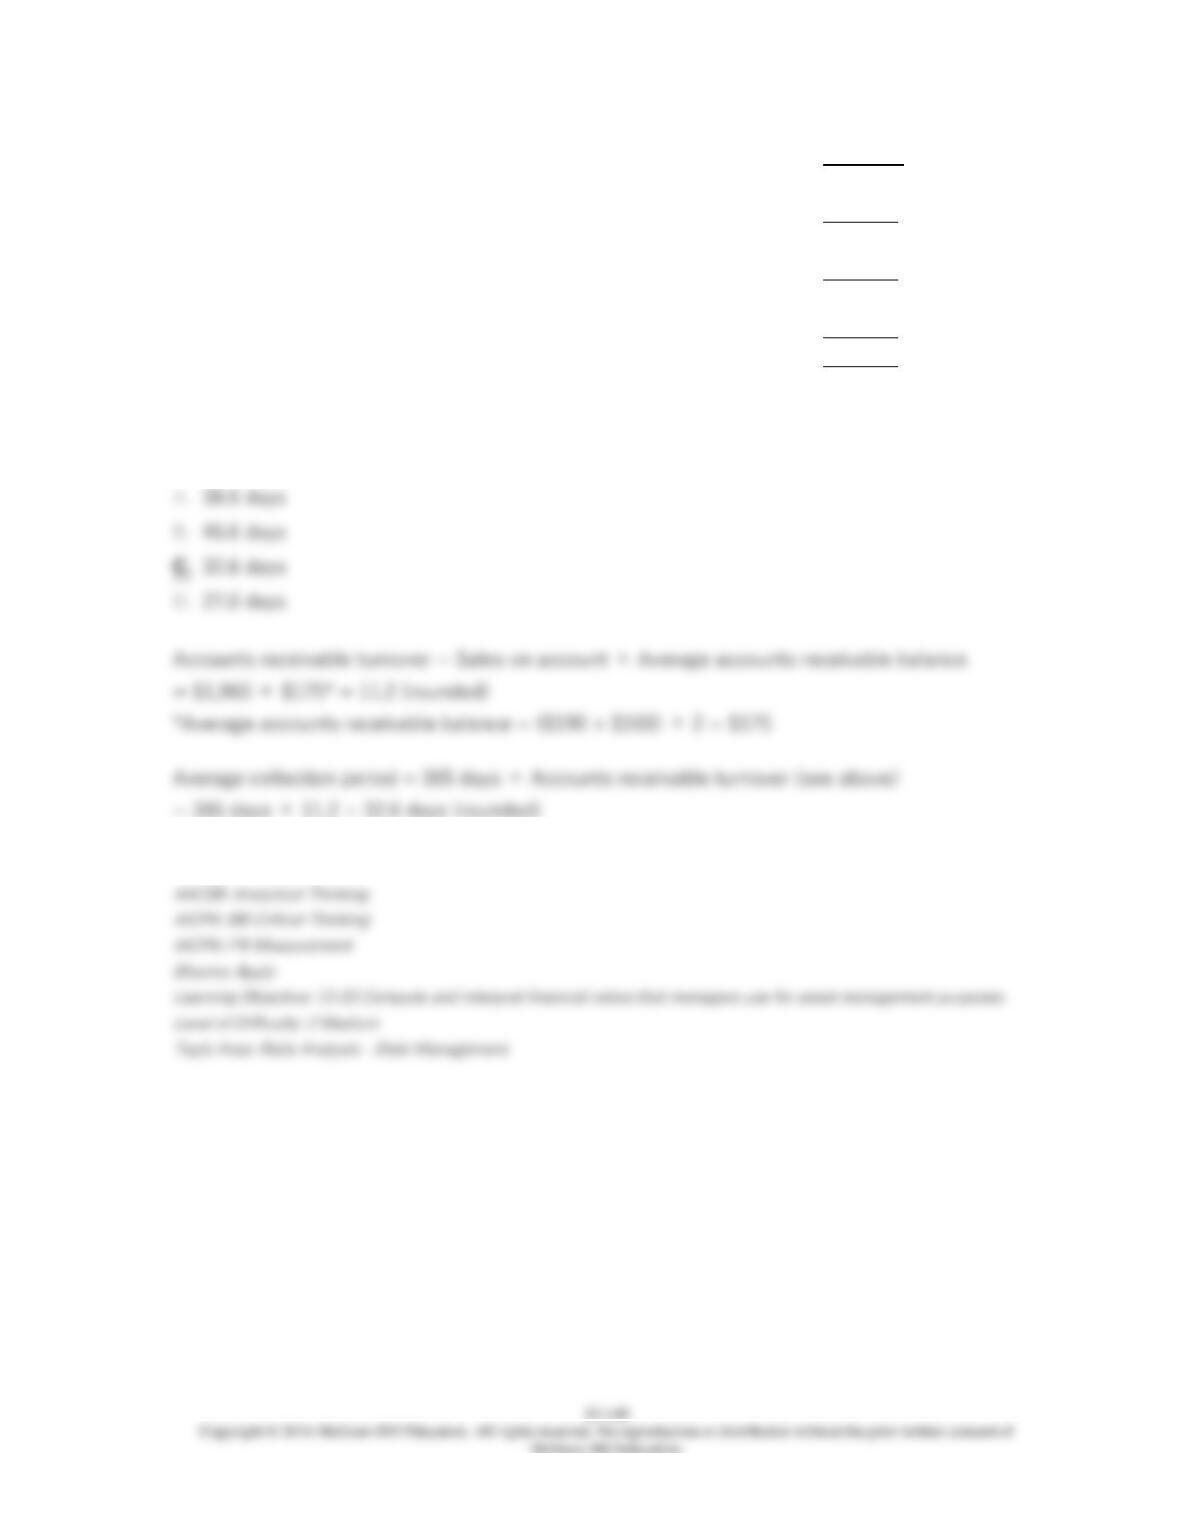
The average collection period for Year 2 is closest to:
154. Data from Dunshee Corporation’s most recent balance sheet appear below:
Year 2 Year 1
Current assets:
Cash $130 $100
Accounts receivable 270 290
Inventory 90 110
Prepaid expenses 10 10
Total current assets $500 $510
Total current liabilities $230 $220
Sales on account in Year 2 amounted to $1,170 and the cost of goods sold was $730.
The average sale period for Year 2 is closest to:

13-131
155. Financial statements for Maraby Corporation appear below:
Maraby Corporation
Balance Sheet
December 31, Year 2 and Year 1
(dollars in thousands)
Year 2 Year 1
Current assets:
Cash and marketable securities $220 $190
Accounts receivable, net 190 160
Inventory 140 150
Prepaid expenses 70 80
Total current assets 620 580
Noncurrent assets:
Plant & equipment, net 1,180 1,150
Total assets $1,800 $1,730
Current liabilities:
Accounts payable $100 $120
Accrued liabilities 100 70
Notes payable, short term 160 160
Total current liabilities 360 350
Noncurrent liabilities:
Bonds payable 450 500
Total liabilities 810 850
Stockholders’ equity:
Common stock, $5 par 160 160
Additional paid-in capital-common stock 200 200
Retained earnings 630 520
Total stockholders’ equity 990 880
Total liabilities & stockholders’ equity $1,800 $1,730
Maraby Corporation
Income Statement
For the Year Ended December 31, Year 2
(dollars in thousands)
Sales (all on account) $1,960
Cost of goods sold 1,370
Gross margin 590
Selling and administrative expense 230
Net operating income 360
Interest expense 50
Net income before taxes 310
Income taxes (30%) 93
Net income $217
Maraby Corporation’s working capital (in thousands of dollars) at the end of Year 2 was closest
to:

13-133
156. Financial statements for Maraby Corporation appear below:
Maraby Corporation
Balance Sheet
December 31, Year 2 and Year 1
(dollars in thousands)
Year 2 Year 1
Current assets:
Cash and marketable securities $220 $190
Accounts receivable, net 190 160
Inventory 140 150
Prepaid expenses 70 80
Total current assets 620 580
Noncurrent assets:
Plant & equipment, net 1,180 1,150
Total assets $1,800 $1,730
Current liabilities:
Accounts payable $100 $120
Accrued liabilities 100 70
Notes payable, short term 160 160
Total current liabilities 360 350
Noncurrent liabilities:
Bonds payable 450 500
Total liabilities 810 850
Stockholders’ equity:
Common stock, $5 par 160 160
Additional paid-in capital-common stock 200 200
Retained earnings 630 520
Total stockholders’ equity 990 880
Total liabilities & stockholders’ equity $1,800 $1,730
Maraby Corporation
Income Statement
For the Year Ended December 31, Year 2
(dollars in thousands)
Sales (all on account) $1,960
Cost of goods sold 1,370
Gross margin 590
Selling and administrative expense 230
Net operating income 360
Interest expense 50
Net income before taxes 310
Income taxes (30%) 93
Net income $217
Maraby Corporation’s current ratio at the end of Year 2 was closest to:

13-135
157. Financial statements for Maraby Corporation appear below:
Maraby Corporation
Balance Sheet
December 31, Year 2 and Year 1
(dollars in thousands)
Year 2 Year 1
Current assets:
Cash and marketable securities $220 $190
Accounts receivable, net 190 160
Inventory 140 150
Prepaid expenses 70 80
Total current assets 620 580
Noncurrent assets:
Plant & equipment, net 1,180 1,150
Total assets $1,800 $1,730
Current liabilities:
Accounts payable $100 $120
Accrued liabilities 100 70
Notes payable, short term 160 160
Total current liabilities 360 350
Noncurrent liabilities:
Bonds payable 450 500
Total liabilities 810 850
Stockholders’ equity:
Common stock, $5 par 160 160
Additional paid-in capital-common stock 200 200
Retained earnings 630 520
Total stockholders’ equity 990 880
Total liabilities & stockholders’ equity $1,800 $1,730
Maraby Corporation
Income Statement
For the Year Ended December 31, Year 2
(dollars in thousands)
Sales (all on account) $1,960
Cost of goods sold 1,370
Gross margin 590
Selling and administrative expense 230
Net operating income 360
Interest expense 50
Net income before taxes 310
Income taxes (30%) 93
Net income $217
Maraby Corporation’s acid-test ratio at the end of Year 2 was closest to:

13-137
158. Financial statements for Maraby Corporation appear below:
Maraby Corporation
Balance Sheet
December 31, Year 2 and Year 1
(dollars in thousands)
Year 2 Year 1
Current assets:
Cash and marketable securities $220 $190
Accounts receivable, net 190 160
Inventory 140 150
Prepaid expenses 70 80
Total current assets 620 580
Noncurrent assets:
Plant & equipment, net 1,180 1,150
Total assets $1,800 $1,730
Current liabilities:
Accounts payable $100 $120
Accrued liabilities 100 70
Notes payable, short term 160 160
Total current liabilities 360 350
Noncurrent liabilities:
Bonds payable 450 500
Total liabilities 810 850
Stockholders’ equity:
Common stock, $5 par 160 160
Additional paid-in capital-common stock 200 200
Retained earnings 630 520
Total stockholders’ equity 990 880
Total liabilities & stockholders’ equity $1,800 $1,730
Maraby Corporation
Income Statement
For the Year Ended December 31, Year 2
(dollars in thousands)
Sales (all on account) $1,960
Cost of goods sold 1,370
Gross margin 590
Selling and administrative expense 230
Net operating income 360
Interest expense 50
Net income before taxes 310
Income taxes (30%) 93
Net income $217
Maraby Corporation’s accounts receivable turnover for Year 2 was closest to:

13-139
159. Financial statements for Maraby Corporation appear below:
Maraby Corporation
Balance Sheet
December 31, Year 2 and Year 1
(dollars in thousands)
Year 2 Year 1
Current assets:
Cash and marketable securities $220 $190
Accounts receivable, net 190 160
Inventory 140 150
Prepaid expenses 70 80
Total current assets 620 580
Noncurrent assets:
Plant & equipment, net 1,180 1,150
Total assets $1,800 $1,730
Current liabilities:
Accounts payable $100 $120
Accrued liabilities 100 70
Notes payable, short term 160 160
Total current liabilities 360 350
Noncurrent liabilities:
Bonds payable 450 500
Total liabilities 810 850
Stockholders’ equity:
Common stock, $5 par 160 160
Additional paid-in capital-common stock 200 200
Retained earnings 630 520
Total stockholders’ equity 990 880
Total liabilities & stockholders’ equity $1,800 $1,730
Maraby Corporation
Income Statement
For the Year Ended December 31, Year 2
(dollars in thousands)
Sales (all on account) $1,960
Cost of goods sold 1,370
Gross margin 590
Selling and administrative expense 230
Net operating income 360
Interest expense 50
Net income before taxes 310
Income taxes (30%) 93
Net income $217
Maraby Corporation’s average collection period for Year 2 was closest to: