13–385
137.
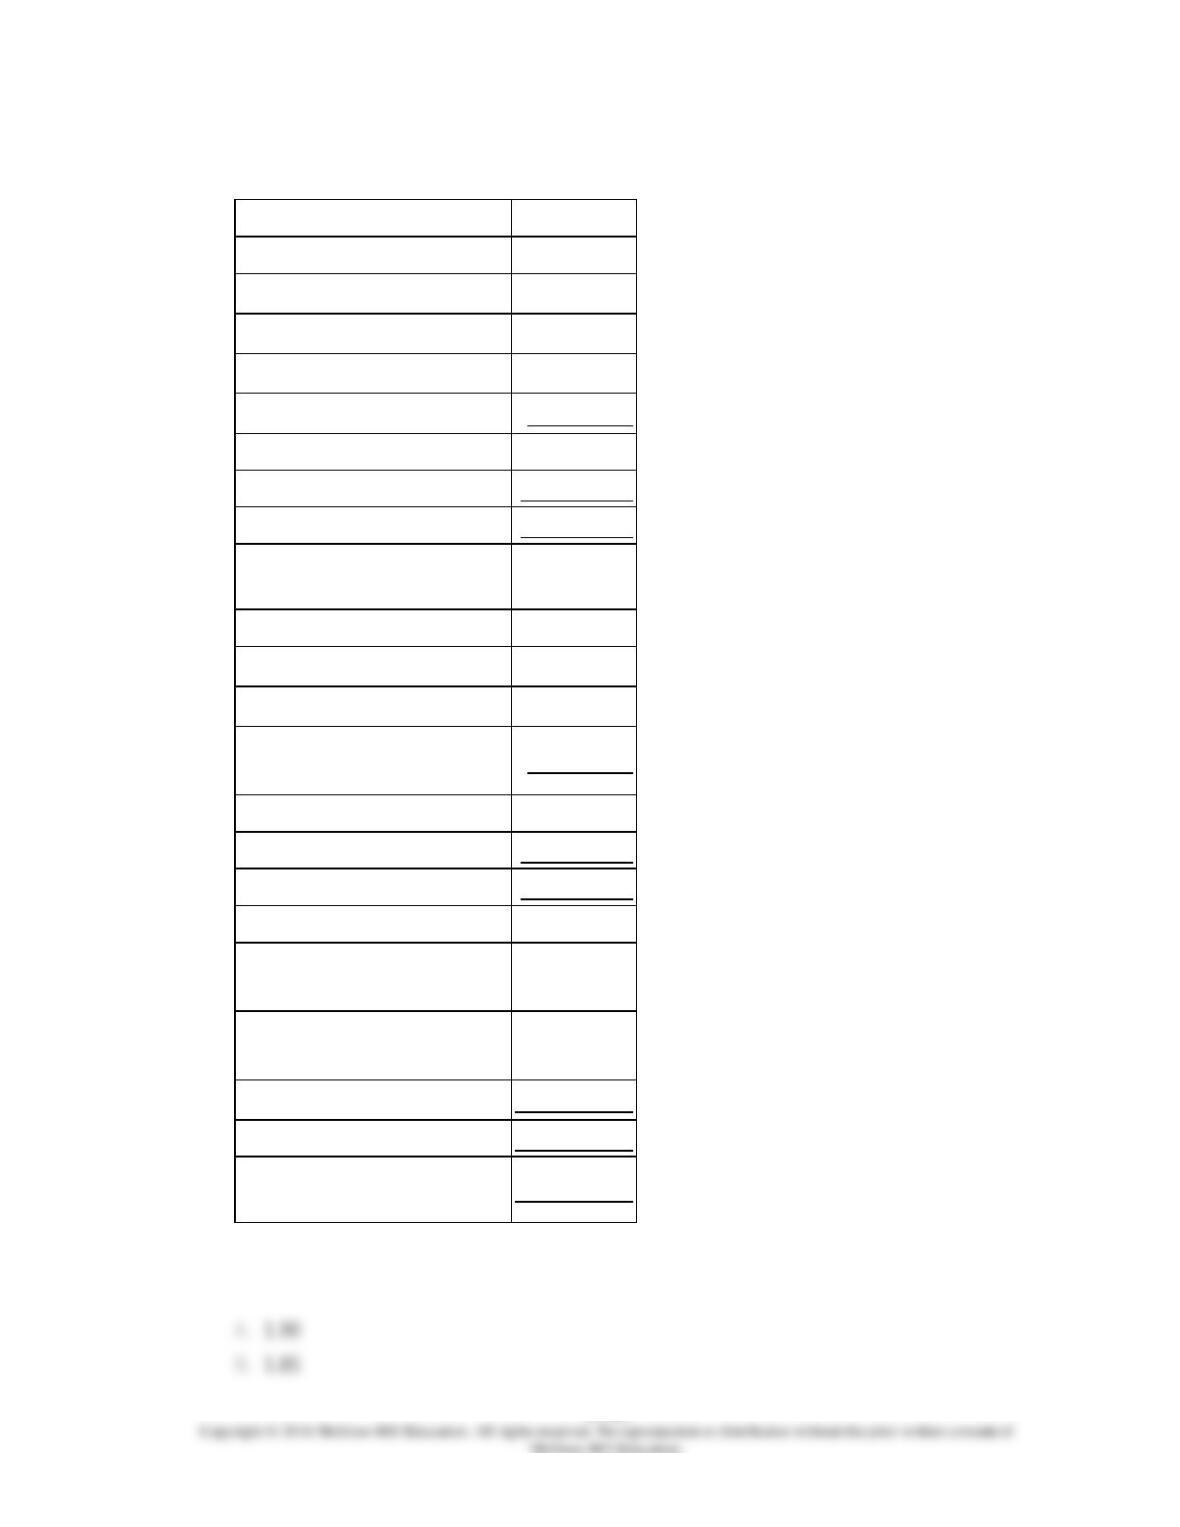
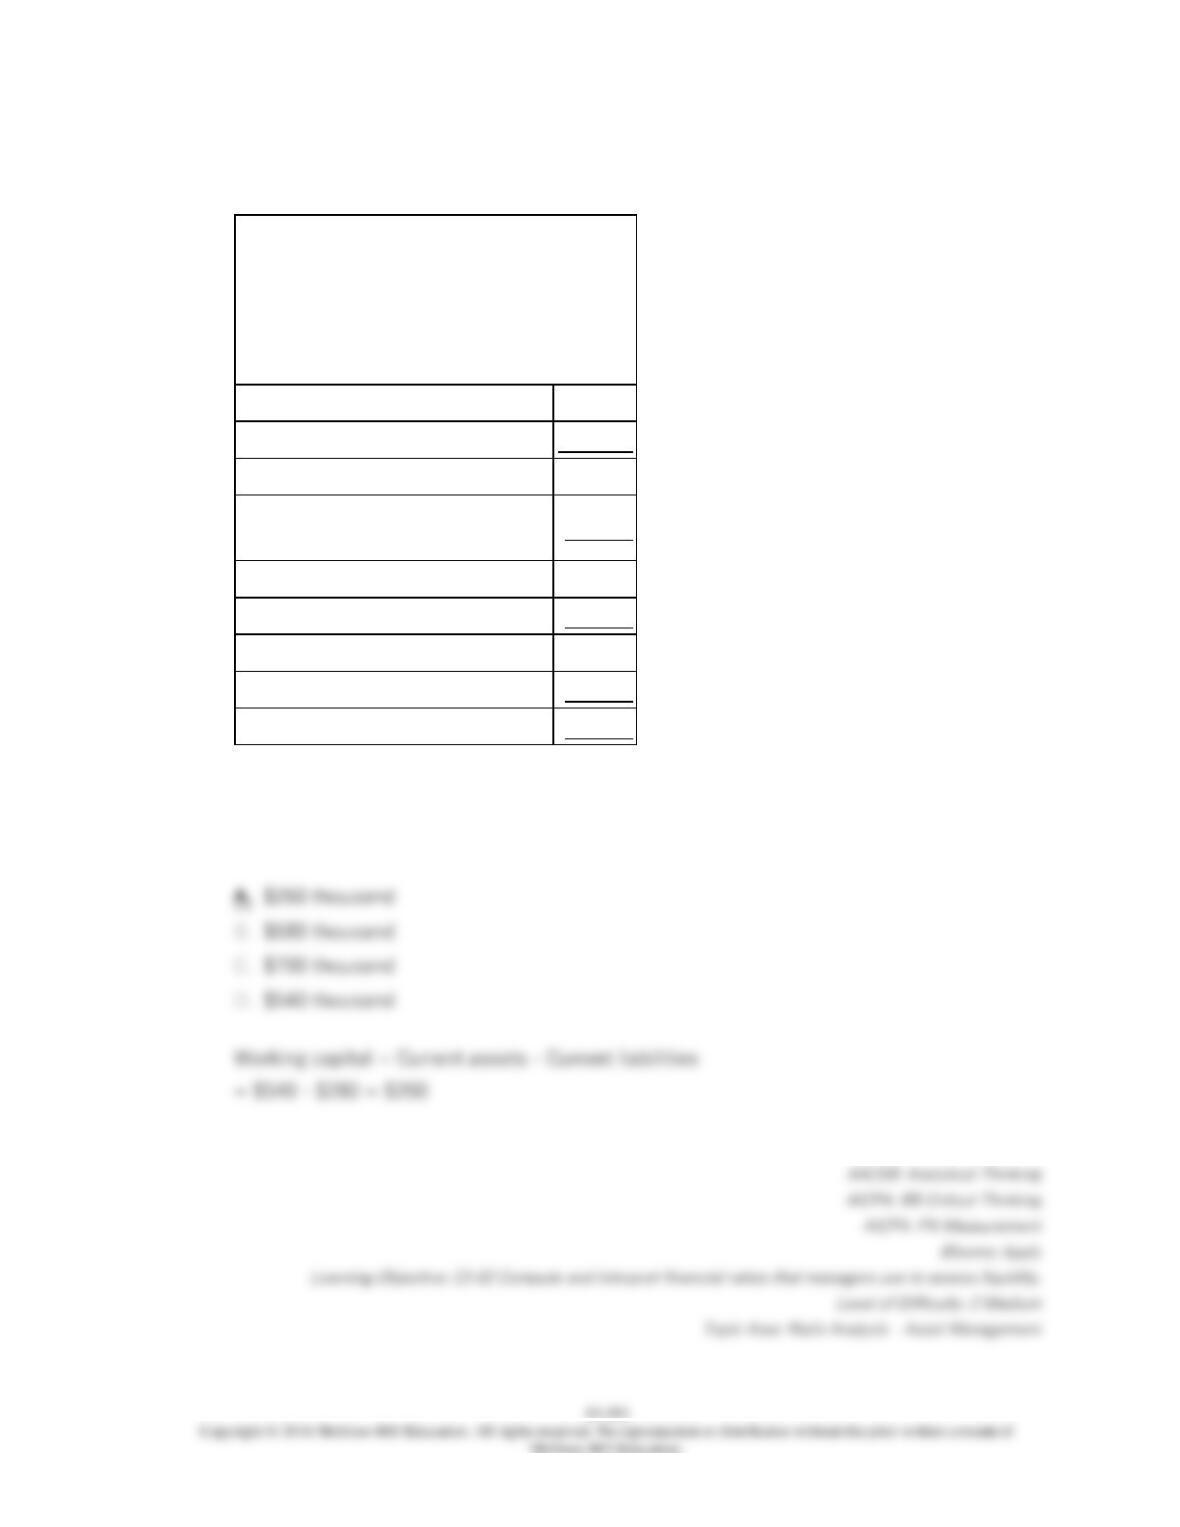
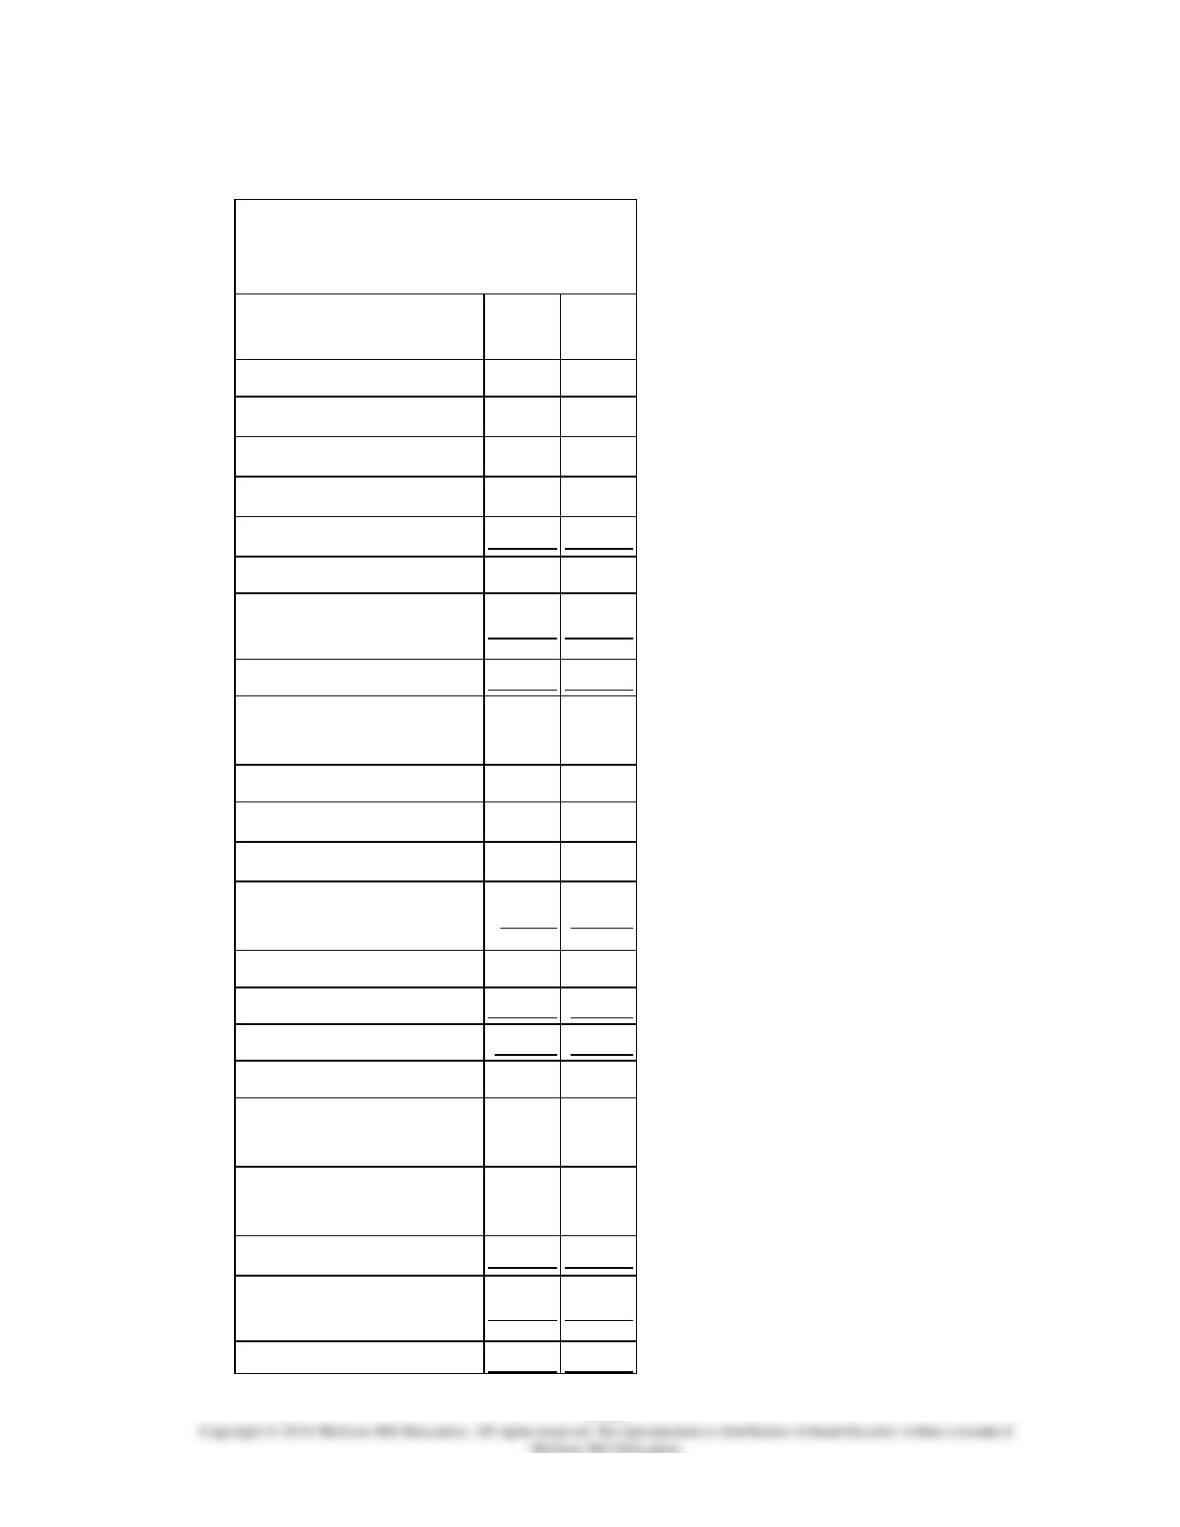
Mayfield Corporation has provided the following financial data:
Assets
Current assets:
Cash
$223,000
Accounts receivable
236,000
Inventory
202,000
Prepaid expenses
10,000
Total current assets
671,000
Plant and equipment, net
665,000
Total assets
$1,336,000
Liabilities and
Stockholders’ Equity
Current liabilities:
Accounts payable
$156,000
Accrued liabilities
52,000
Notes payable, short
term
45,000
Total current liabilities
253,000
Bonds payable
100,000
Total liabilities
353,000
Stockholders’ equity:
Common stock, $4 par
value
360,000
Additional paid-in
capital-common stock
80,000
Retained earnings
543,000
Total stockholders’ equity
983,000
Total liabilities &
stockholders’ equity
$1,336,000
The company’s acid-test (quick) ratio is closest to:
13–386
138.
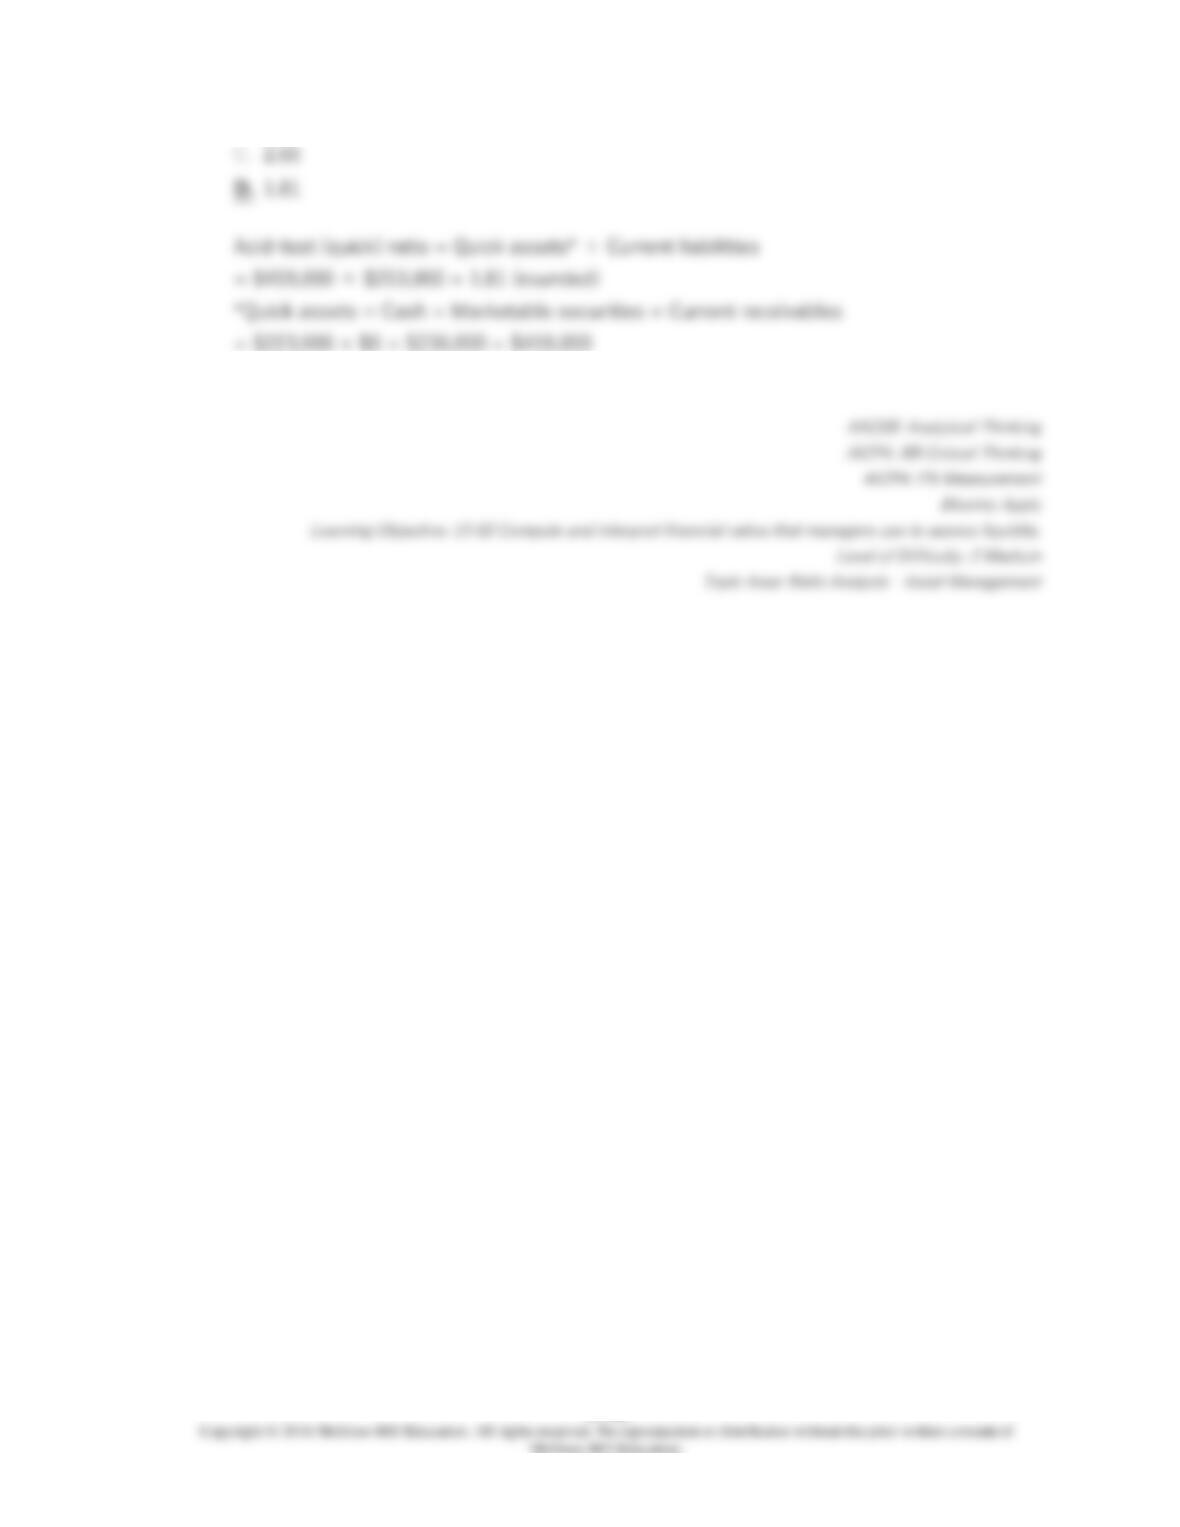
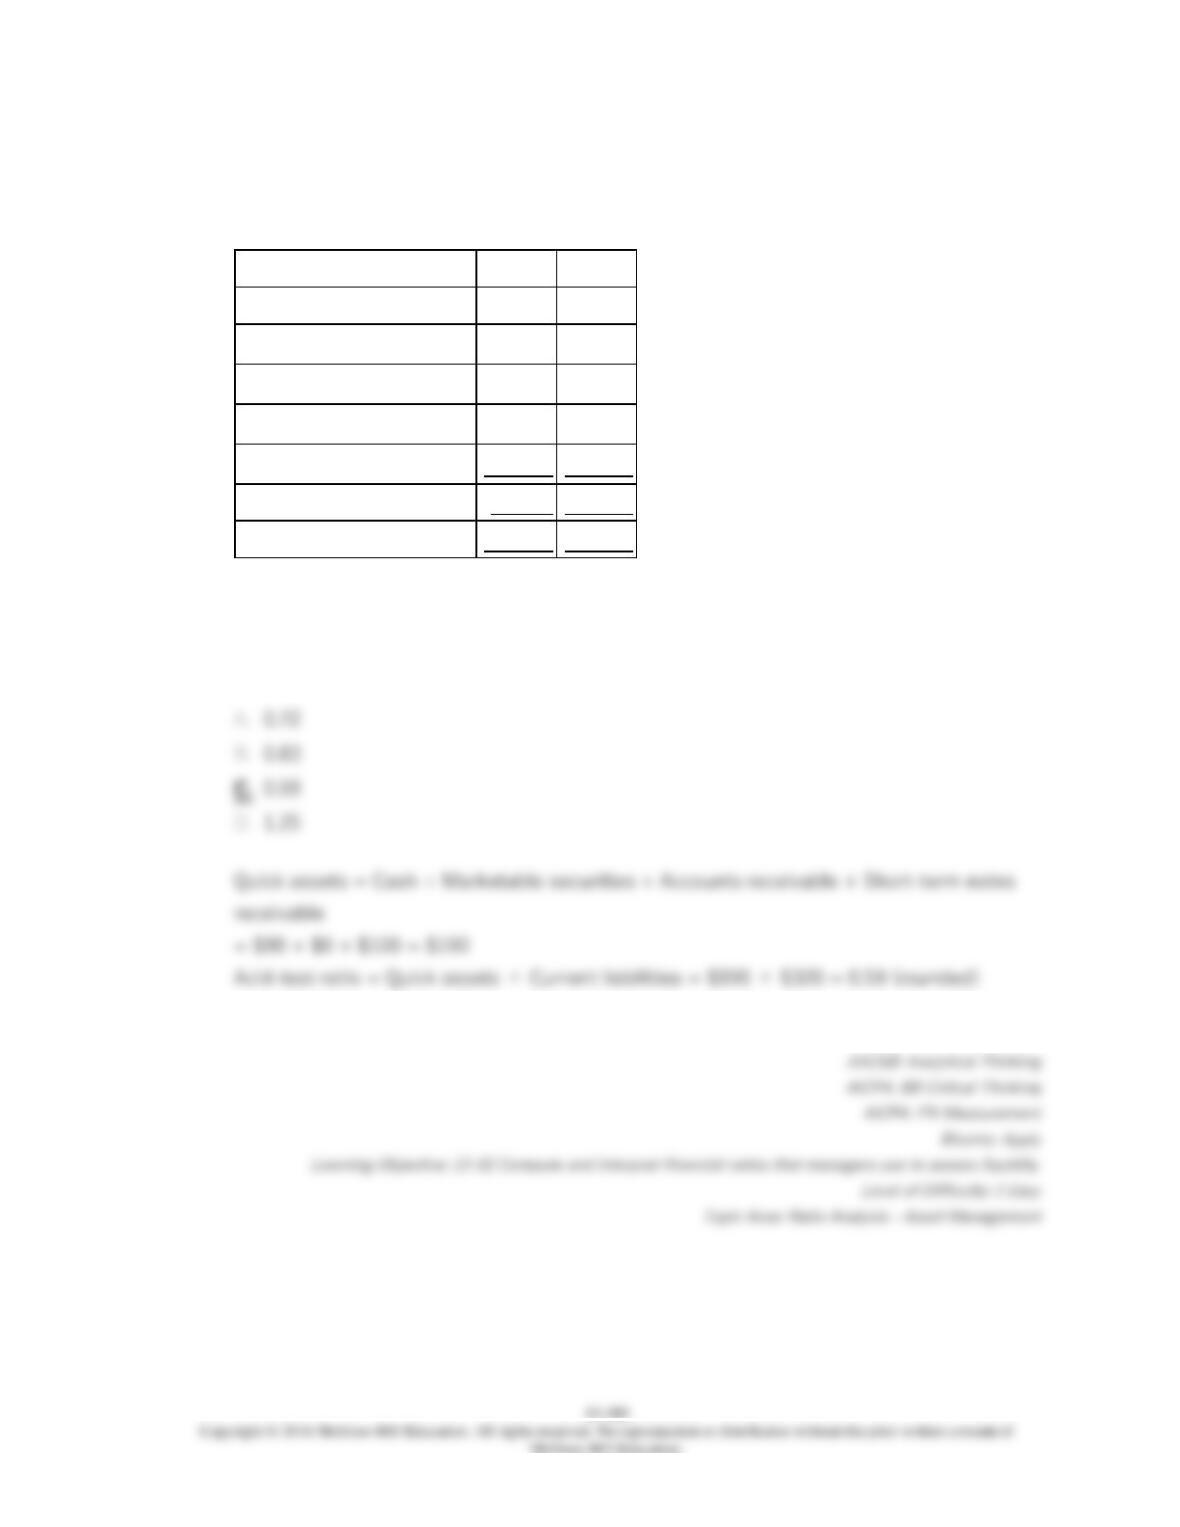
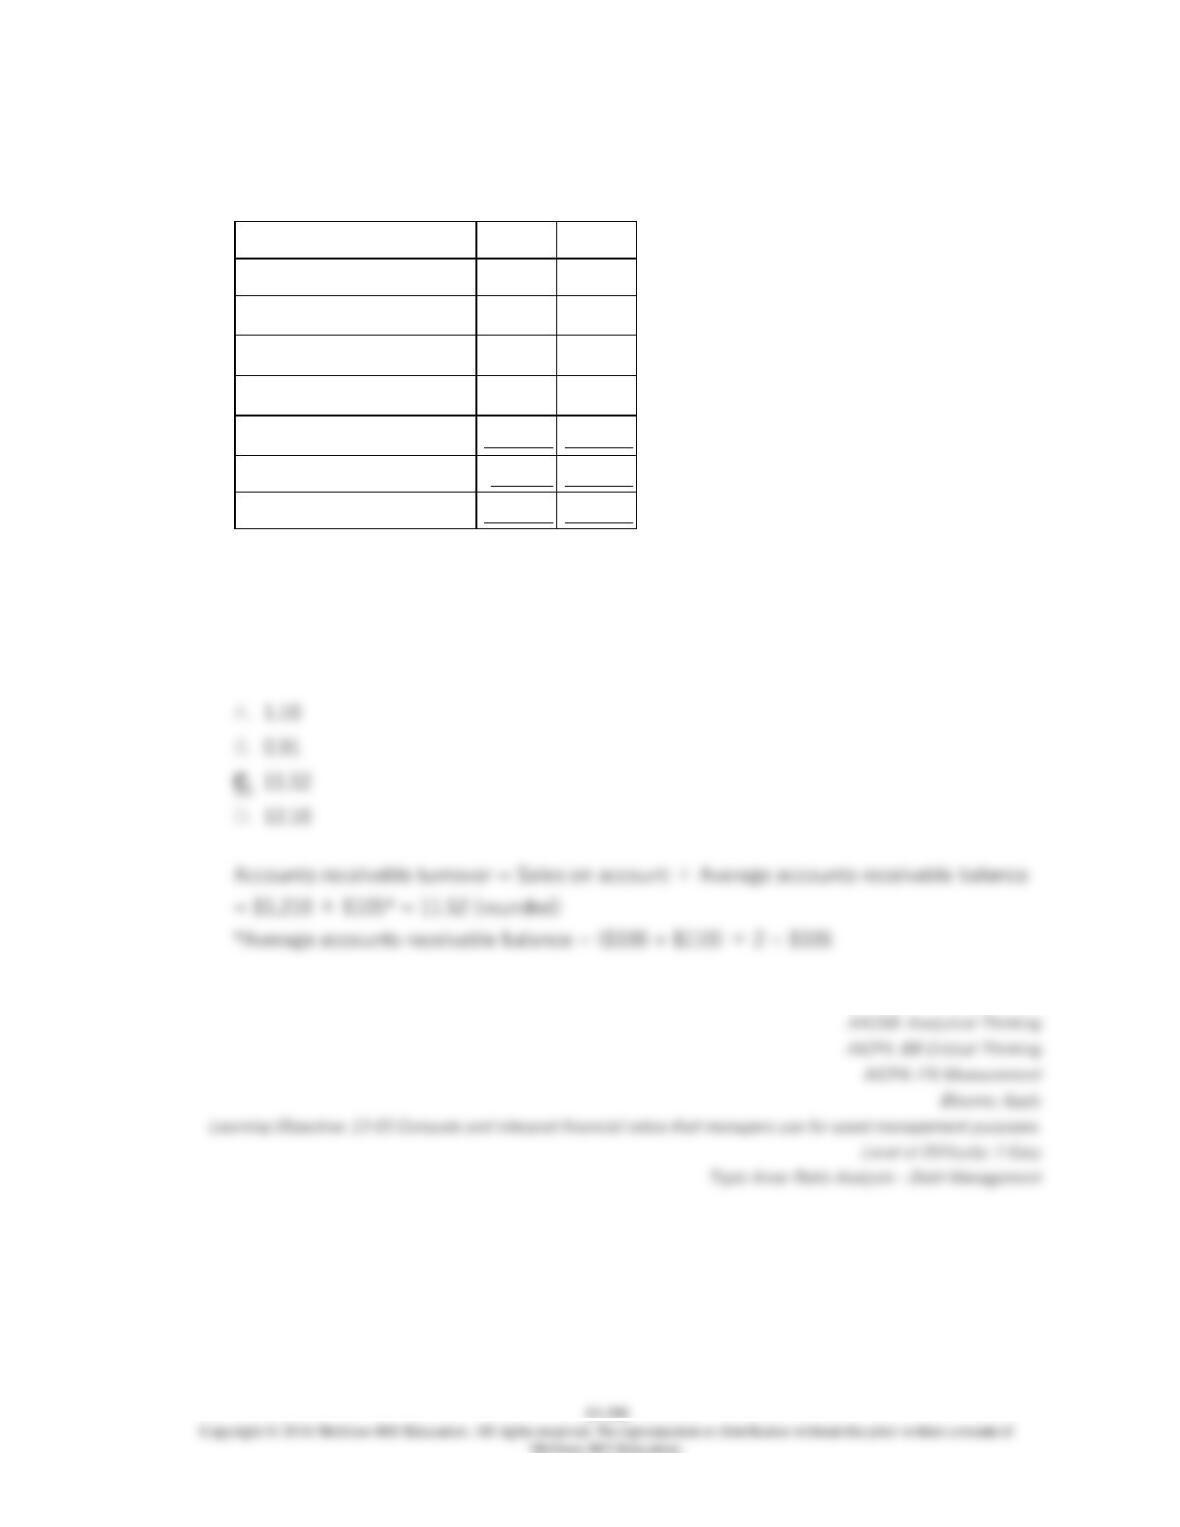
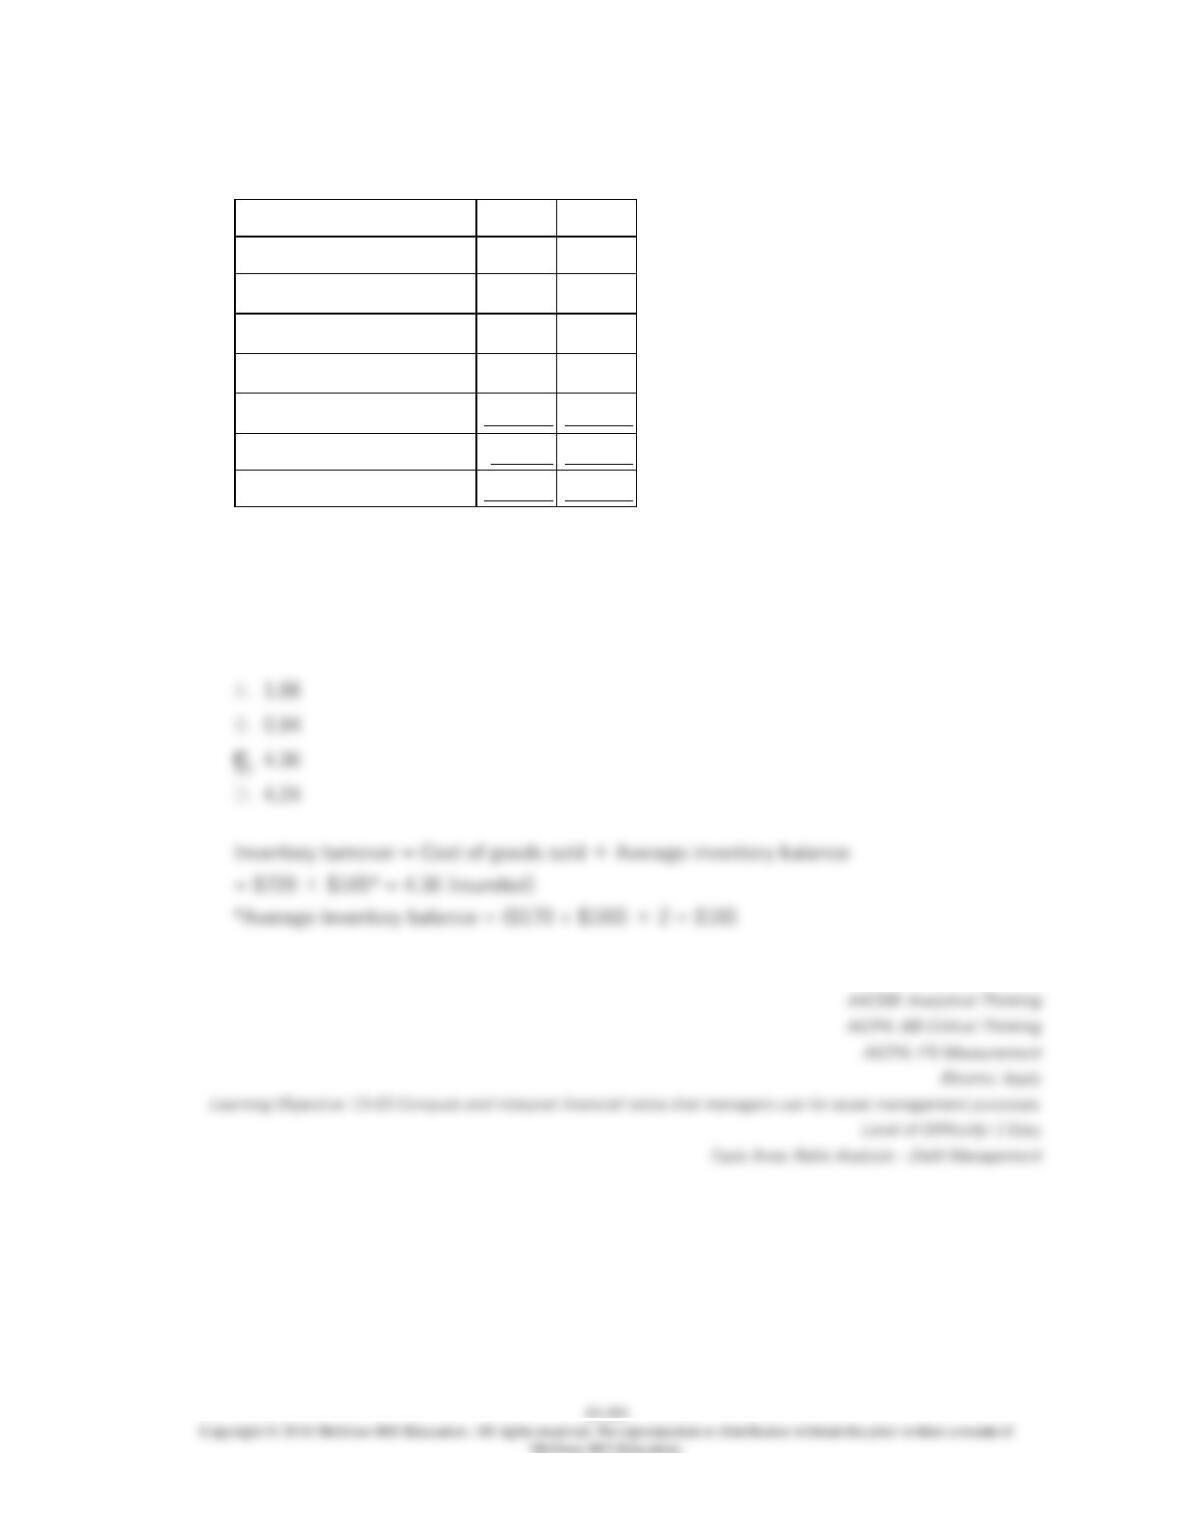
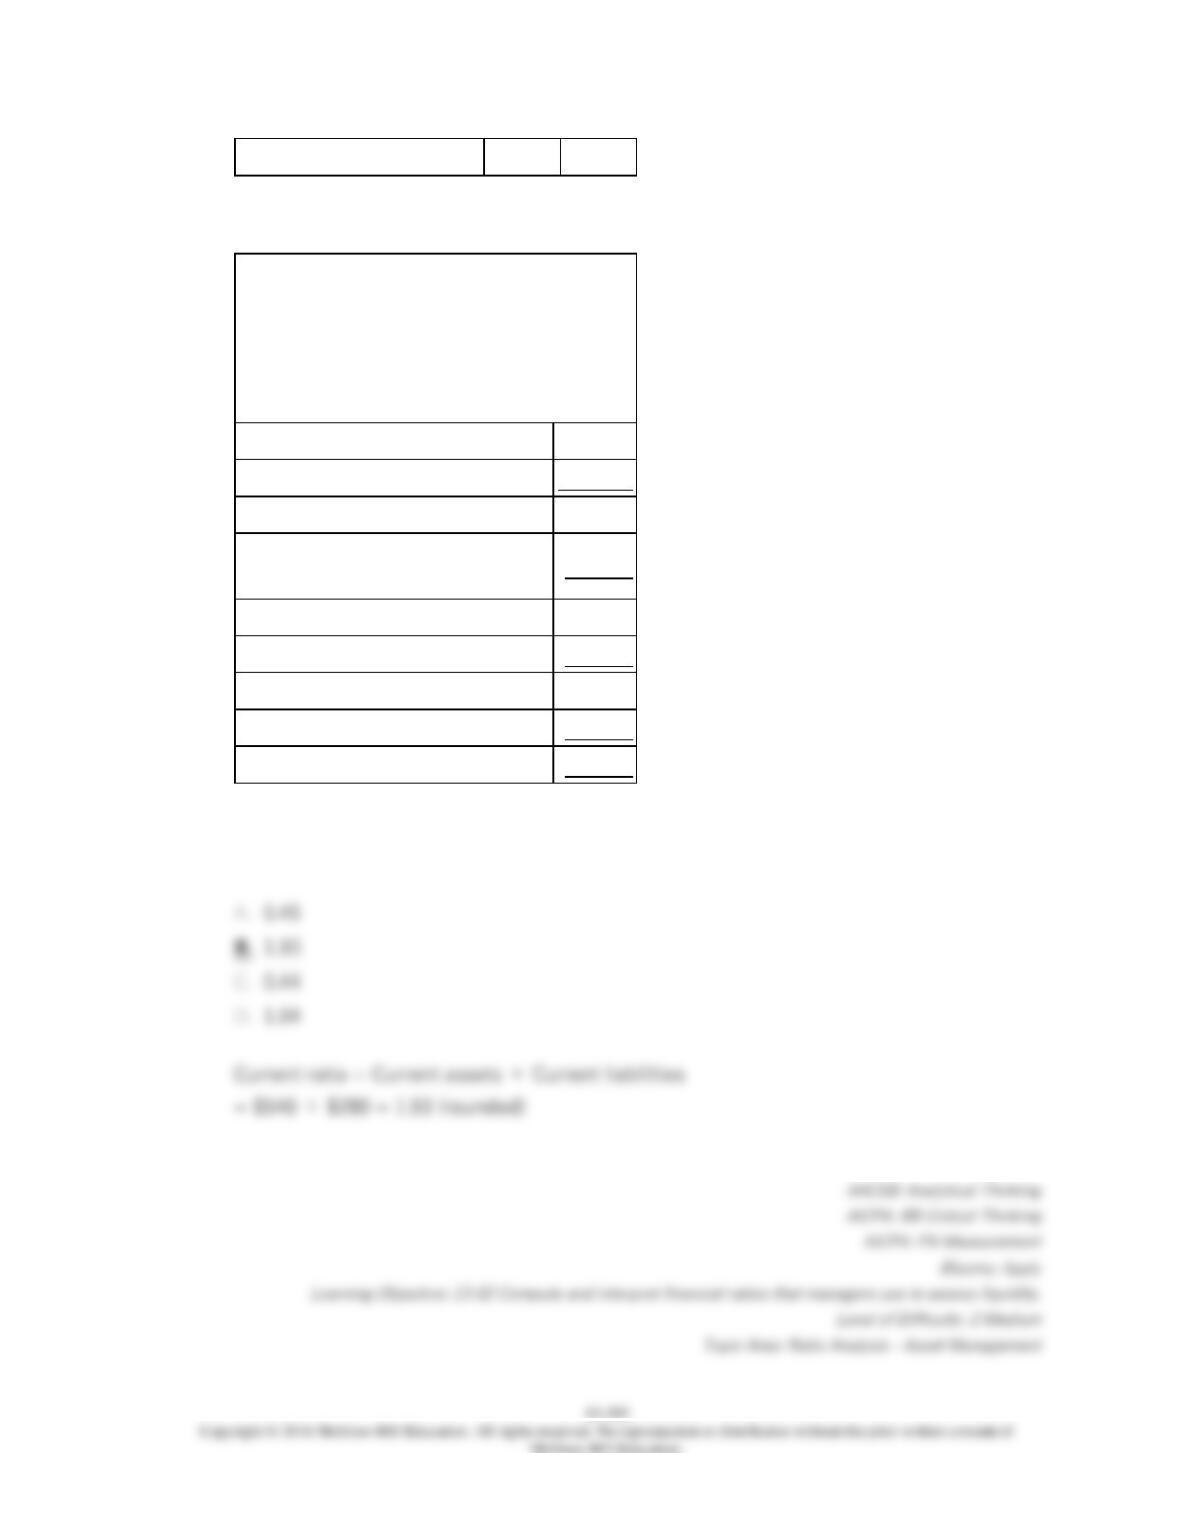
Excerpts from Colter Corporation’s most recent balance sheet appear below:
Year 2
Year 1
Current assets:
Cash
$90
$120
Accounts receivable
100
110
Inventory
170
160
Prepaid expenses
40
40
Total current assets
$400
$430
Total current liabilities
$320
$290
Sales on account in Year 2 amounted to $1,210 and the cost of goods sold was $720.
The working capital at the end of Year 2 is:
139.
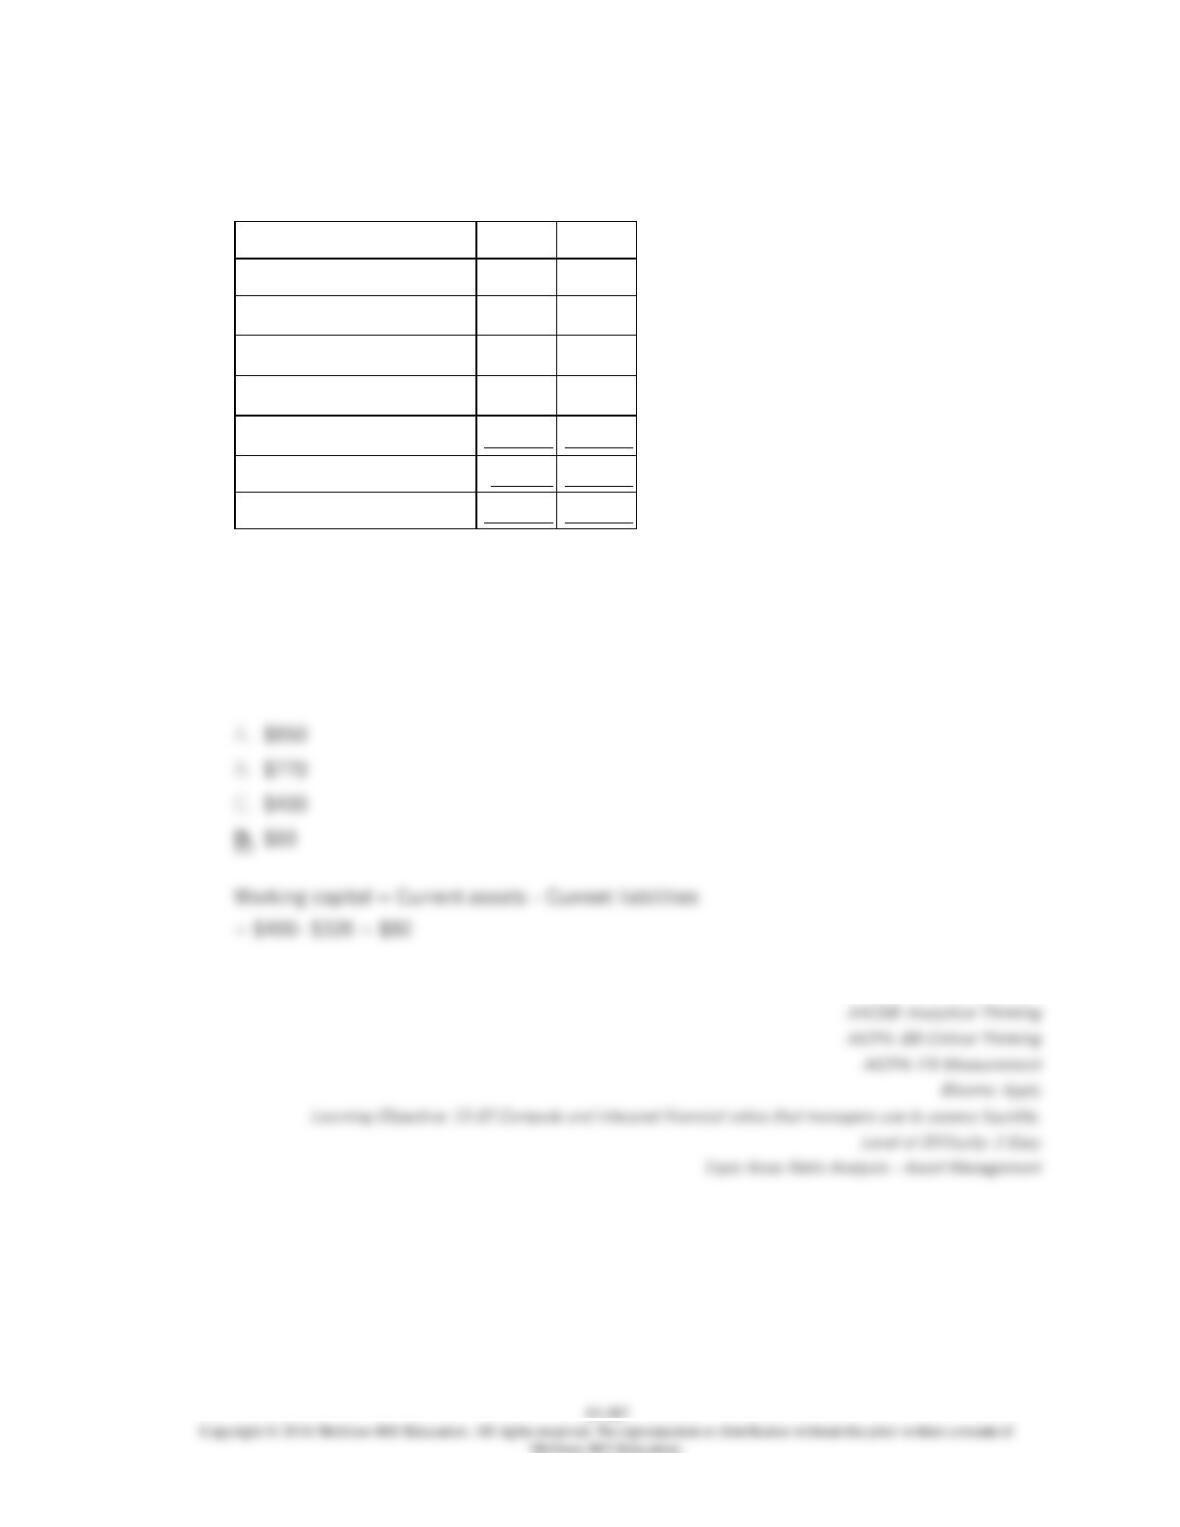
Excerpts from Colter Corporation’s most recent balance sheet appear below:
Year 2
Year 1
Current assets:
Cash
$90
$120
Accounts receivable
100
110
Inventory
170
160
Prepaid expenses
40
40
Total current assets
$400
$430
Total current liabilities
$320
$290
Sales on account in Year 2 amounted to $1,210 and the cost of goods sold was $720.
The current ratio at the end of Year 2 is closest to:
140.
Excerpts from Colter Corporation’s most recent balance sheet appear below:
Year 2
Year 1
Current assets:
Cash
$90
$120
Accounts receivable
100
110
Inventory
170
160
Prepaid expenses
40
40
Total current assets
$400
$430
Total current liabilities
$320
$290
Sales on account in Year 2 amounted to $1,210 and the cost of goods sold was $720.
The acid-test ratio at the end of Year 2 is closest to:
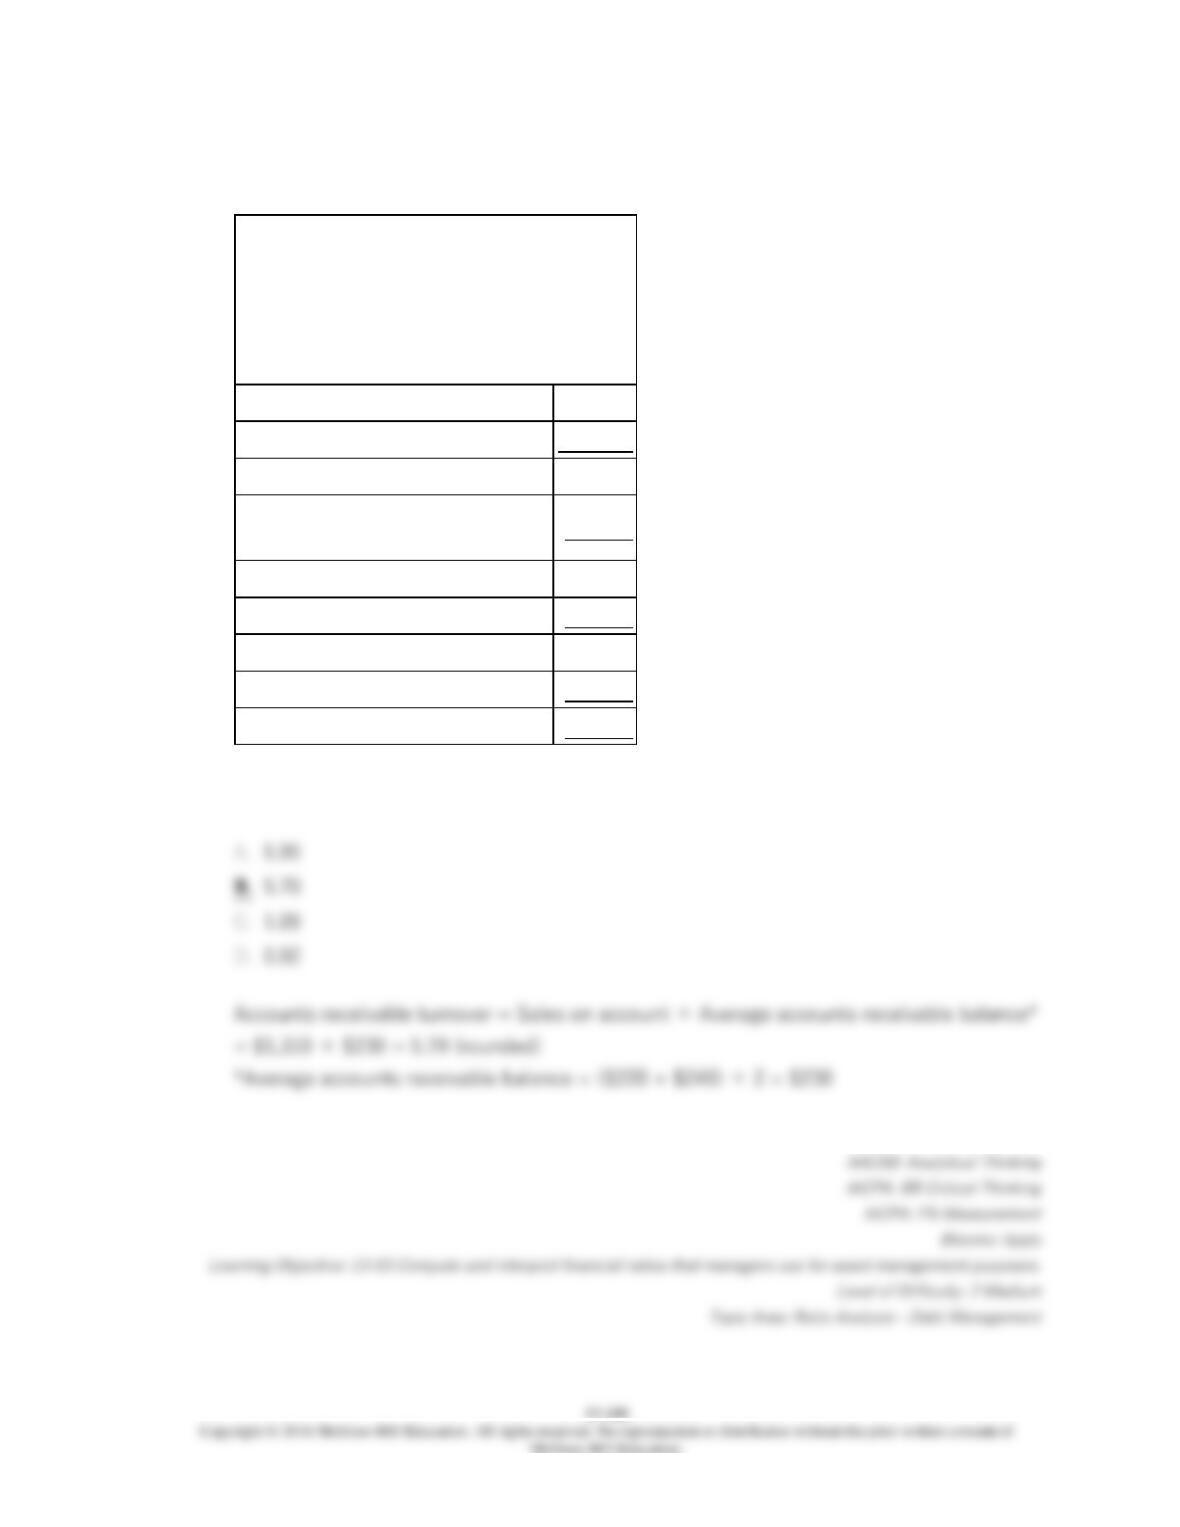
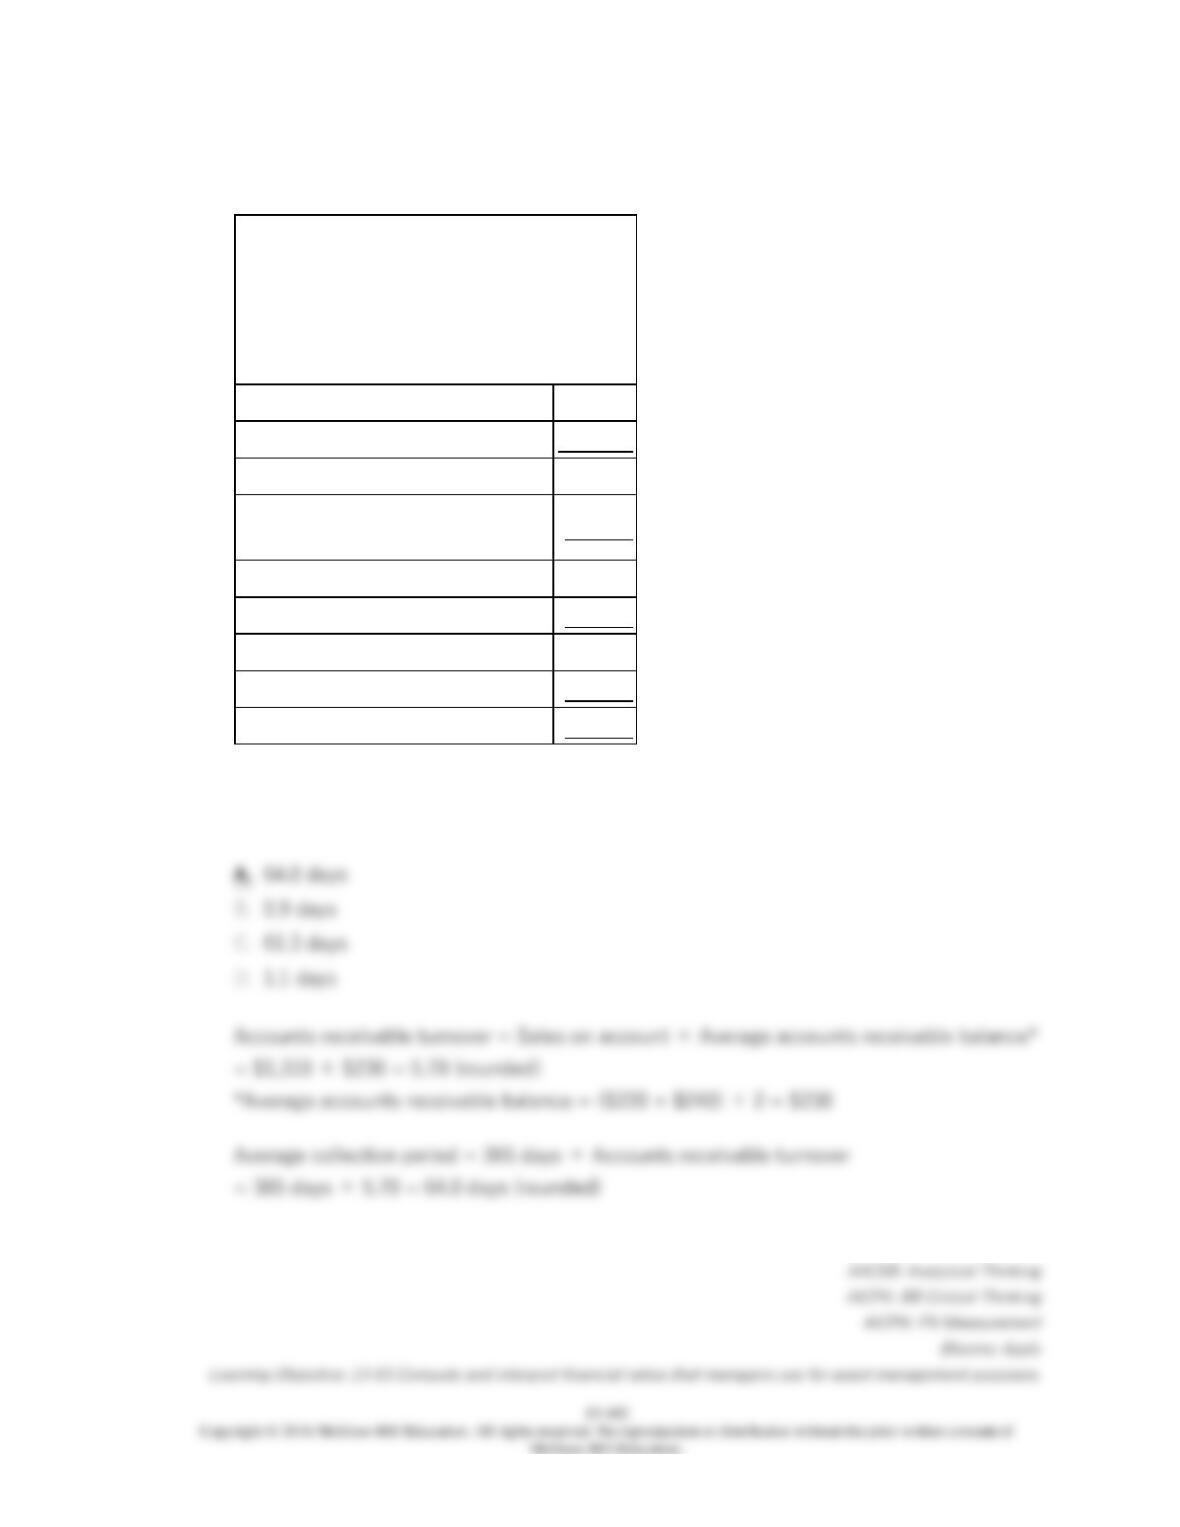
141.
Excerpts from Colter Corporation’s most recent balance sheet appear below:
Year 2
Year 1
Current assets:
Cash
$90
$120
Accounts receivable
100
110
Inventory
170
160
Prepaid expenses
40
40
Total current assets
$400
$430
Total current liabilities
$320
$290
Sales on account in Year 2 amounted to $1,210 and the cost of goods sold was $720.
The accounts receivable turnover for Year 2 is closest to:
142.
Excerpts from Colter Corporation’s most recent balance sheet appear below:
Year 2
Year 1
Current assets:
Cash
$90
$120
Accounts receivable
100
110
Inventory
170
160
Prepaid expenses
40
40
Total current assets
$400
$430
Total current liabilities
$320
$290
Sales on account in Year 2 amounted to $1,210 and the cost of goods sold was $720.
The inventory turnover for Year 2 is closest to:
13–392
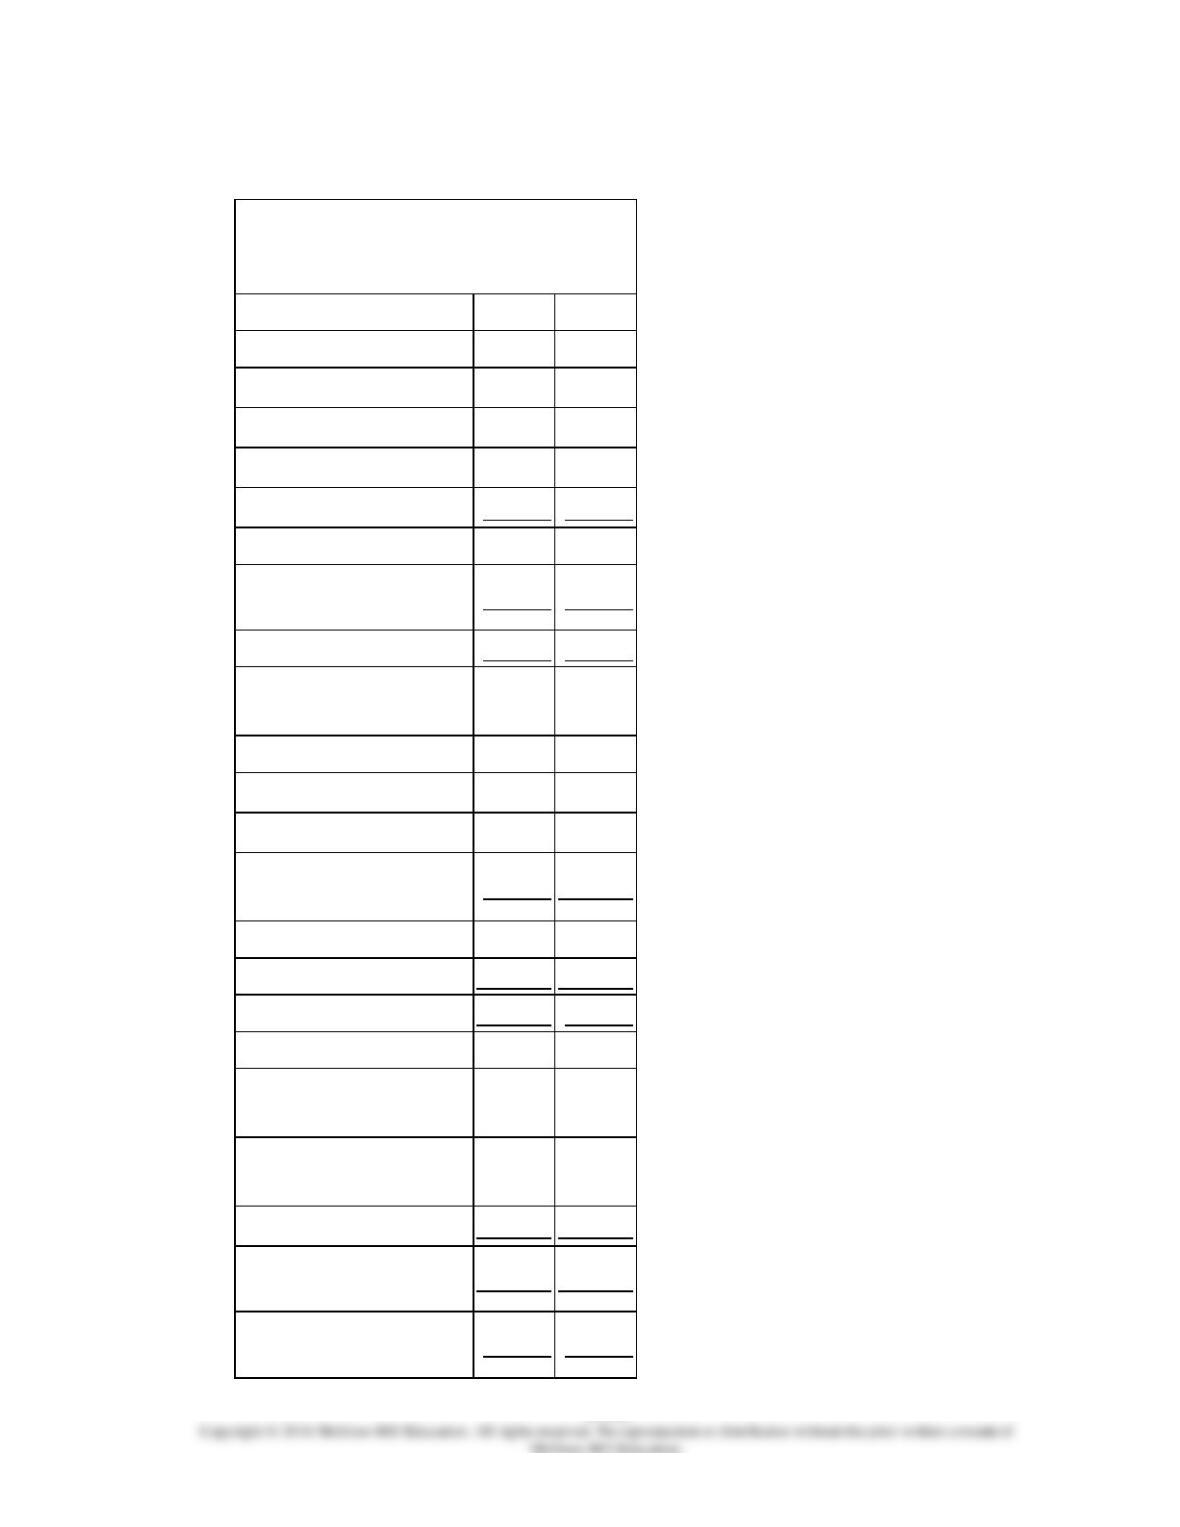
143.
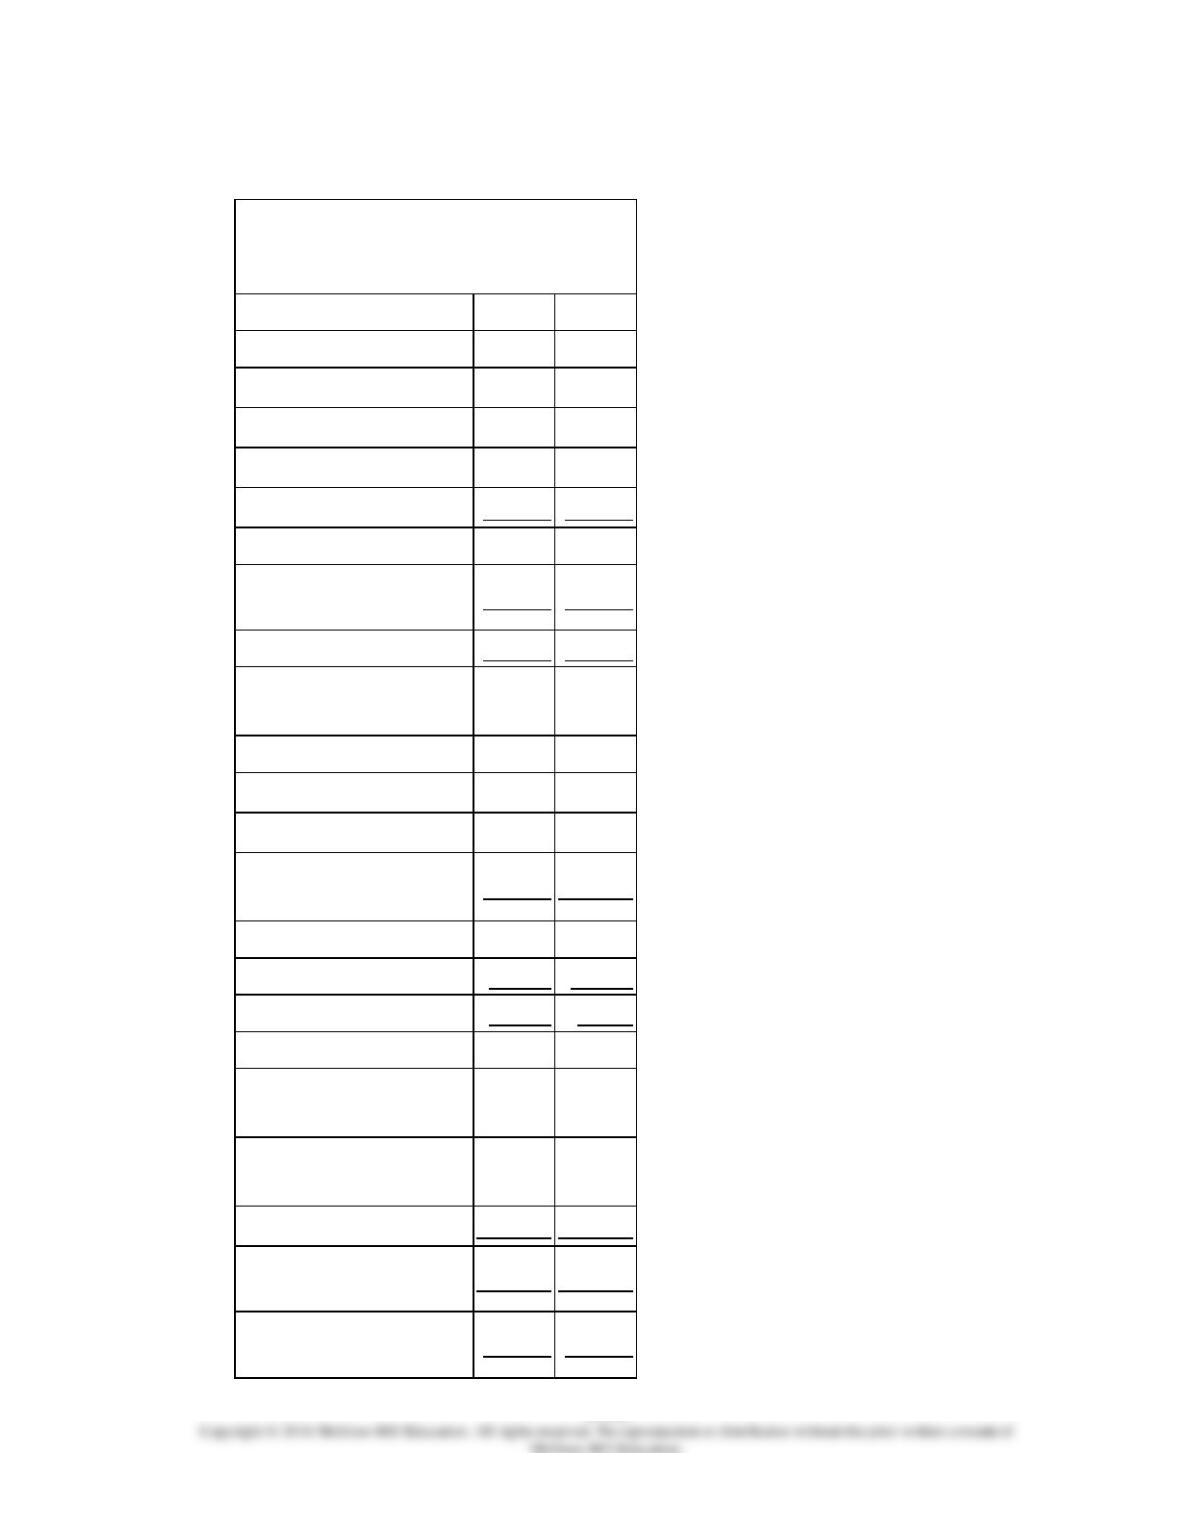
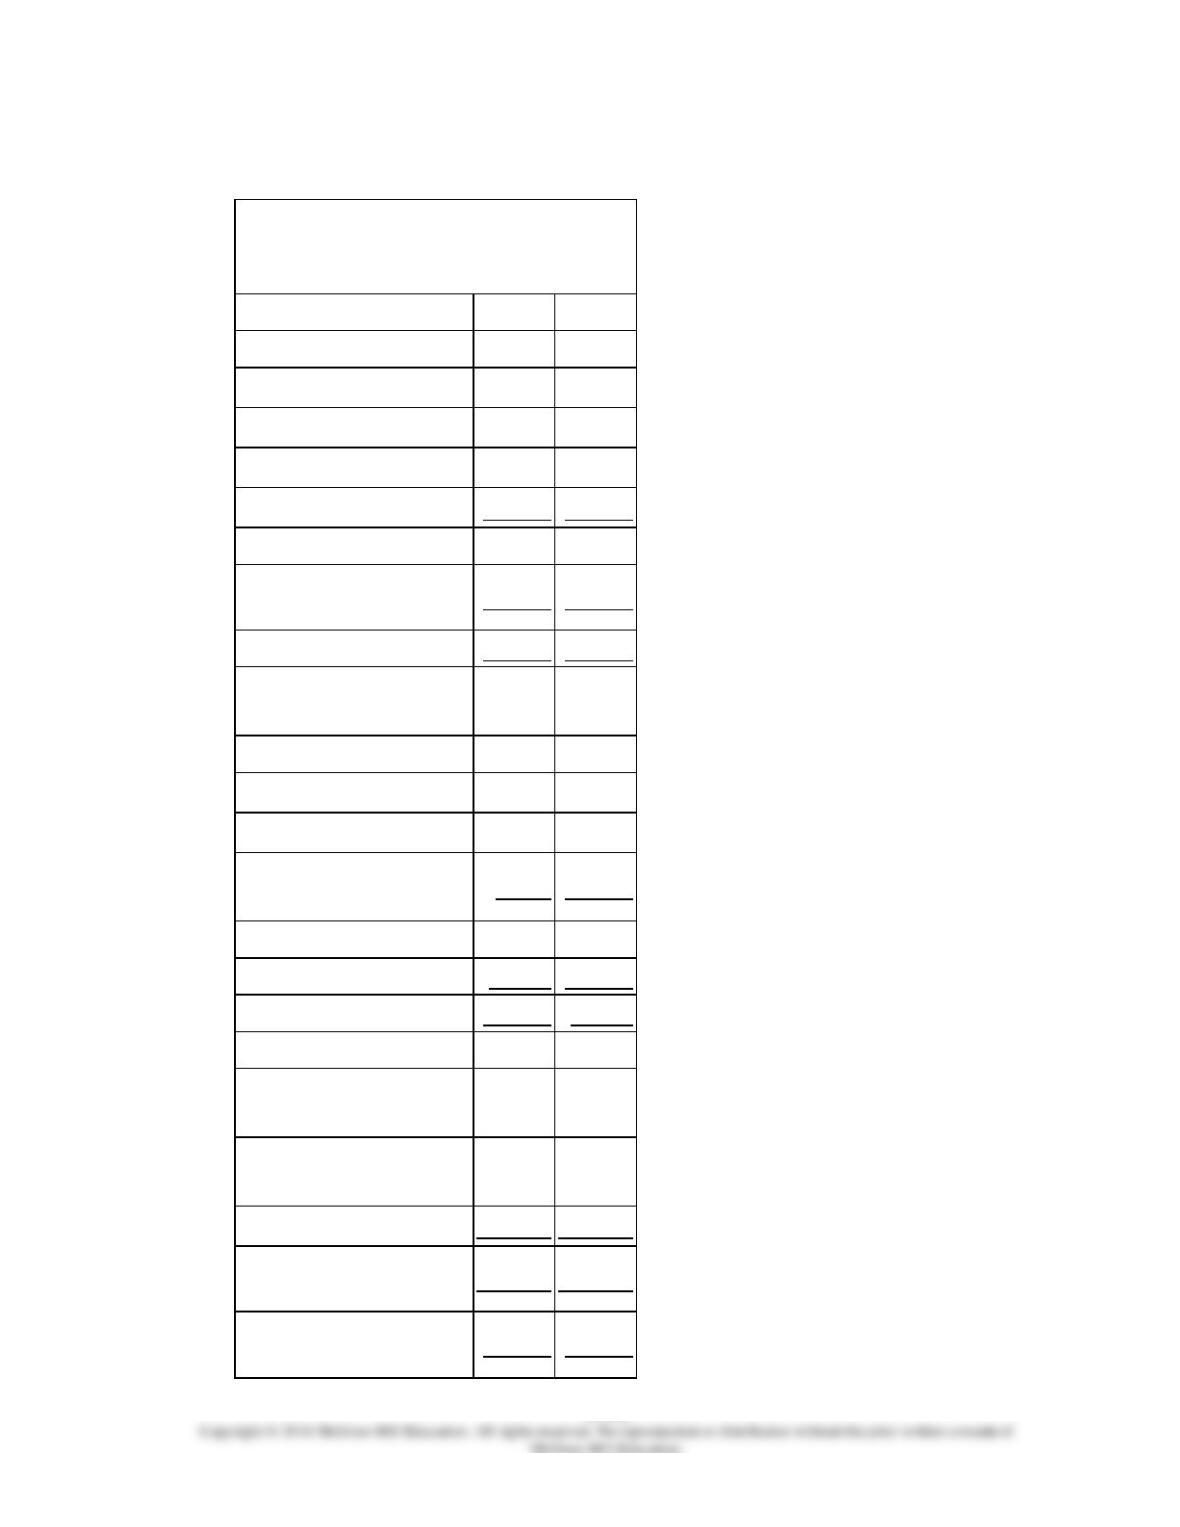
Freiman Corporation’s most recent balance sheet and income statement appear below:
Balance Sheet
December 31, Year 2 and Year 1
(in thousands of dollars)
Assets
Year 2
Year 1
Current assets:
Cash
$160
$120
Accounts receivable
220
240
Inventory
120
130
Prepaid expenses
40
40
Total current assets
540
530
Plant and equipment,
net
700
700
Total assets
$1,240
$1,230
Liabilities and
Stockholders’ Equity
Current liabilities:
Accounts payable
$130
$150
Accrued liabilities
90
90
Notes payable, short
term
60
70
Total current liabilities
280
310
Bonds payable
280
290
Total liabilities
560
600
Stockholders’ equity:
Common stock, $2
par value
100
100
Additional paid-in
capital-common stock
200
200
Retained earnings
380
330
Total stockholders’
equity
680
630
Total liabilities &
stockholders’ equity
$1,240
$1,230
Income Statement
For the Year Ended December 31,
Year 2
(in thousands of dollars)
Sales (all on account)
$1,310
Cost of goods sold
780
Gross margin
530
Selling and administrative
expense
359
Net operating income
171
Interest expense
35
Net income before taxes
136
Income taxes (30%)
41
Net income
$95
The working capital at the end of Year 2 is:

13–394
144.
Freiman Corporation’s most recent balance sheet and income statement appear below:
Balance Sheet
December 31, Year 2 and Year 1
(in thousands of dollars)
Assets
Year
2
Year
1
Current assets:
Cash
$160
$120
Accounts receivable
220
240
Inventory
120
130
Prepaid expenses
40
40
Total current assets
540
530
Plant and equipment,
net
700
700
Total assets
$1,240
$1,230
Liabilities and
Stockholders’ Equity
Current liabilities:
Accounts payable
$130
$150
Accrued liabilities
90
90
Notes payable, short
term
60
70
Total current liabilities
280
310
Bonds payable
280
290
Total liabilities
560
600
Stockholders’ equity:
Common stock, $2 par
value
100
100
Additional paid-in
capital-common stock
200
200
Retained earnings
380
330
Total stockholders’
equity
680
630
Total liabilities &
$1,240
$1,230
stockholders’ equity
Income Statement
For the Year Ended December 31,
Year 2
(in thousands of dollars)
Sales (all on account)
$1,310
Cost of goods sold
780
Gross margin
530
Selling and administrative
expense
359
Net operating income
171
Interest expense
35
Net income before taxes
136
Income taxes (30%)
41
Net income
$95
The current ratio at the end of Year 2 is closest to:
13–396
145.
Freiman Corporation’s most recent balance sheet and income statement appear below:
Balance Sheet
December 31, Year 2 and Year 1
(in thousands of dollars)
Assets
Year 2
Year 1
Current assets:
Cash
$160
$120
Accounts receivable
220
240
Inventory
120
130
Prepaid expenses
40
40
Total current assets
540
530
Plant and equipment,
net
700
700
Total assets
$1,240
$1,230
Liabilities and
Stockholders’ Equity
Current liabilities:
Accounts payable
$130
$150
Accrued liabilities
90
90
Notes payable, short
term
60
70
Total current liabilities
280
310
Bonds payable
280
290
Total liabilities
560
600
Stockholders’ equity:
Common stock, $2
par value
100
100
Additional paid-in
capital-common stock
200
200
Retained earnings
380
330
Total stockholders’
equity
680
630
Total liabilities &
stockholders’ equity
$1,240
$1,230
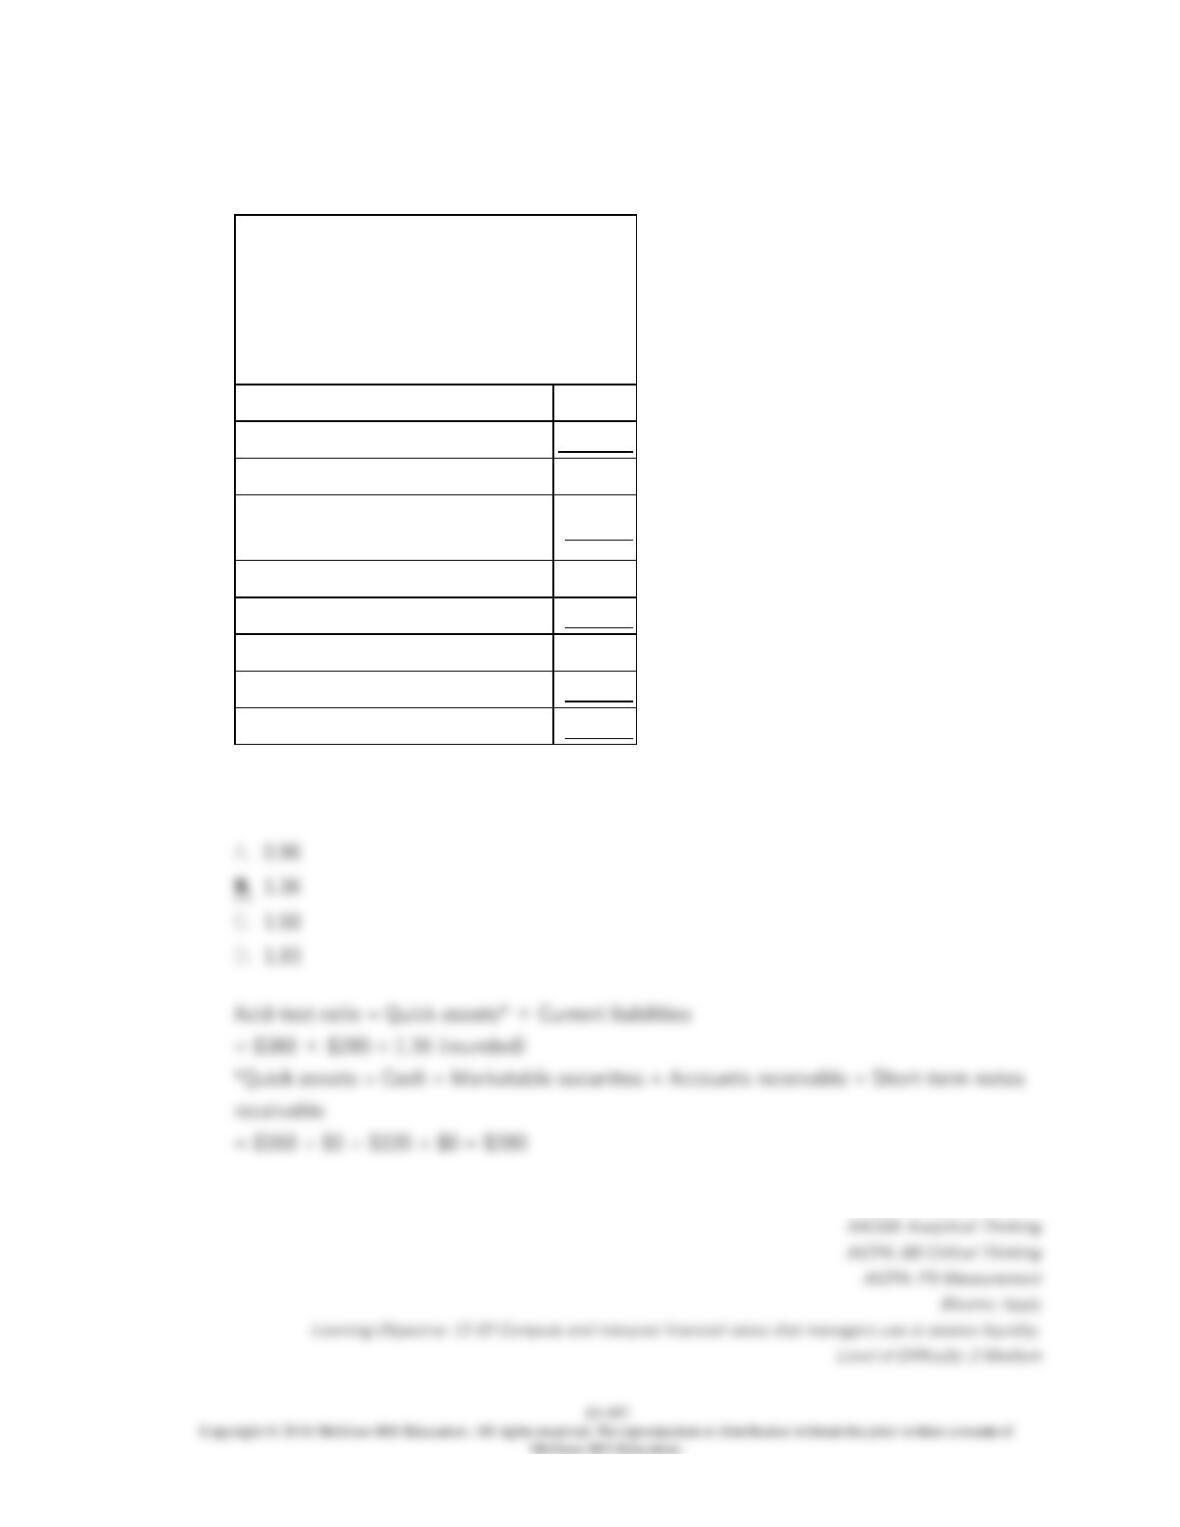
Income Statement
For the Year Ended December 31,
Year 2
(in thousands of dollars)
Sales (all on account)
$1,310
Cost of goods sold
780
Gross margin
530
Selling and administrative
expense
359
Net operating income
171
Interest expense
35
Net income before taxes
136
Income taxes (30%)
41
Net income
$95
The acid-test ratio at the end of Year 2 is closest to:

13–398
13–399
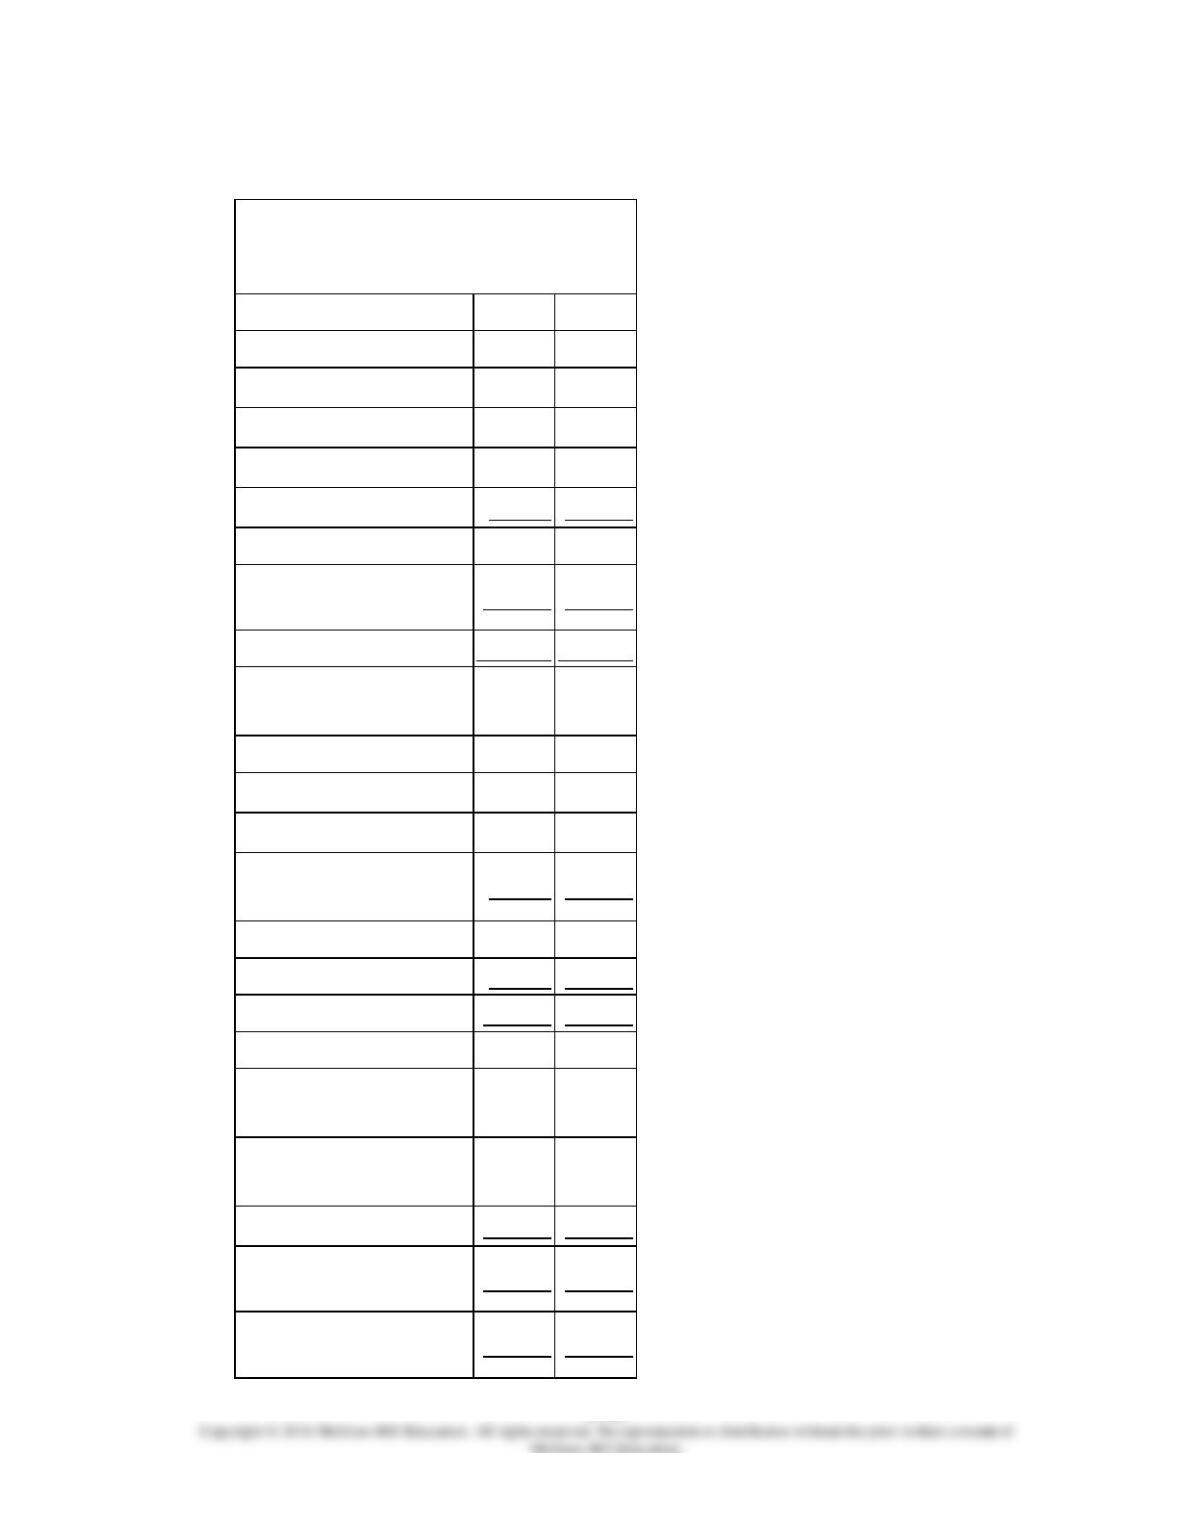
146.
Freiman Corporation’s most recent balance sheet and income statement appear below:
Balance Sheet
December 31, Year 2 and Year 1
(in thousands of dollars)
Assets
Year 2
Year 1
Current assets:
Cash
$160
$120
Accounts receivable
220
240
Inventory
120
130
Prepaid expenses
40
40
Total current assets
540
530
Plant and equipment,
net
700
700
Total assets
$1,240
$1,230
Liabilities and
Stockholders’ Equity
Current liabilities:
Accounts payable
$130
$150
Accrued liabilities
90
90
Notes payable, short
term
60
70
Total current liabilities
280
310
Bonds payable
280
290
Total liabilities
560
600
Stockholders’ equity:
Common stock, $2
par value
100
100
Additional paid-in
capital-common stock
200
200
Retained earnings
380
330
Total stockholders’
equity
680
630
Total liabilities &
stockholders’ equity
$1,240
$1,230
Income Statement
For the Year Ended December 31,
Year 2
(in thousands of dollars)
Sales (all on account)
$1,310
Cost of goods sold
780
Gross margin
530
Selling and administrative
expense
359
Net operating income
171
Interest expense
35
Net income before taxes
136
Income taxes (30%)
41
Net income
$95
The accounts receivable turnover for Year 2 is closest to:
13–401
147.
Freiman Corporation’s most recent balance sheet and income statement appear below:
Balance Sheet
December 31, Year 2 and Year 1
(in thousands of dollars)
Assets
Year 2
Year 1
Current assets:
Cash
$160
$120
Accounts receivable
220
240
Inventory
120
130
Prepaid expenses
40
40
Total current assets
540
530
Plant and equipment,
net
700
700
Total assets
$1,240
$1,230
Liabilities and
Stockholders’ Equity
Current liabilities:
Accounts payable
$130
$150
Accrued liabilities
90
90
Notes payable, short
term
60
70
Total current liabilities
280
310
Bonds payable
280
290
Total liabilities
560
600
Stockholders’ equity:
Common stock, $2
par value
100
100
Additional paid-in
capital-common stock
200
200
Retained earnings
380
330
Total stockholders’
equity
680
630
Total liabilities &
stockholders’ equity
$1,240
$1,230
Income Statement
For the Year Ended December 31,
Year 2
(in thousands of dollars)
Sales (all on account)
$1,310
Cost of goods sold
780
Gross margin
530
Selling and administrative
expense
359
Net operating income
171
Interest expense
35
Net income before taxes
136
Income taxes (30%)
41
Net income
$95
The average collection period for Year 2 is closest to:
13–403
13–404
148.
Freiman Corporation’s most recent balance sheet and income statement appear below:
Balance Sheet
December 31, Year 2 and Year 1
(in thousands of dollars)
Assets
Year
2
Year
1
Current assets:
Cash
$160
$120
Accounts receivable
220
240
Inventory
120
130
Prepaid expenses
40
40
Total current assets
540
530
Plant and equipment,
net
700
700
Total assets
$1,240
$1,230
Liabilities and
Stockholders’ Equity
Current liabilities:
Accounts payable
$130
$150
Accrued liabilities
90
90
Notes payable, short
term
60
70
Total current liabilities
280
310
Bonds payable
280
290
Total liabilities
560
600
Stockholders’ equity:
Common stock, $2 par
value
100
100
Additional paid-in
capital-common stock
200
200
Retained earnings
380
330
Total stockholders’
equity
680
630
Total liabilities &
$1,240
$1,230