13–365
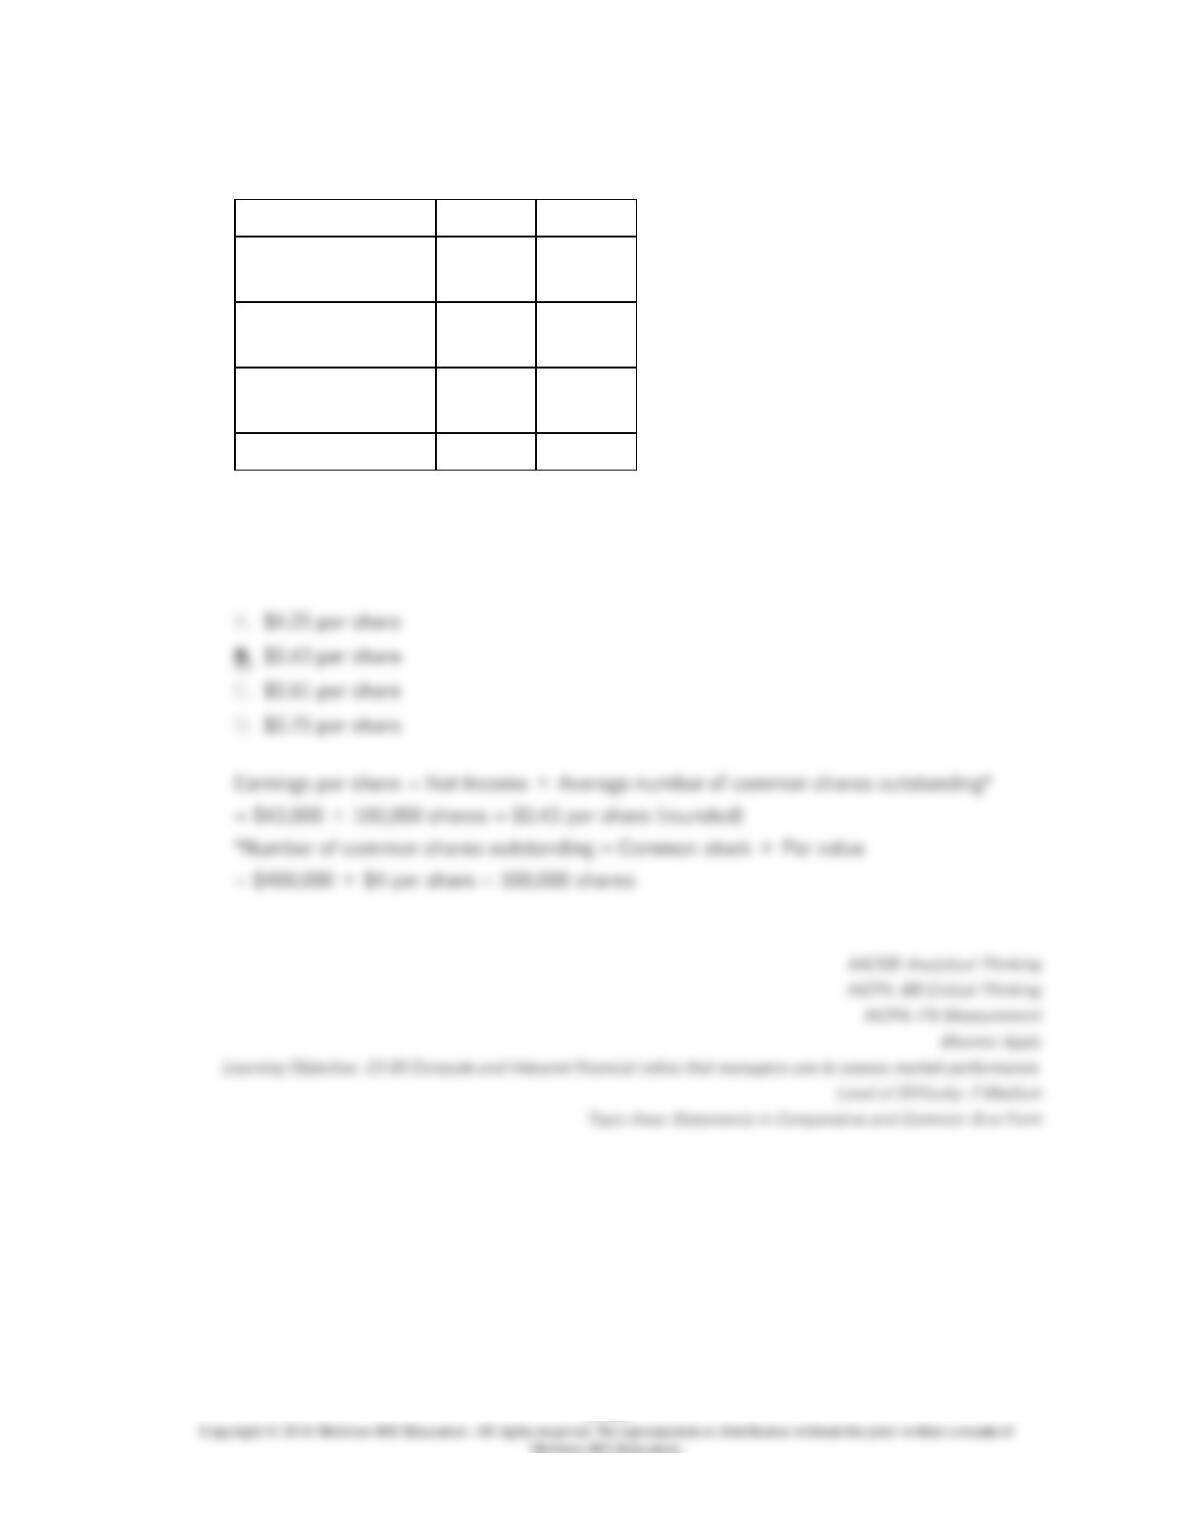
122.
Hernande Corporation has provided the following data:
Year 2
Year 1
Common stock, $4
par value
$400,000
$400,000
Net operating
income
$75,429
Net income before
taxes
$61,429
Net income
$43,000
The company’s earnings per share for Year 2 is closest to:
13–366
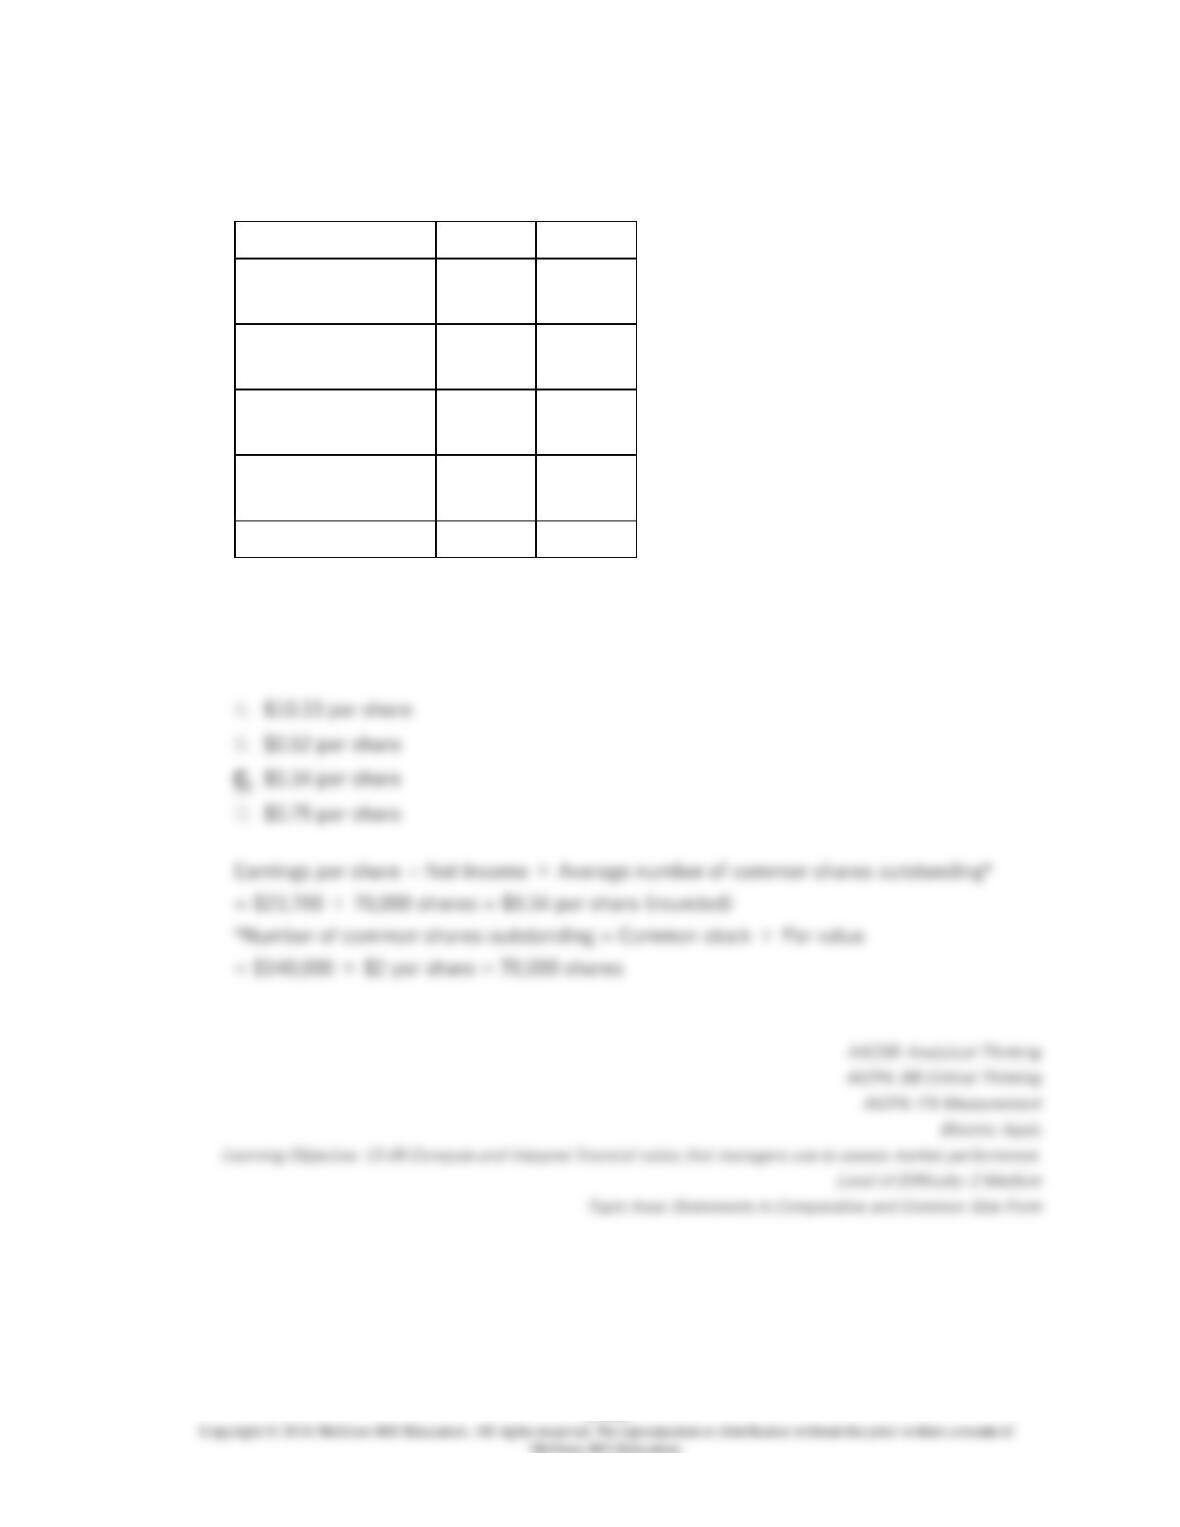
123.
Delfavero Corporation has provided the following data:
Year 2
Year 1
Common stock, $2
par value
$140,000
$140,000
Total stockholders’
equity
$953,000
930,000
Net operating
income
$55,462
Net income before
taxes
$36,462
Net income
$23,700
The company’s earnings per share for Year 2 is closest to:
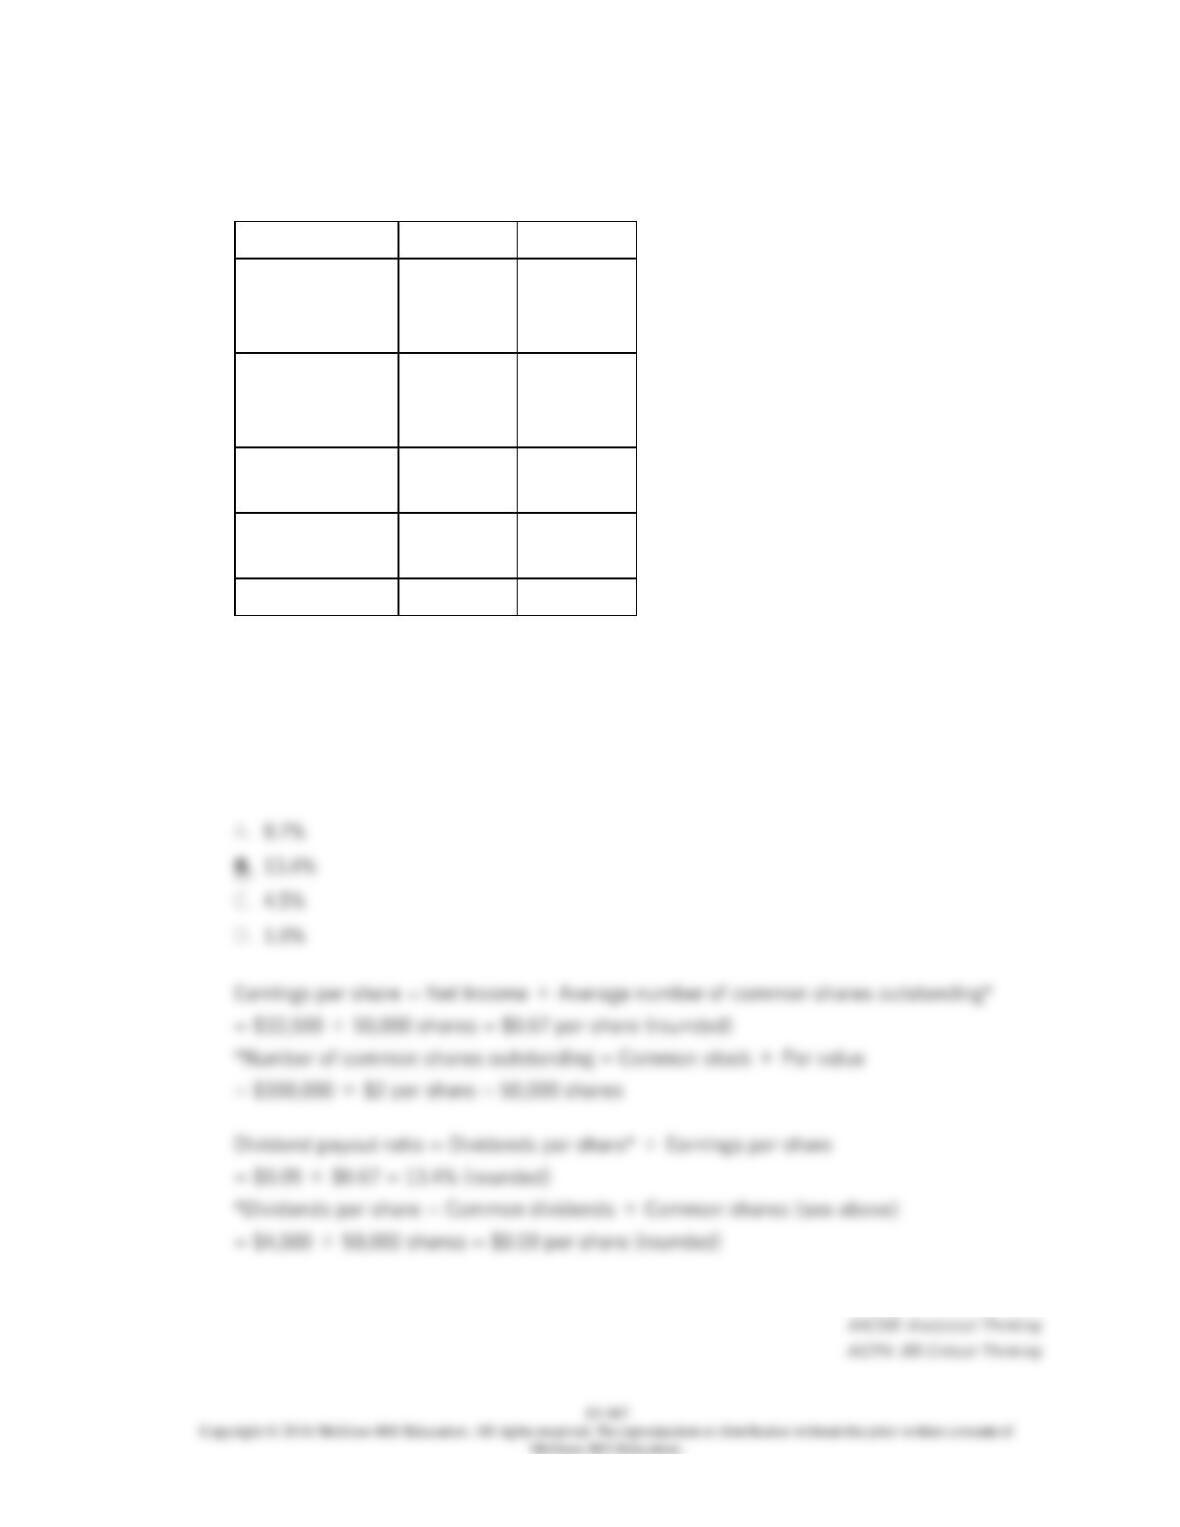
124.
Groeneweg Corporation has provided the following data:
Year 2
Year 1
Common
stock, $2 par
value
$100,000
$100,000
Total
stockholders’
equity
$1,129,000
$1,100,000
Net operating
income
$61,538
Net income
before taxes
$51,538
Net income
$33,500
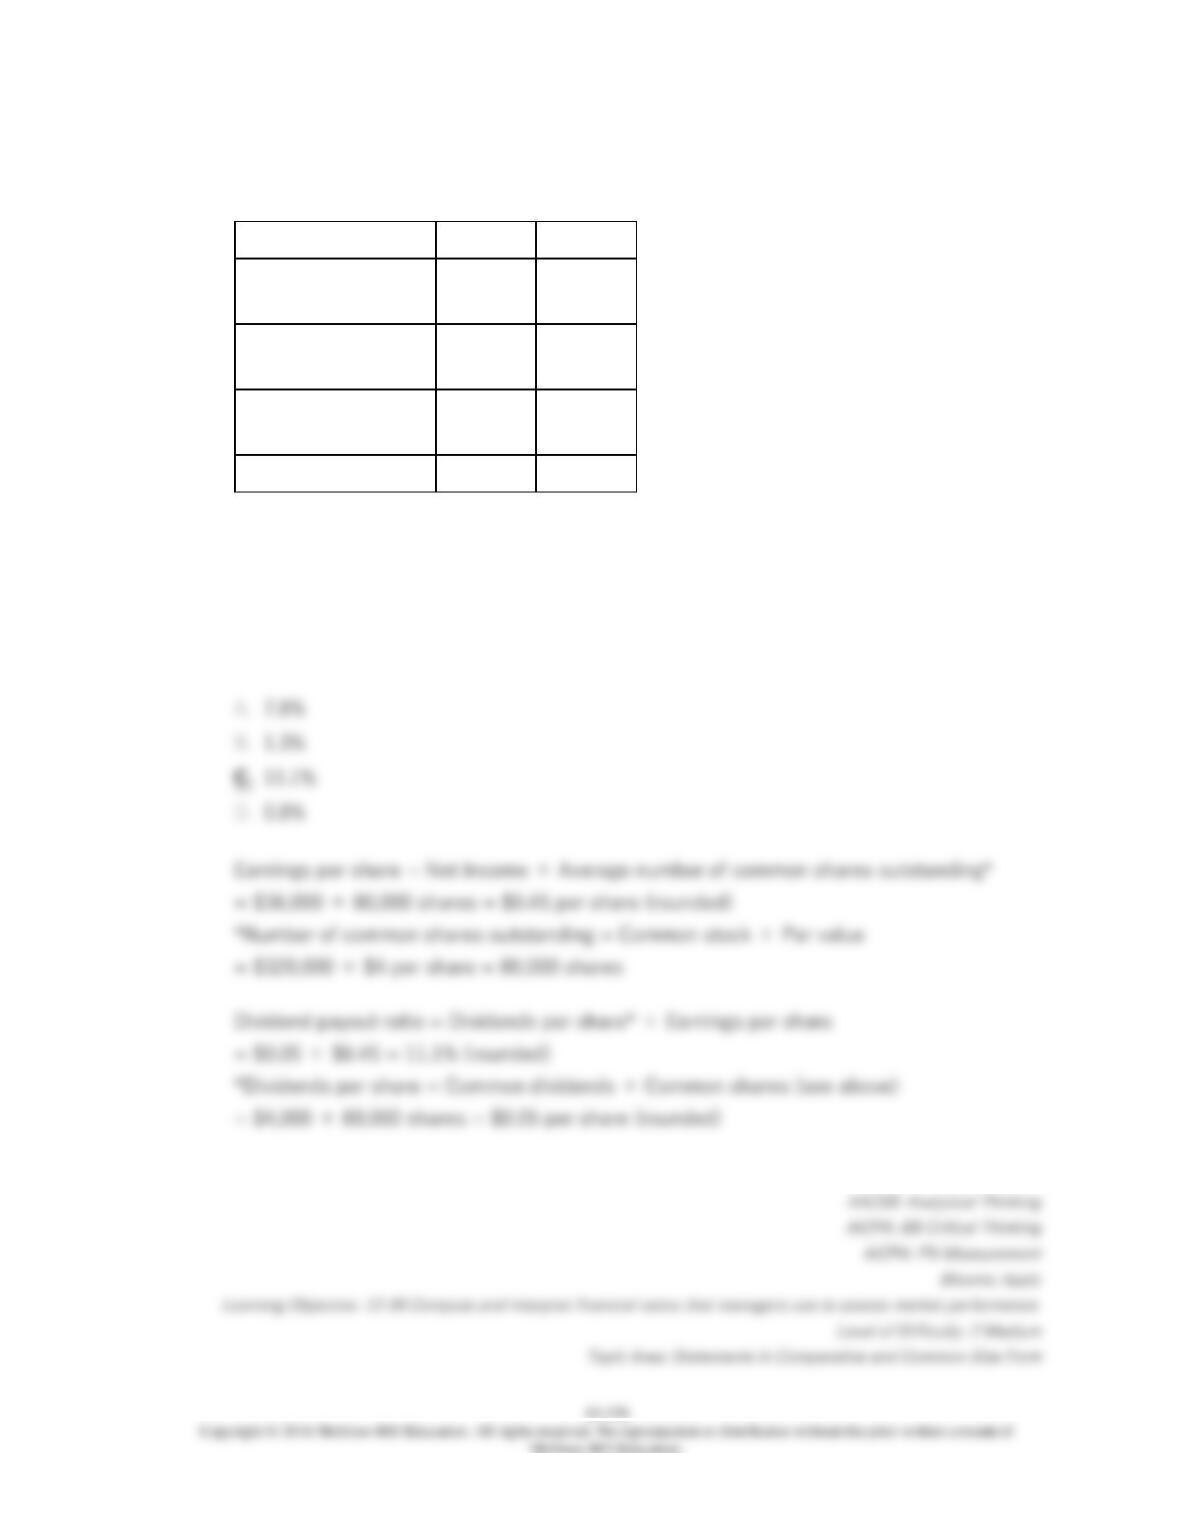
Dividends on common stock during Year 2 totaled $4,500. The market price of common
stock at the end of Year 2 was $9.45 per share. The company’s dividend payout ratio for
Year 2 is closest to:
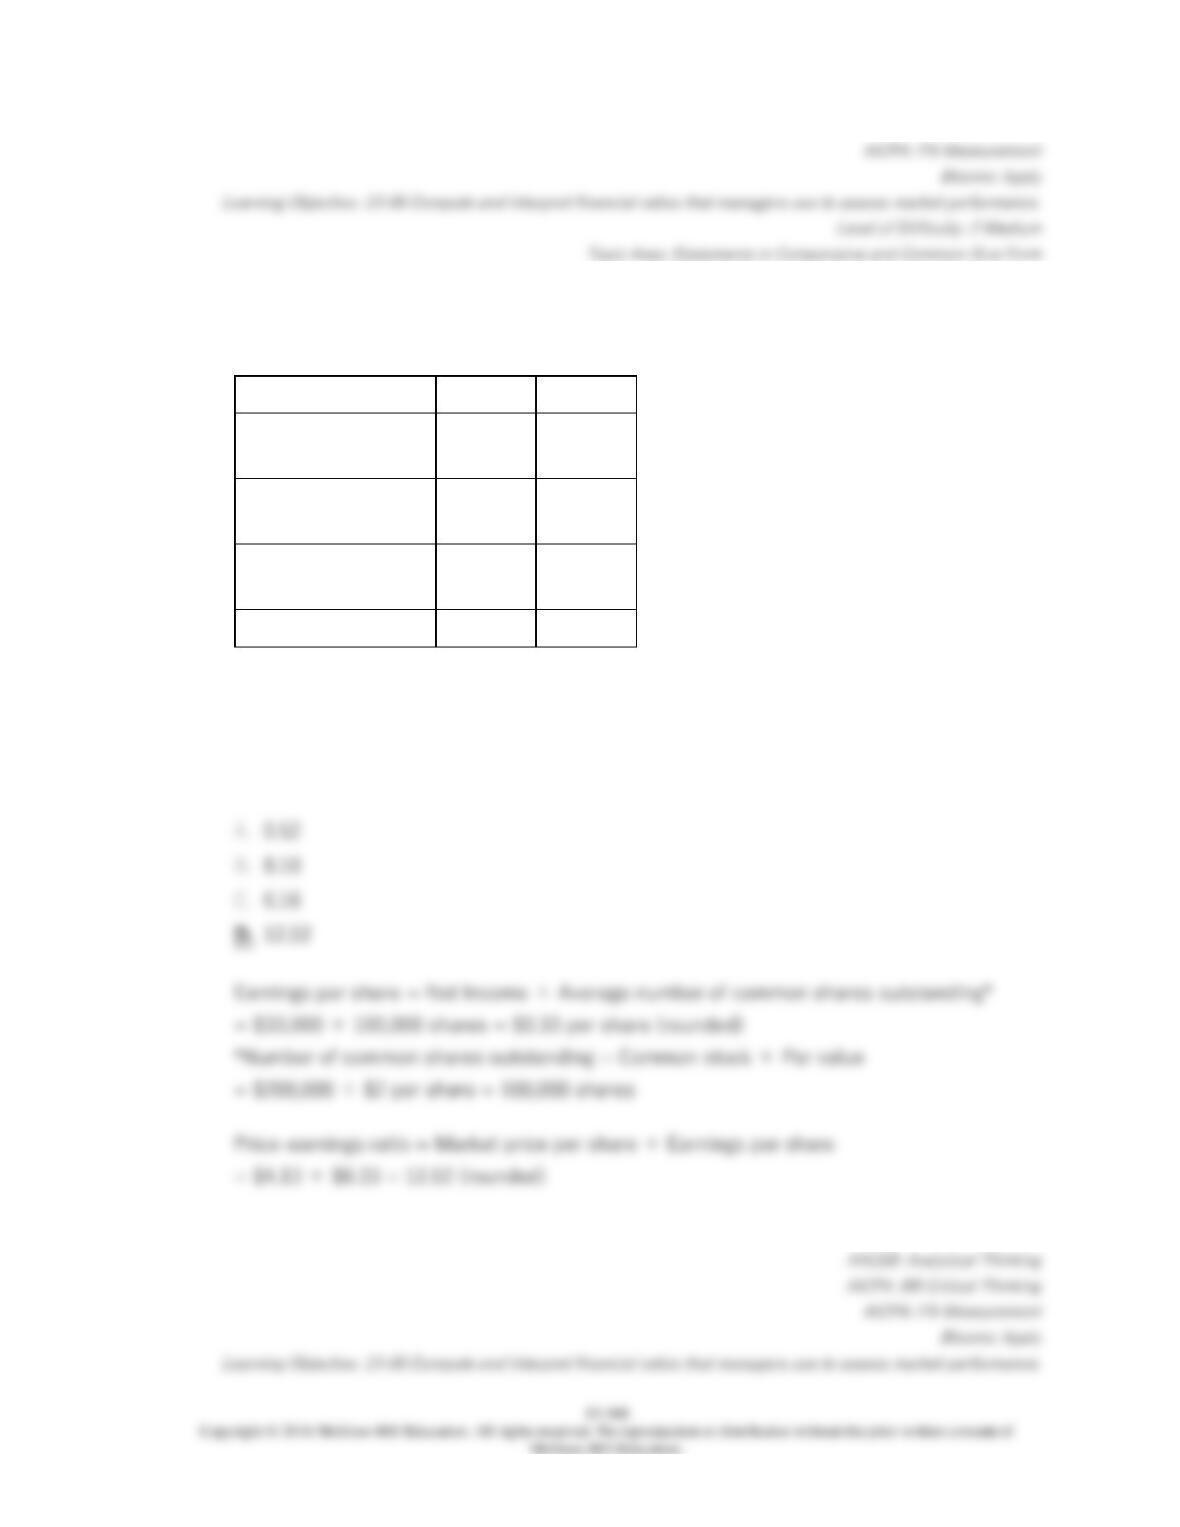
125.
Spincic Corporation has provided the following data:
Year 2
Year 1
Common stock, $2
par value
$200,000
$200,000
Net operating
income
$66,769
Net income before
taxes
$50,769
Net income
$33,000
The market price of common stock at the end of Year 2 was $4.13 per share. The
company’s price-earnings ratio for Year 2 is closest to:
13–369
126.
Kovack Corporation’s net operating income in Year 2 was $66,571, net income before
taxes was $46,571, and the net income was $32,600. Total common stock was $120,000 at
the end of both Year 2 and Year 1. The par value of common stock is $2 per share. The
company’s total stockholders’ equity at the end of Year 2 amounted to $962,000 and at the
end of Year 1 to $930,000. The company declared and paid $600 dividends on common
stock. The market price per share was $4.37. The company’s dividend yield ratio for Year 2
is closest to:
127.
Uhri Corporation has provided the following data:
Year 2
Year 1
Common stock, $4
par value
$320,000
$320,000
Net operating
income
$71,429
Net income before
taxes
$51,429
Net income
$36,000
Dividends on common stock during Year 2 totaled $4,000. The market price of common
stock at the end of Year 2 was $6.08 per share. The company’s dividend payout ratio for
Year 2 is closest to:
128.
Sabino Corporation’s total common stock was $500,000 at the end of both Year 2 and Year
1. The par value of common stock is $5 per share. The company’s total stockholders’
equity at the end of Year 2 amounted to $1,125,000 and at the end of Year 1 to $1,090,000.
The company’s total liabilities and stockholders’ equity at the end of Year 2 amounted to
$1,581,000 and at the end of Year 1 to $1,540,000. The company’s retained earnings at the
end of Year 2 amounted to $545,000 and at the end of Year 1 to $510,000. The company’s
net income in Year 2 was $39,000. The company’s book value per share at the end of Year
2 is closest to:
129.
Nickolls Corporation has provided the following financial data:
Cash
$188,000
Accounts receivable
$285,000
Total current assets
$709,000
Total current liabilities
$167,000
The company’s working capital is:
130.
Nickolls Corporation has provided the following financial data:
Cash
$188,000
Accounts receivable
$285,000
Total current assets
$709,000
Total current liabilities
$167,000
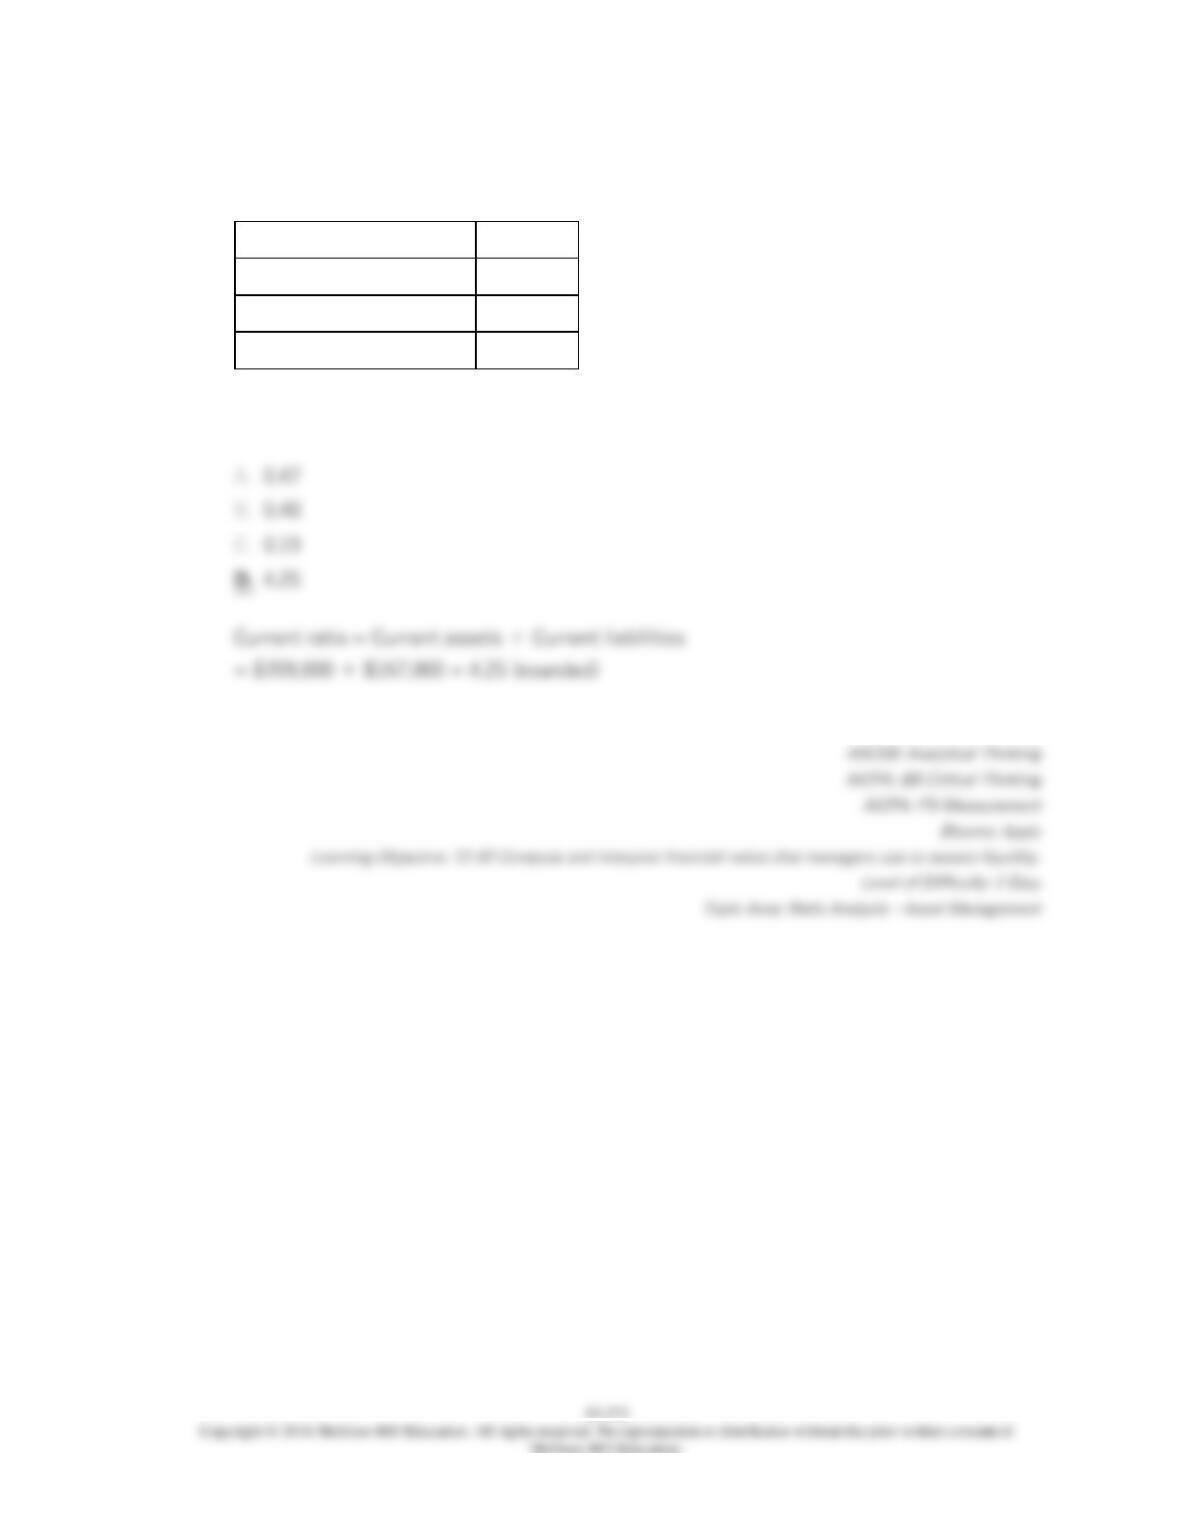
The company’s current ratio is closest to:
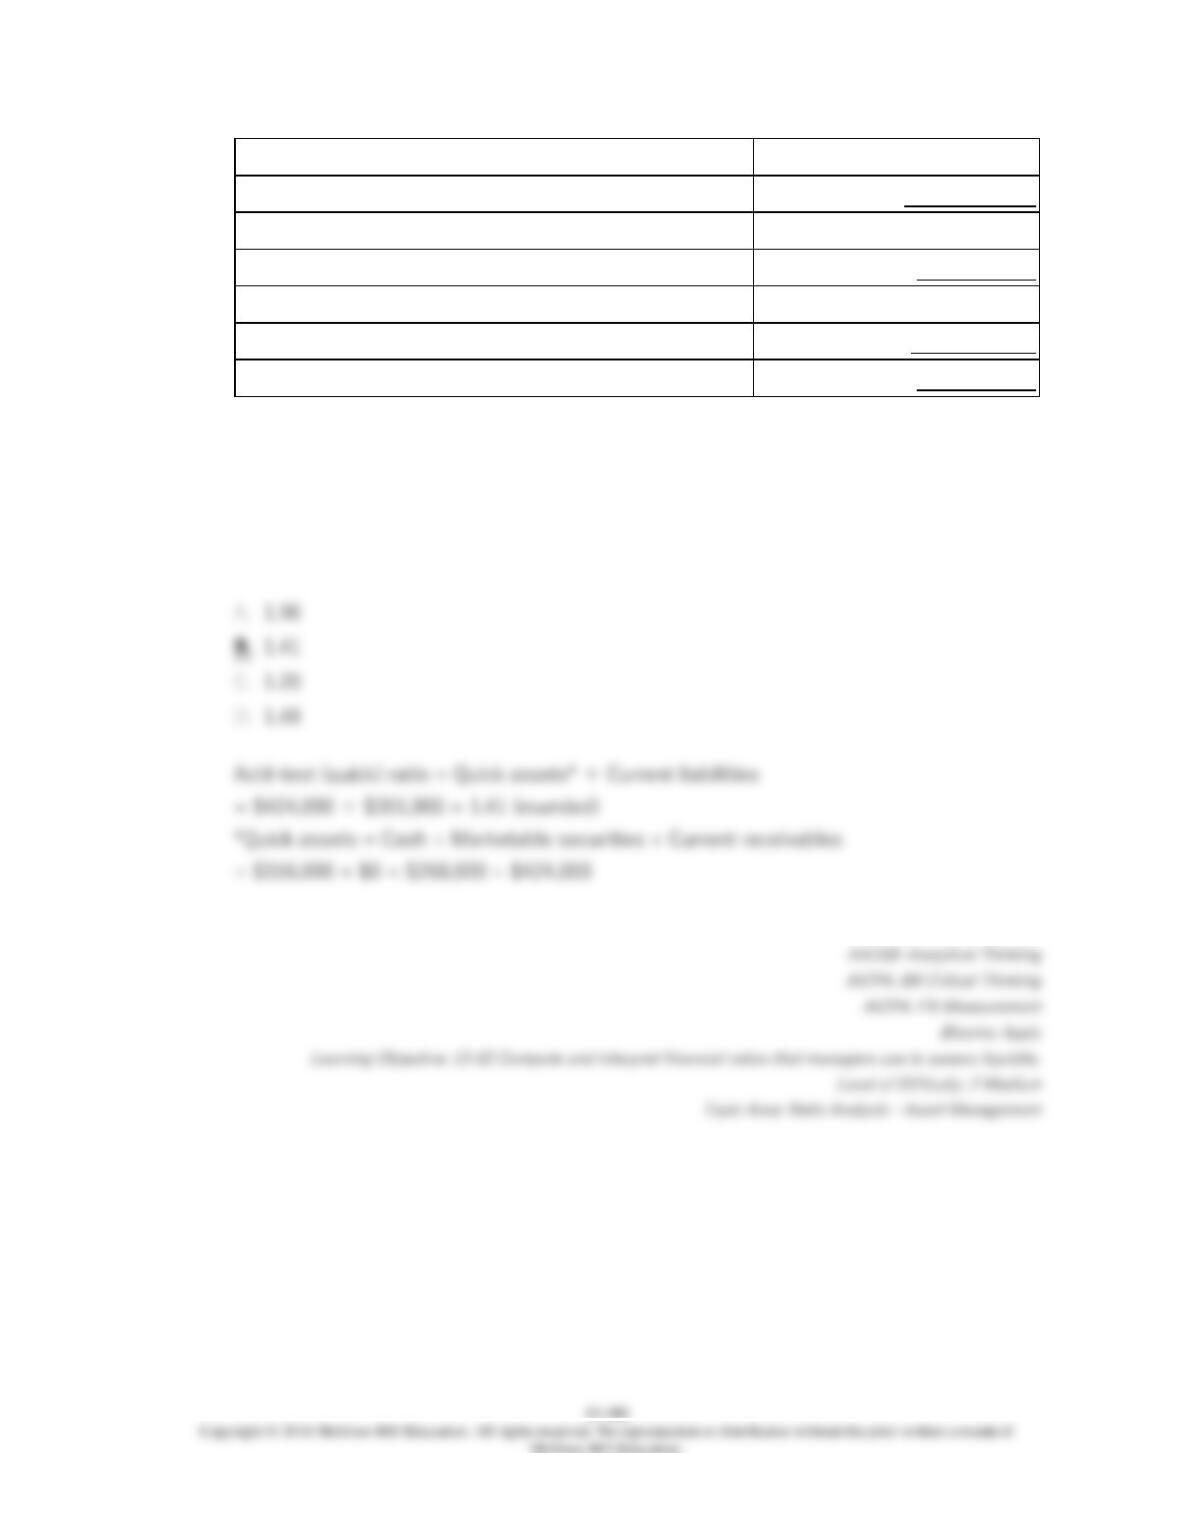
131.
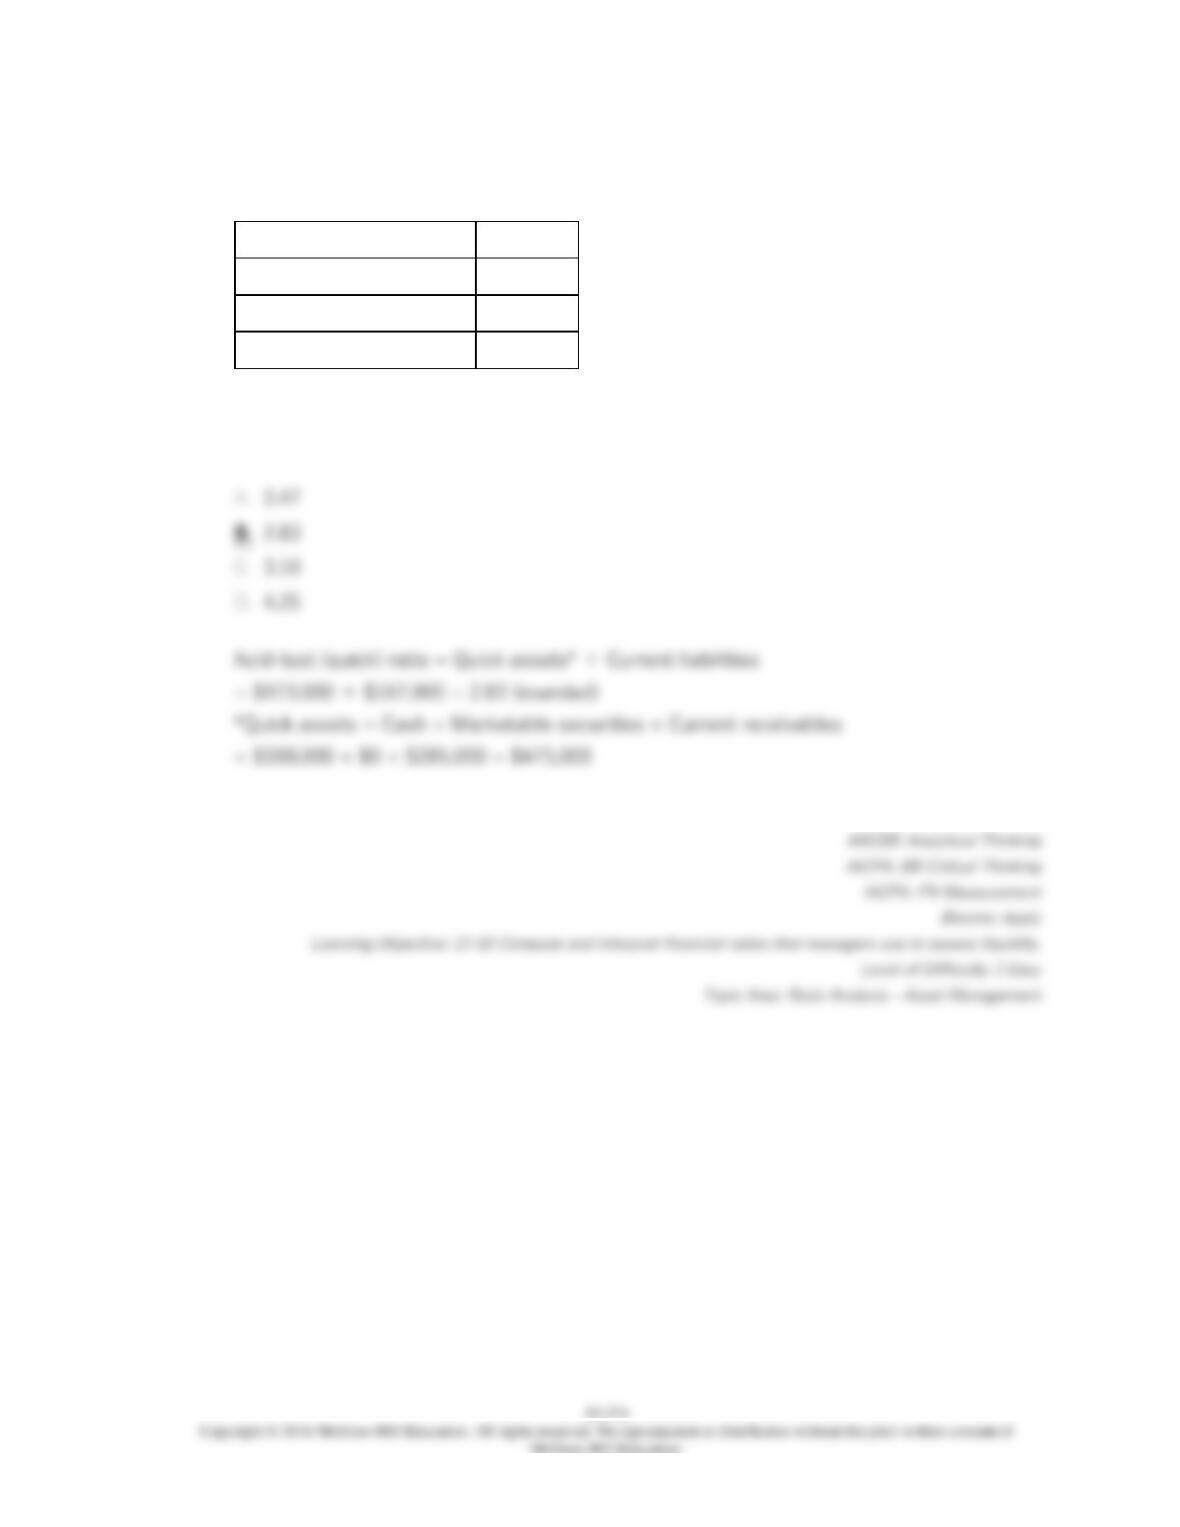
Nickolls Corporation has provided the following financial data:
Cash
$188,000
Accounts receivable
$285,000
Total current assets
$709,000
Total current liabilities
$167,000
The company’s acid-test (quick) ratio is closest to:

13–375
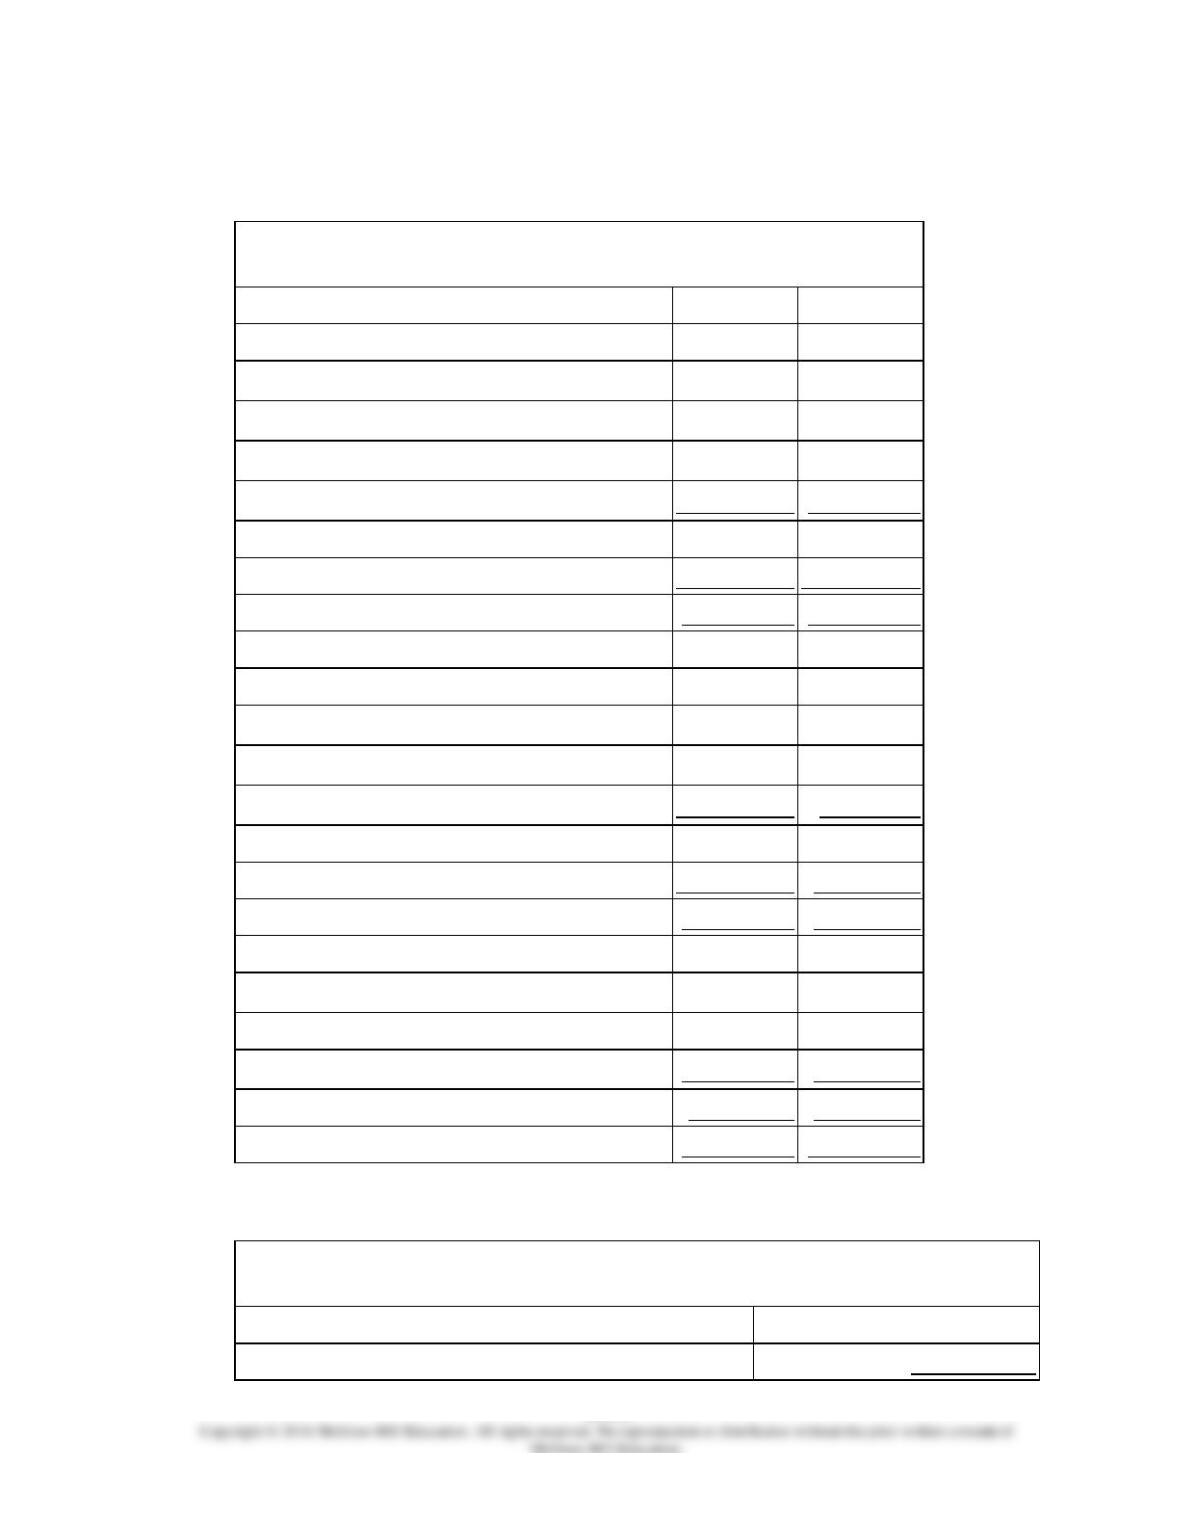
132.
Macmillan Corporation has provided the following financial data:
Balance Sheet
December 31, Year 2 and Year 1
Assets
Year 2
Year 1
Current assets:
Cash
$156,000
$120,000
Accounts receivable
268,000
280,000
Inventory
146,000
130,000
Prepaid expenses
20,000
20,000
Total current assets
590,000
550,000
Plant and equipment, net
732,000
760,000
Total assets
$1,322,000
$1,310,000
Liabilities and Stockholders’ Equity
Current liabilities:
Accounts payable
$175,000
$180,000
Accrued liabilities
46,000
50,000
Notes payable, short term
80,000
80,000
Total current liabilities
301,000
310,000
Bonds payable
190,000
190,000
Total liabilities
491,000
500,000
Stockholders’ equity:
Common stock, $5 par value
450,000
450,000
Additional paid-in capital-common stock
70,000
70,000
Retained earnings
311,000
290,000
Total stockholders’ equity
831,000
810,000
Total liabilities & stockholders’ equity
$1,322,000
$1,310,000
Income Statement—Year 2
For the Year Ended December 31, Year 2
Sales (all on account)
$1,390,000
Cost of goods sold
830,000
Gross margin
560,000
Operating expenses
500,615
Net operating income
59,385
Interest expense
16,000
Net income before taxes
43,385
Income taxes (35%)
15,185
Net income
$28,200
Dividends on common stock during Year 2 totaled $7,200. The market price of common
stock at the end of Year 2 was $3.69 per share.
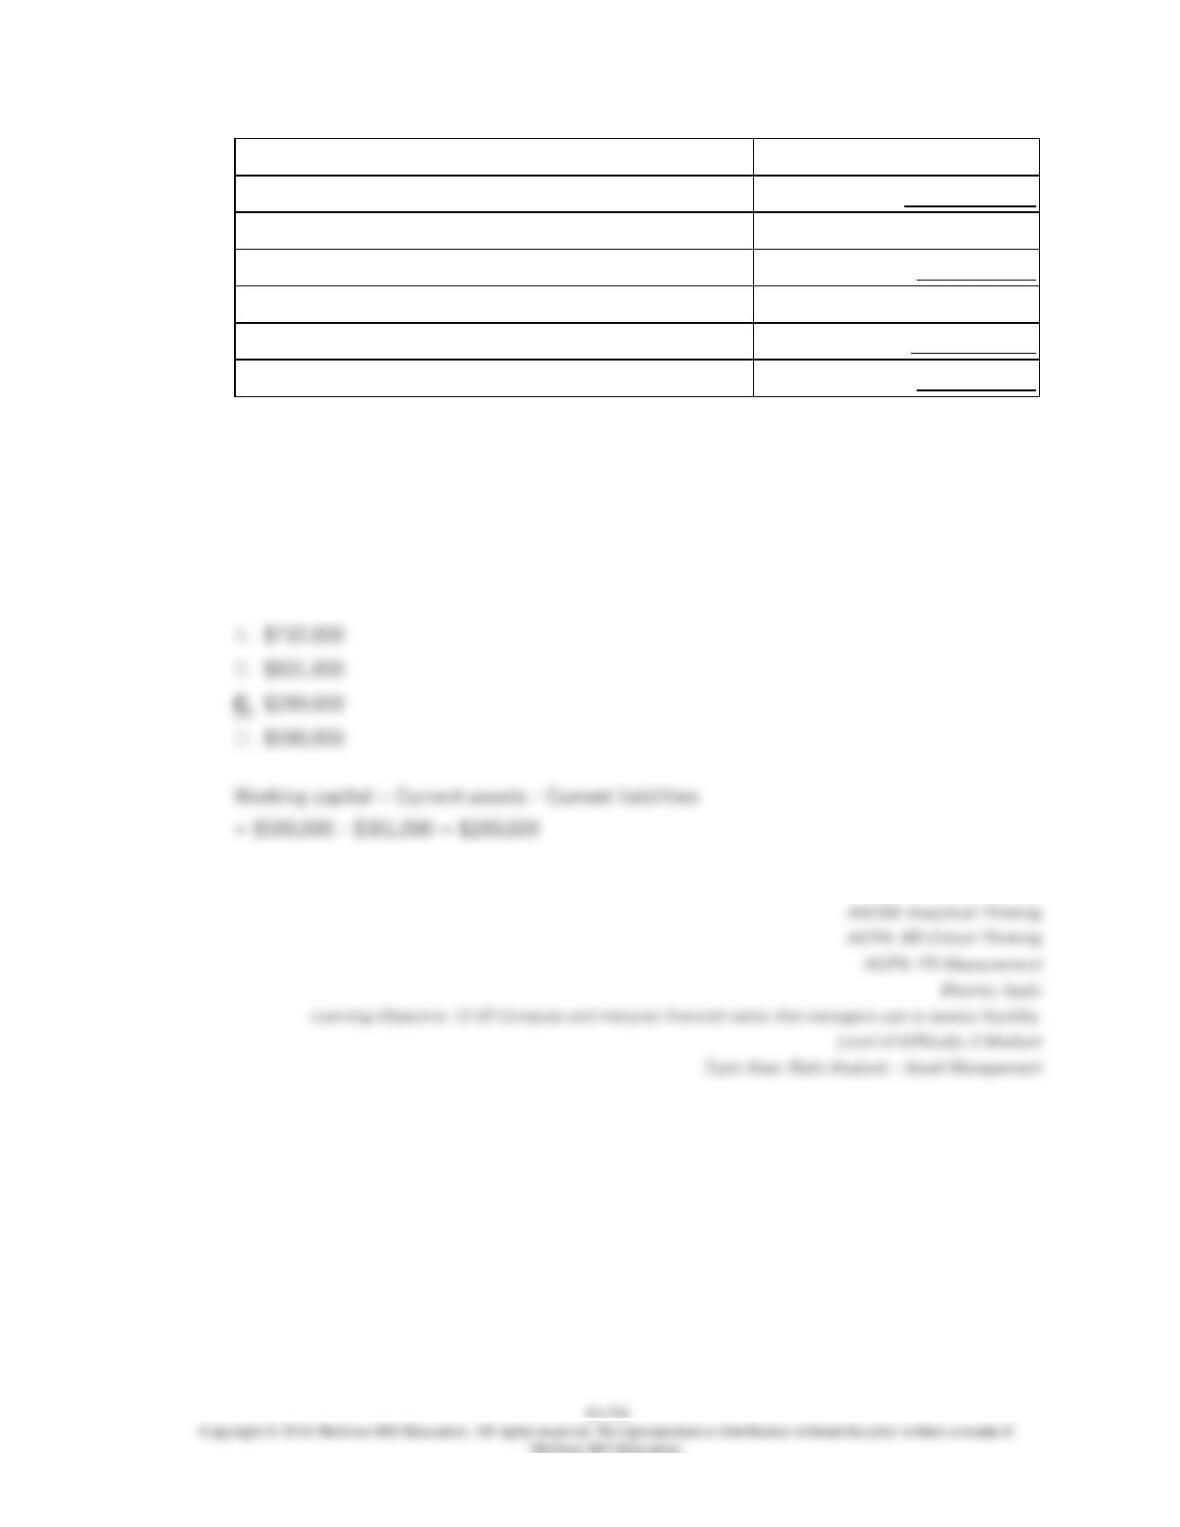
The company’s working capital at the end of Year 2 is:

13–377
133.
Macmillan Corporation has provided the following financial data:
Balance Sheet
December 31, Year 2 and Year 1
Assets
Year 2
Year 1
Current assets:
Cash
$156,000
$120,000
Accounts receivable
268,000
280,000
Inventory
146,000
130,000
Prepaid expenses
20,000
20,000
Total current assets
590,000
550,000
Plant and equipment, net
732,000
760,000
Total assets
$1,322,000
$1,310,000
Liabilities and Stockholders’ Equity
Current liabilities:
Accounts payable
$175,000
$180,000
Accrued liabilities
46,000
50,000
Notes payable, short term
80,000
80,000
Total current liabilities
301,000
310,000
Bonds payable
190,000
190,000
Total liabilities
491,000
500,000
Stockholders’ equity:
Common stock, $5 par value
450,000
450,000
Additional paid-in capital-common stock
70,000
70,000
Retained earnings
311,000
290,000
Total stockholders’ equity
831,000
810,000
Total liabilities & stockholders’ equity
$1,322,000
$1,310,000
Income Statement—Year 2
For the Year Ended December 31, Year 2
Sales (all on account)
$1,390,000
Cost of goods sold
830,000
Gross margin
560,000
Operating expenses
500,615
Net operating income
59,385
Interest expense
16,000
Net income before taxes
43,385
Income taxes (35%)
15,185
Net income
$28,200
Dividends on common stock during Year 2 totaled $7,200. The market price of common
stock at the end of Year 2 was $3.69 per share.
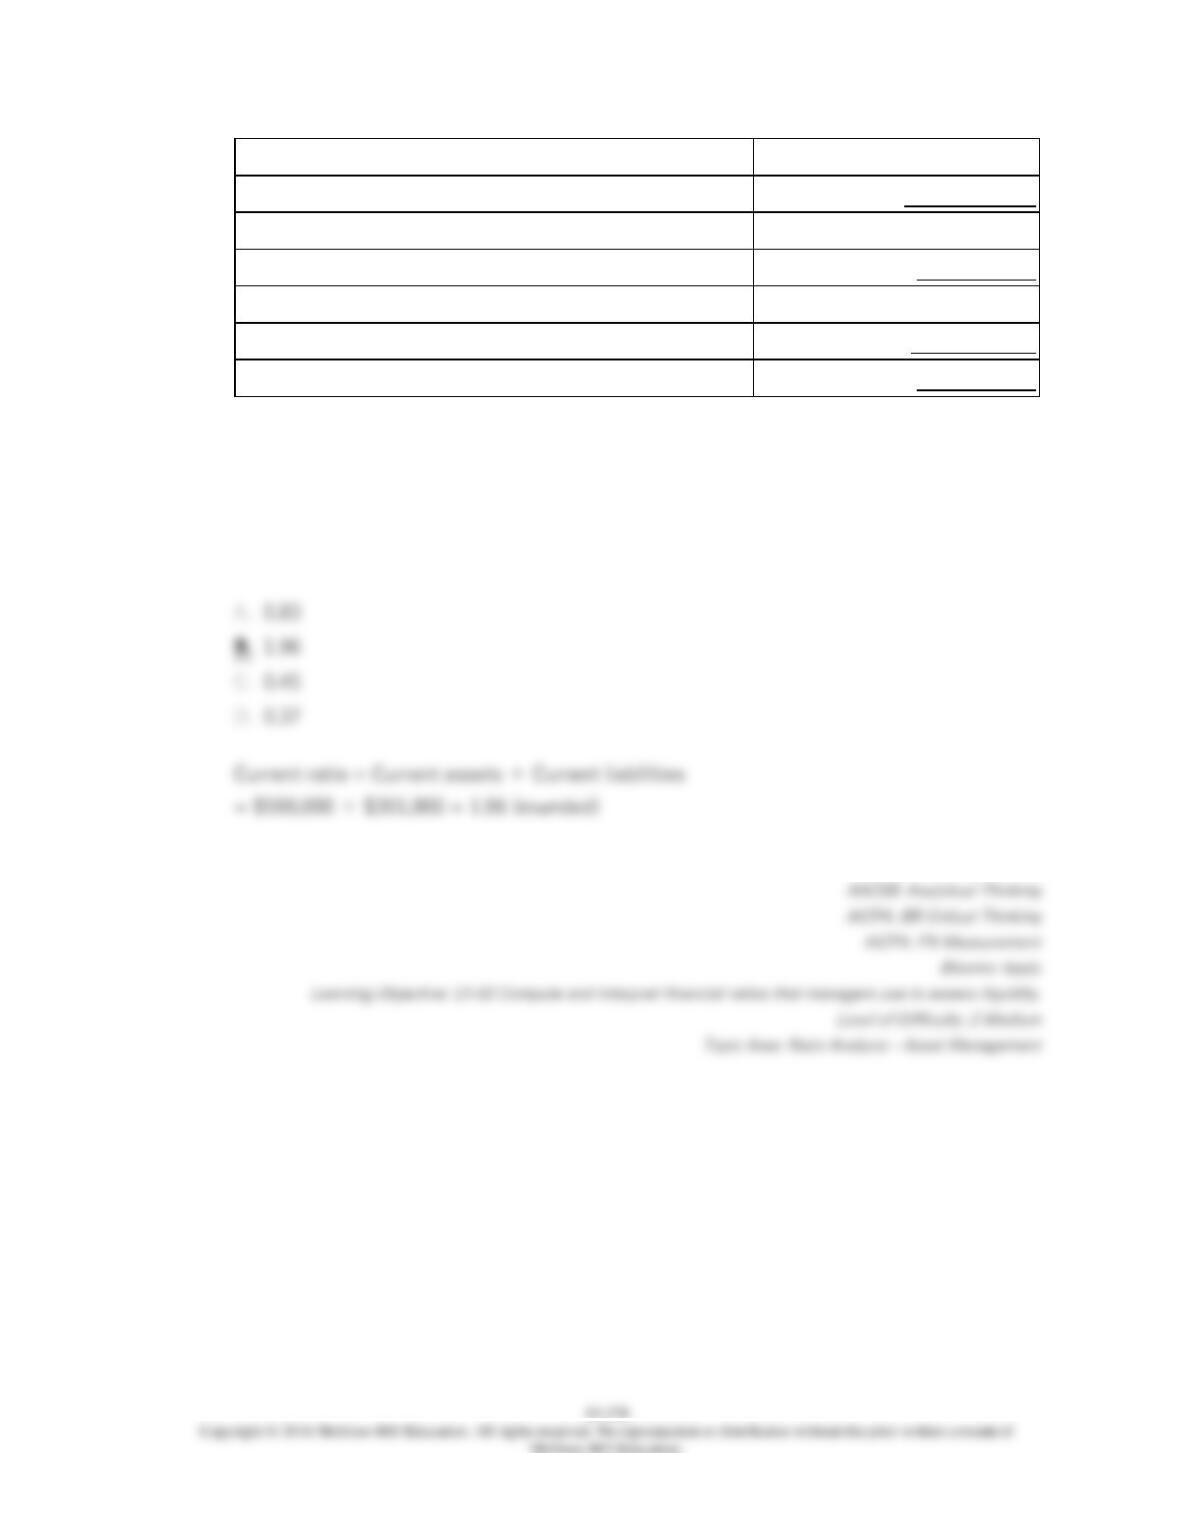
The company’s current ratio at the end of Year 2 is closest to:
13–379
134.
Macmillan Corporation has provided the following financial data:
Balance Sheet
December 31, Year 2 and Year 1
Assets
Year 2
Year 1
Current assets:
Cash
$156,000
$120,000
Accounts receivable
268,000
280,000
Inventory
146,000
130,000
Prepaid expenses
20,000
20,000
Total current assets
590,000
550,000
Plant and equipment, net
732,000
760,000
Total assets
$1,322,000
$1,310,000
Liabilities and Stockholders’ Equity
Current liabilities:
Accounts payable
$175,000
$180,000
Accrued liabilities
46,000
50,000
Notes payable, short term
80,000
80,000
Total current liabilities
301,000
310,000
Bonds payable
190,000
190,000
Total liabilities
491,000
500,000
Stockholders’ equity:
Common stock, $5 par value
450,000
450,000
Additional paid-in capital-common stock
70,000
70,000
Retained earnings
311,000
290,000
Total stockholders’ equity
831,000
810,000
Total liabilities & stockholders’ equity
$1,322,000
$1,310,000
Income Statement—Year 2
For the Year Ended December 31, Year 2
Sales (all on account)
$1,390,000
Cost of goods sold
830,000
Gross margin
560,000
Operating expenses
500,615
Net operating income
59,385
Interest expense
16,000
Net income before taxes
43,385
Income taxes (35%)
15,185
Net income
$28,200
Dividends on common stock during Year 2 totaled $7,200. The market price of common
stock at the end of Year 2 was $3.69 per share.
The company’s acid-test (quick) ratio at the end of Year 2 is closest to:
13–381
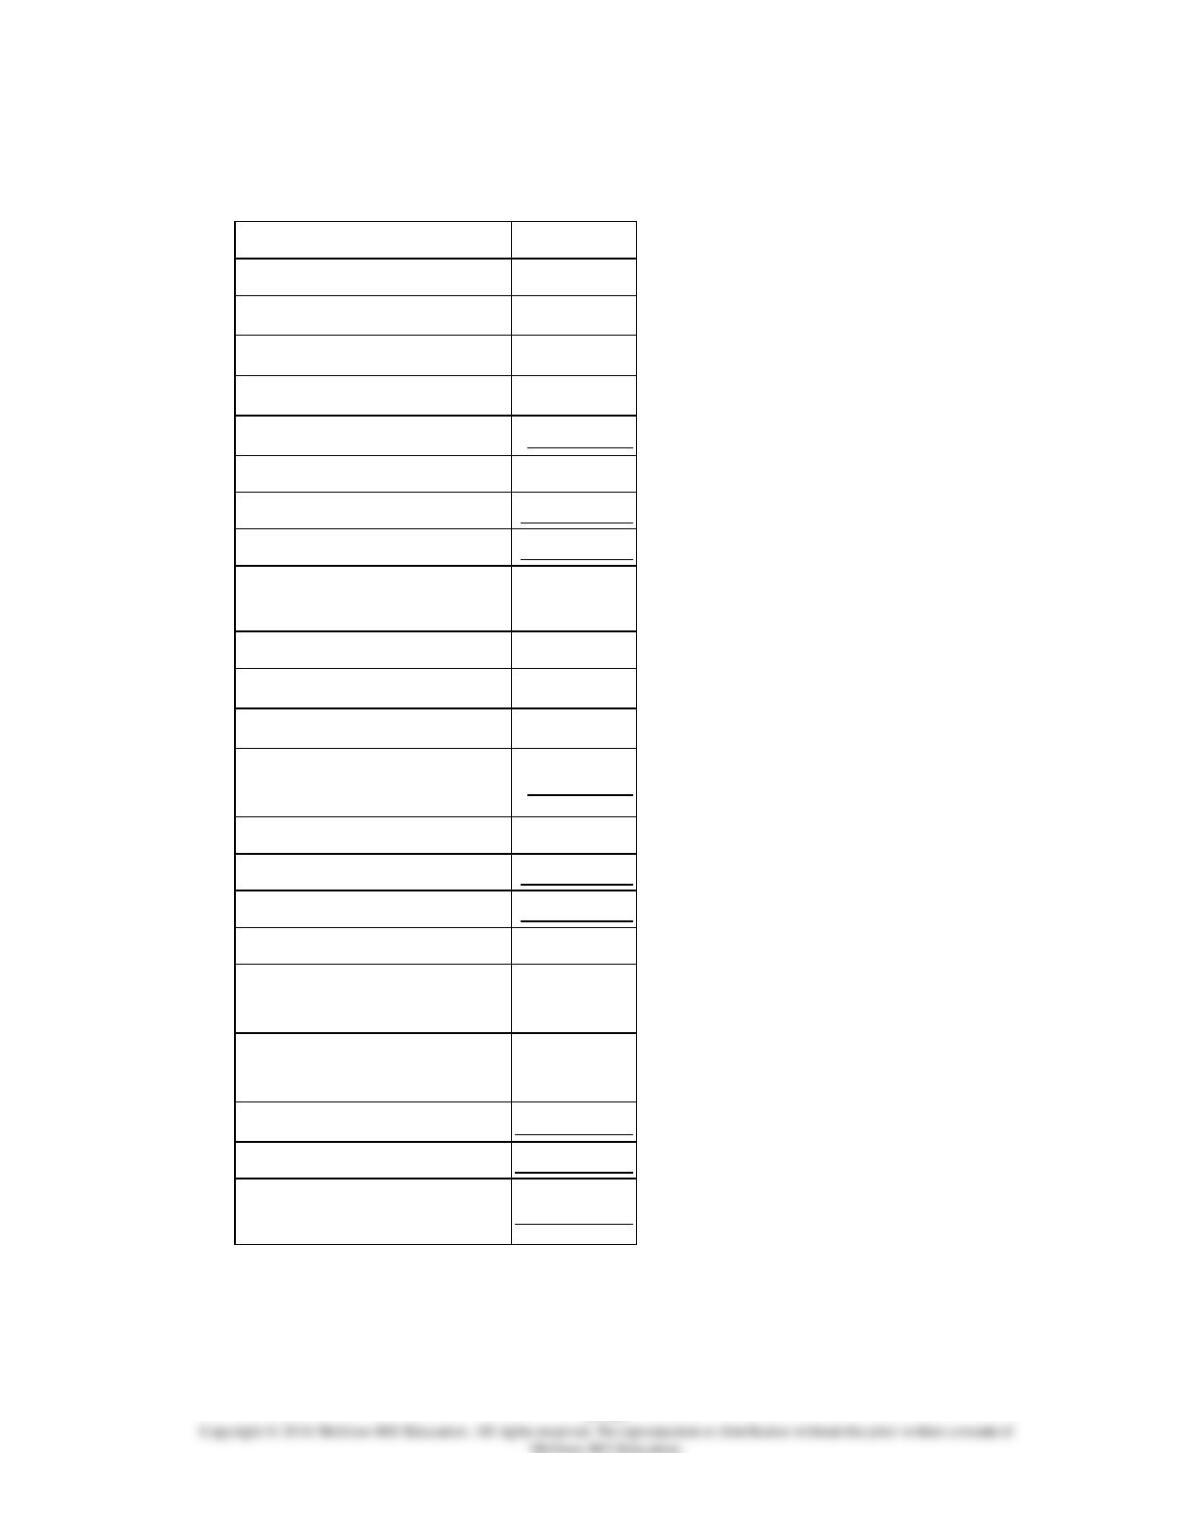
135.
Mayfield Corporation has provided the following financial data:
Assets
Current assets:
Cash
$223,000
Accounts receivable
236,000
Inventory
202,000
Prepaid expenses
10,000
Total current assets
671,000
Plant and equipment, net
665,000
Total assets
$1,336,000
Liabilities and
Stockholders’ Equity
Current liabilities:
Accounts payable
$156,000
Accrued liabilities
52,000
Notes payable, short
term
45,000
Total current liabilities
253,000
Bonds payable
100,000
Total liabilities
353,000
Stockholders’ equity:
Common stock, $4 par
value
360,000
Additional paid-in
capital-common stock
80,000
Retained earnings
543,000
Total stockholders’ equity
983,000
Total liabilities &
stockholders’ equity
$1,336,000
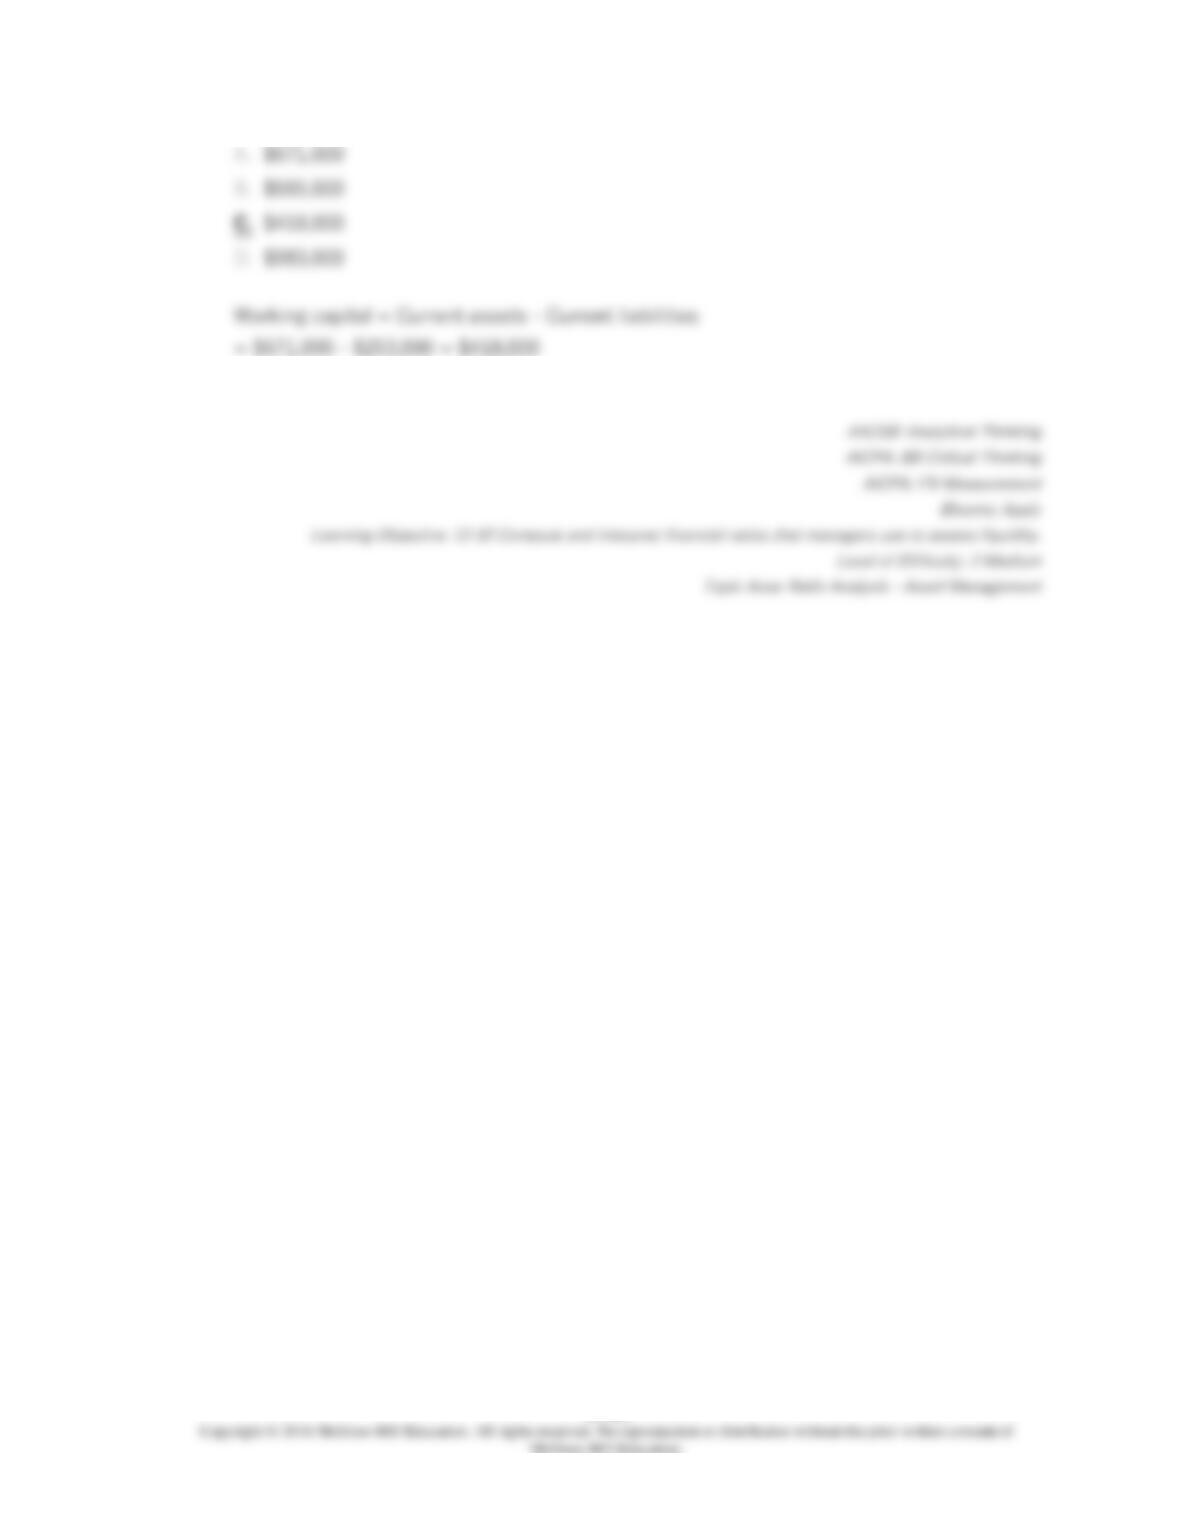
The company’s working capital is:
13–382
13–383
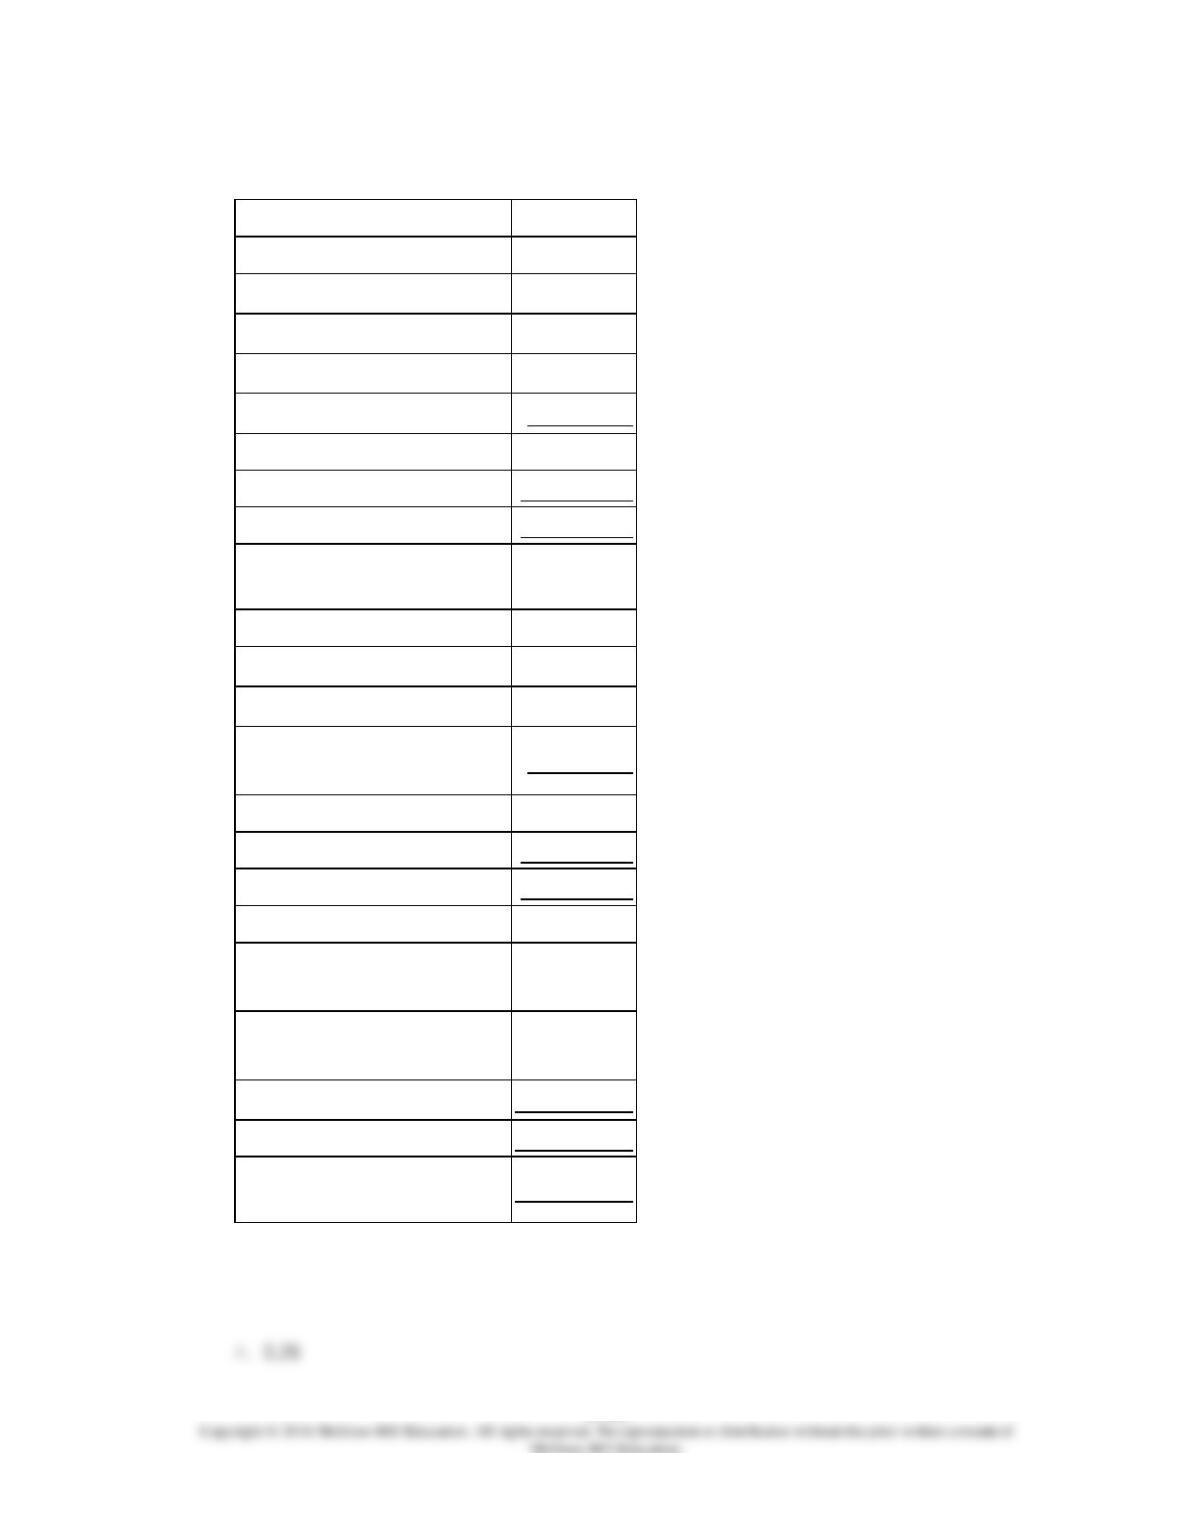
136.
Mayfield Corporation has provided the following financial data:
Assets
Current assets:
Cash
$223,000
Accounts receivable
236,000
Inventory
202,000
Prepaid expenses
10,000
Total current assets
671,000
Plant and equipment, net
665,000
Total assets
$1,336,000
Liabilities and
Stockholders’ Equity
Current liabilities:
Accounts payable
$156,000
Accrued liabilities
52,000
Notes payable, short
term
45,000
Total current liabilities
253,000
Bonds payable
100,000
Total liabilities
353,000
Stockholders’ equity:
Common stock, $4 par
value
360,000
Additional paid-in
capital-common stock
80,000
Retained earnings
543,000
Total stockholders’ equity
983,000
Total liabilities &
stockholders’ equity
$1,336,000
The company’s current ratio is closest to:
13–384