97. Broch Corporation’s income statement appears below:
Income Statement
Sales (all on account) $1,220,000
Cost of goods sold 760,000
Gross margin 460,000
Operating expenses 415,692
Net operating income 44,308
Interest expense 14,000
Net income before taxes 30,308
Income taxes (35%) 10,608
Net income $19,700
The company’s times interest earned is closest to:
98. Cutsinger Corporation has provided the following data from its most recent income
statement:
Net operating income $55,000
Interest expense $43,000
Net income before taxes $12,000
Income taxes $4,000
Net income $8,000
The times interest earned ratio is closest to:
99. Karma Corporation has total assets of $190,000 and total liabilities of $90,000. The
corporation’s debt–to-equity ratio is closest to:
100. Rough Corporation’s total assets at the end of Year 2 were $1,247,000 and at the end of
Year 1 were $1,270,000. The company’s total liabilities at the end of Year 2 were $512,000 and at
the end of Year 1 were $550,000. The company’s total stockholders’ equity at the end of Year 2
was $735,000 and at the end of Year 1 was $720,000. The company’s equity multiplier is closest
to:
101. Younis Corporation’s income statement appears below:
Income Statement
Sales (all on account) $1,240,000
Cost of goods sold 780,000
Gross margin 460,000
Operating expenses 416,571
Net operating income 43,429
Interest expense 14,000
Net income before taxes 29,429
Income taxes (30%) 8,829
Net income $20,600
The company’s net profit margin percentage is closest to:
102. Crosswhite Corporation’s sales last year were $1,270,000, its gross margin was $400,000,
its net operating income was $53,769, and its net income was $26,500. The company’s net profit
margin percentage is closest to:
103. Mars Corporation has provided the following data for Year 2:
Sales $1,330,000
Gross margin $500,000
Net operating income $79,692
Net income before taxes $63,692
Net income $41,400
The company’s total stockholders’ equity at the end of Year 2 amounted to $1,095,000 and at the
end of Year 1 to $1,060,000. The company’s return on equity for Year 2 is closest to:
104. Sapien Corporation has provided the following data for the most recent year:
Sales $1,340,000
Gross margin $460,000
Net operating income $54,846
Net income before taxes $41,846
Net income $27,200
The company’s gross margin percentage is closest to:
105. Mormino Corporation’s income statement appears below:
Income Statement
Sales (all on account) $1,240,000
Cost of goods sold 730,000
Gross margin 510,000
Operating expenses 450,462
Net operating income 59,538
Interest expense 18,000
Net income before taxes 41,538
Income taxes (35%) 14,538
Net income $27,000
The company’s gross margin percentage is closest to:
106. Jester Corporation’s most recent income statement appears below:
Sales (all on account) $610,000
Cost of goods sold 340,000
Gross margin 270,000
Selling and administrative expense 160,000
Net operating income 110,000
Interest expense 20,000
Net income before taxes 90,000
Income taxes (30%) 27,000
Net income $63,000
The beginning balance of total assets was $360,000 and the ending balance was $320,000. The
return on total assets is closest to:
107. For Year 2, Etzkorn Corporation’s sales were $1,480,000, its gross margin was $580,000,
its net operating income was $63,714, its net income before taxes was $42,714, and its net
income was $29,900. The company’s total stockholders’ equity at the end of Year 2 amounted to
$829,000 and at the end of Year 1 to $800,000. The company’s return on equity for Year 2 is
closest to:
108. Kienle Corporation’s Year 2 income statement appears below:
Income Statement
Sales $1,280,000
Cost of goods sold 800,000
Gross margin 480,000
Operating expenses 419,857
Net operating income 60,143
Interest expense 12,000
Net income before taxes 48,143
Income taxes (30%) 14,443
Net income $33,700
The company’s total assets at the end of Year 2 amounted to $1,359,000 and at the end of Year 1
to $1,320,000. The company’s return on total assets for Year 2 is closest to:
109. Valdovinos Corporation has provided the following data:
Sales (all on account) $1,150,000
Gross margin $440,000
Net operating income $40,077
Net income before taxes $23,077
Net income $15,000
The company’s net profit margin percentage is closest to:
110. Braverman Corporation’s net income last year was $75,000 and its interest expense was
$10,000. Total assets at the beginning of the year were $650,000 and total assets at the end of
the year were $610,000. The corporation’s income tax rate was 30%. The corporation’s return on
total assets for the year was closest to:
111. Grosvenor Corporation’s most recent income statement appears below:
Sales (all on account) $807,000
Cost of goods sold 446,000
Gross margin 361,000
Selling and administrative expense 186,000
Net operating income 175,000
Interest expense 39,000
Net income before taxes 136,000
Income taxes 40,000
Net income $96,000
The gross margin percentage is closest to:
112. Fongeallaz Corporation’s income statement for Year 2 appears below:
Income Statement
Sales (all on account) $1,360,000
Cost of goods sold 870,000
Gross margin 490,000
Operating expenses 416,286
Net operating income 73,714
Interest expense 18,000
Net income before taxes 55,714
Income taxes (35%) 16,714
Net income $39,000
The company’s total stockholders’ equity at the end of Year 2 amounted to $841,000 and at the
end of Year 1 to $810,000. The company’s return on equity for Year 2 is closest to:
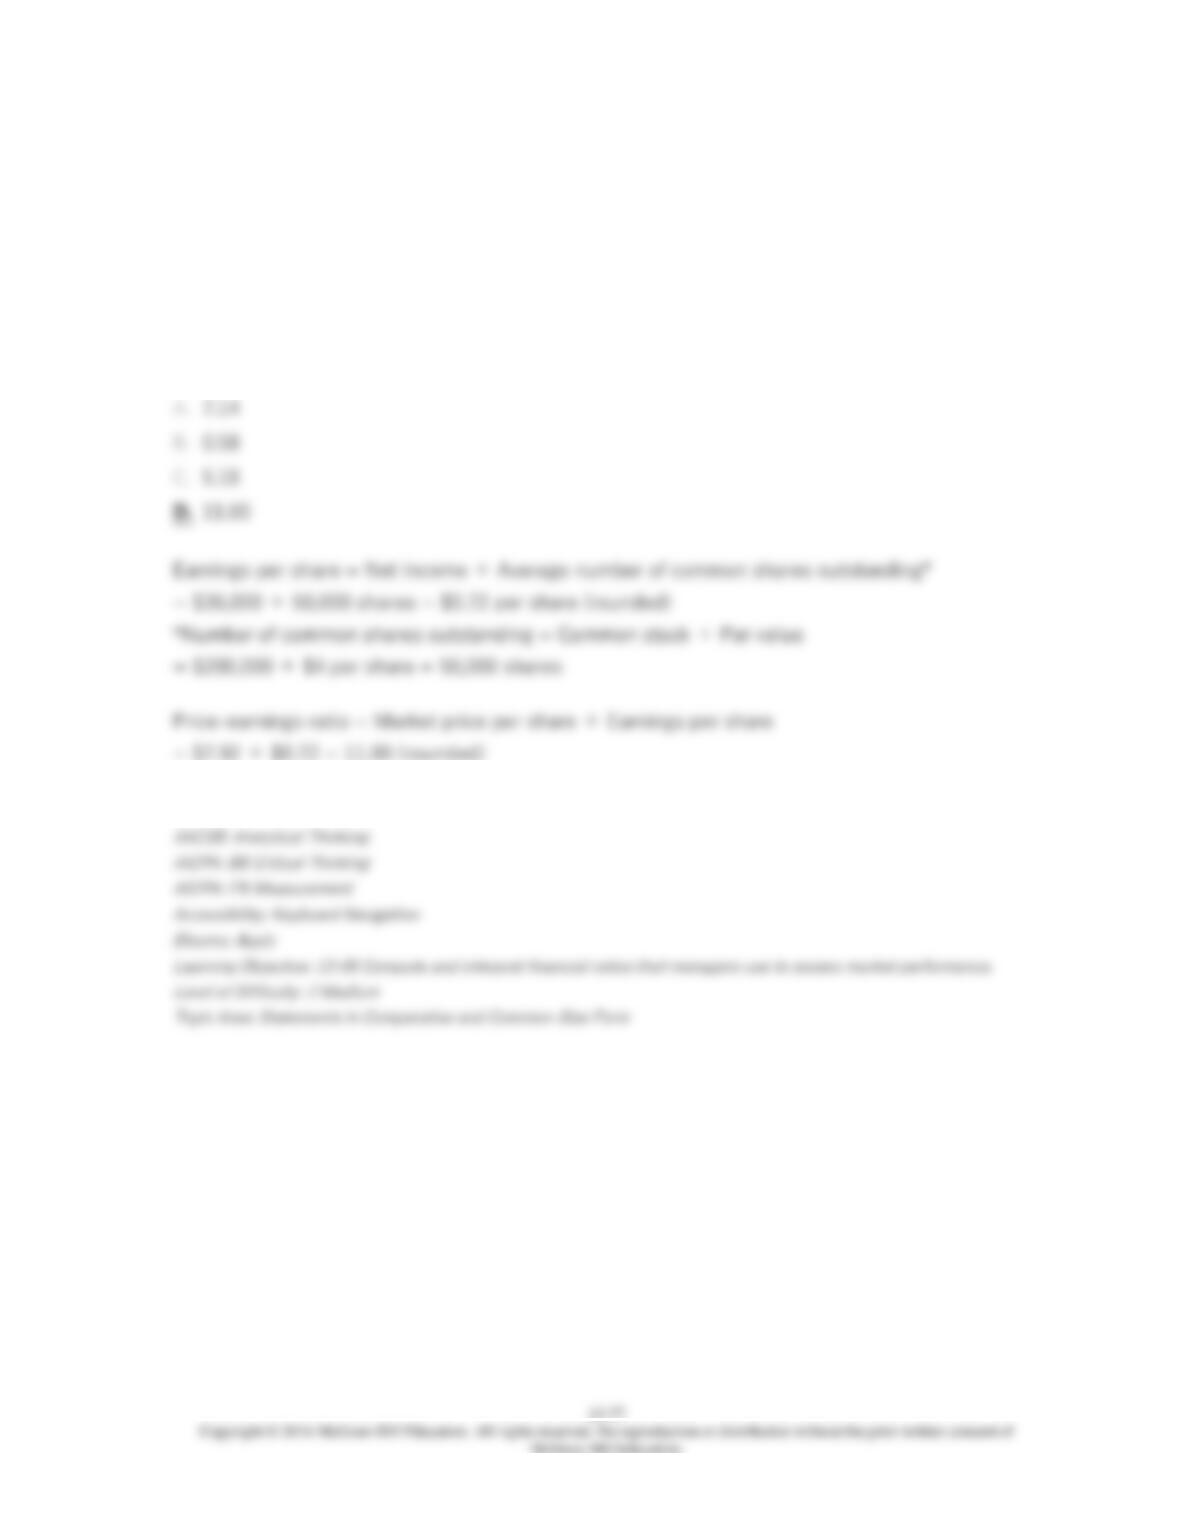
113. Weightman Corporation’s net operating income in Year 2 was $76,385, net income before
taxes was $55,385, and the net income was $36,000. Total common stock was $200,000 at the
end of both Year 2 and Year 1. The par value of common stock is $4 per share. The company’s
total stockholders’ equity at the end of Year 2 amounted to $983,000 and at the end of Year 1 to
$950,000. The market price per share at the end of Year 2 was $7.92. The company’s price–
earnings ratio for Year 2 is closest to:
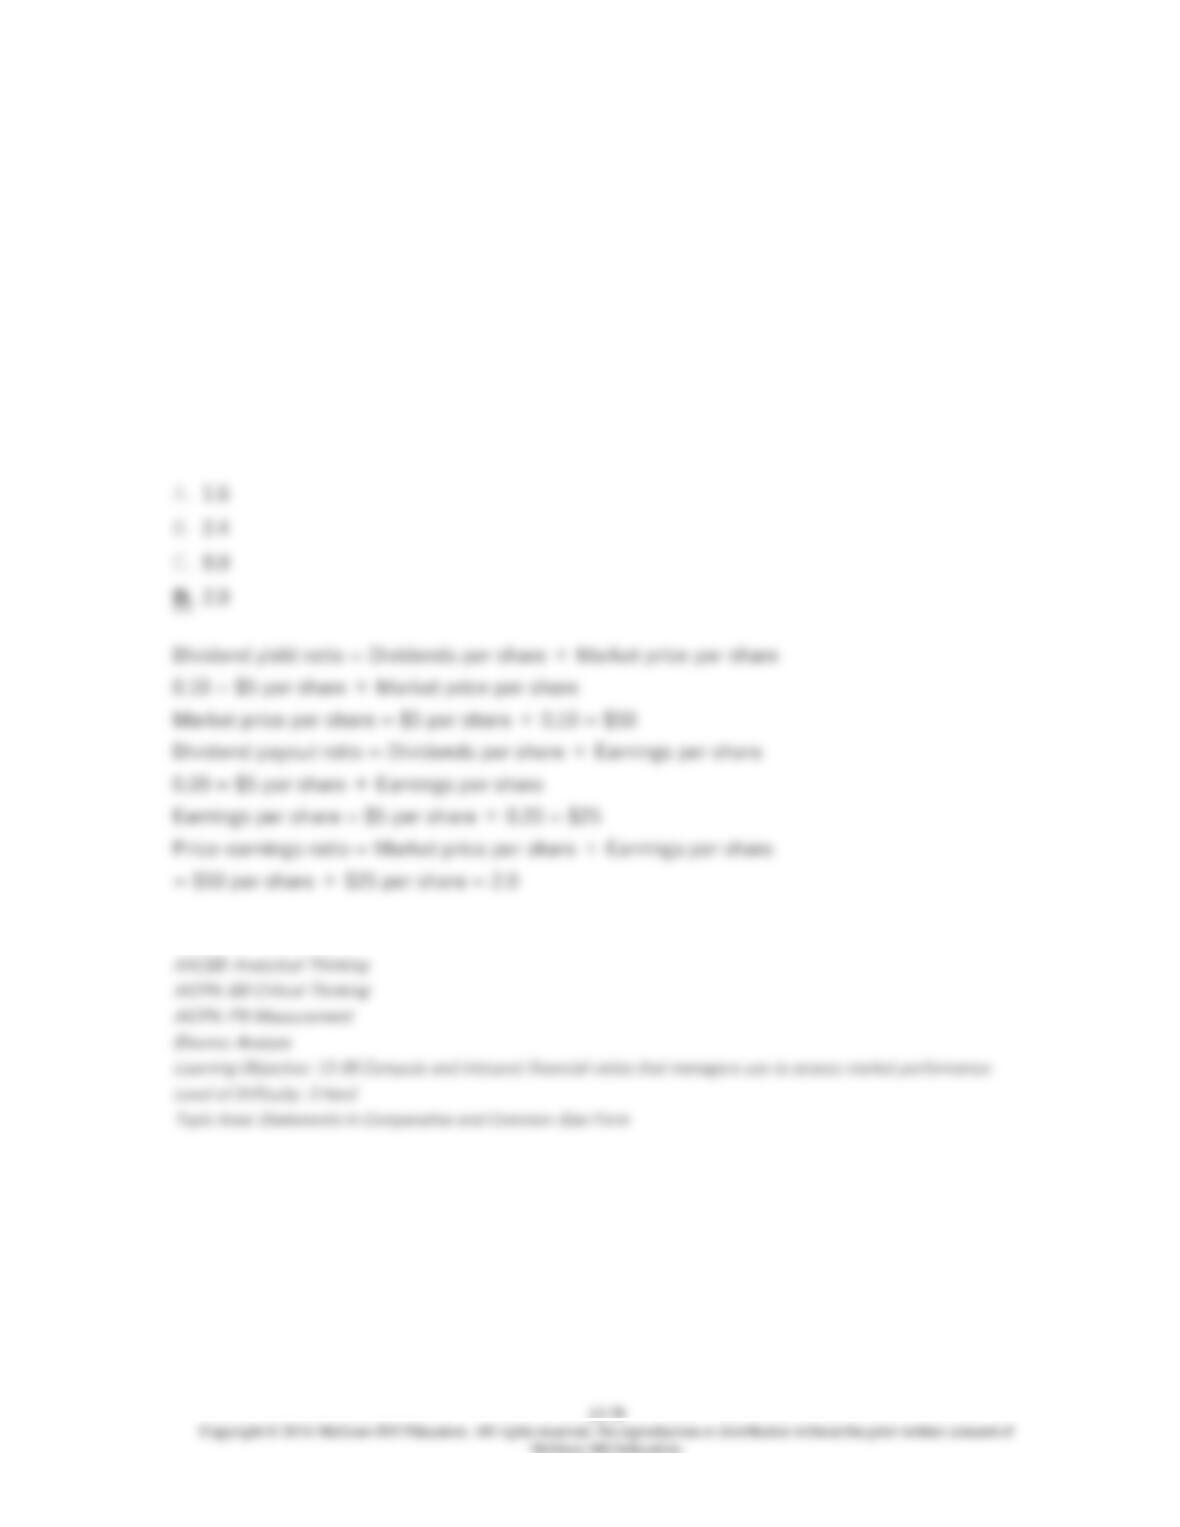
114. The following information relates to Conejo Corporation for last year:
Book value per share $40
Par value per share $12
Dividends per share $5
Dividend payout ratio 20%
Dividend yield ratio 10%
What is Conejo’s price-earnings ratio for last year?
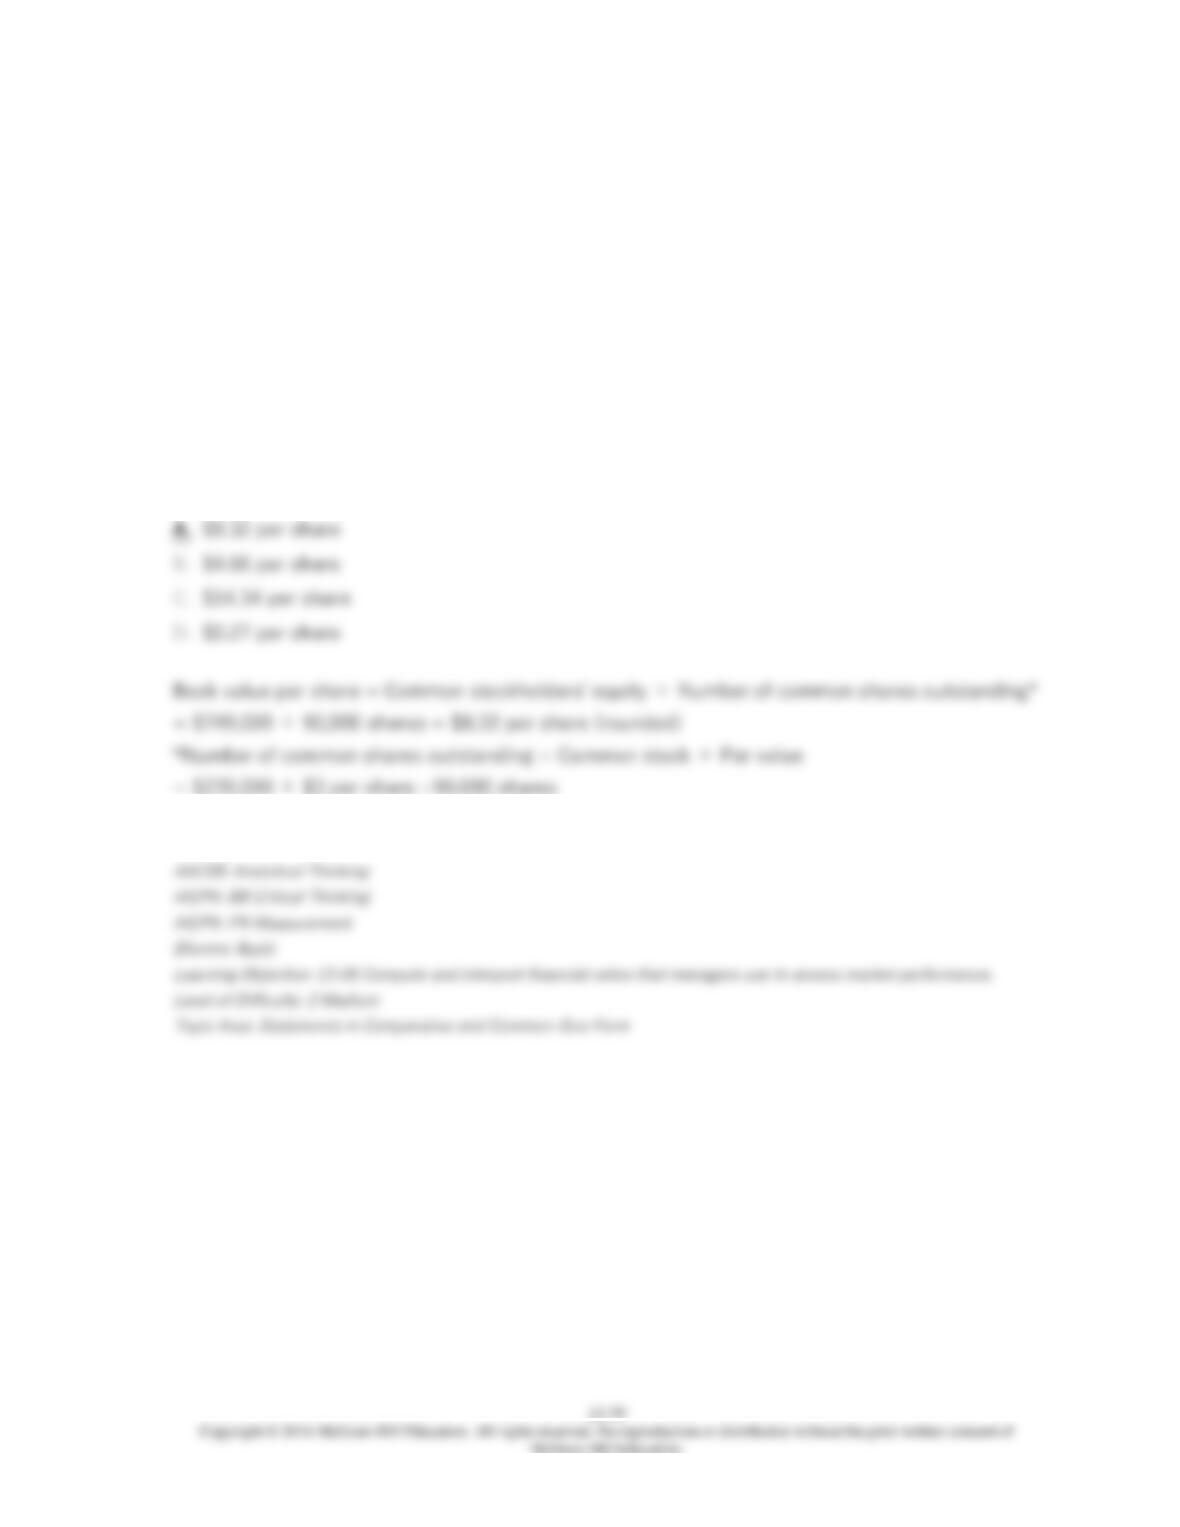
115. Goldsmith Corporation has provided the following data:
Year 2 Year 1
Common stock, $3 par value $270,000 $270,000
Retained earnings $419,000 $400,000
Total stockholders’ equity $749,000 $730,000
Total liabilities & stockholders’ equity $1,291,000 $1,270,000
The company’s net income in Year 2 was $24,400. The company’s book value per share at the
end of Year 2 is closest to:
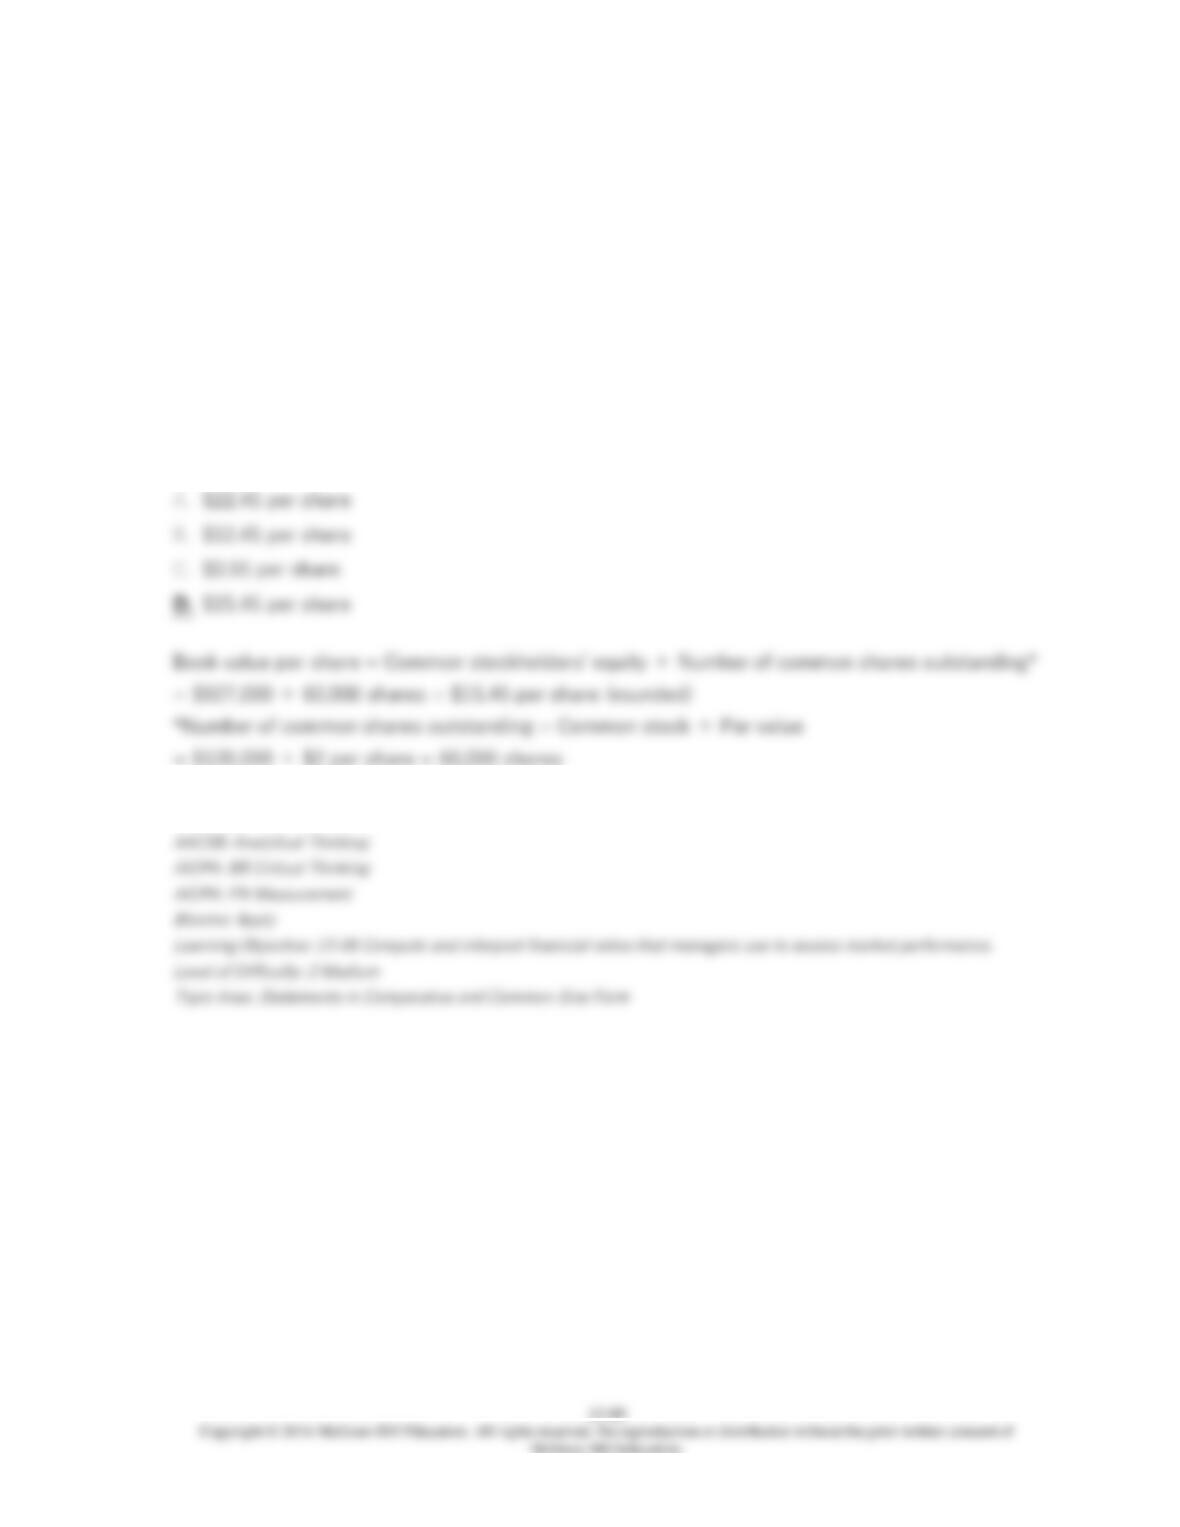
116. Linzey Corporation has provided the following data:
Year 2 Year 1
Common stock, $2 par value $120,000 $120,000
Retained earnings $747,000 $720,000
Total stockholders’ equity $927,000 $900,000
The company’s net income in Year 2 was $33,000. The company’s book value per share at the
end of Year 2 is closest to: