13–585
13–586
255.
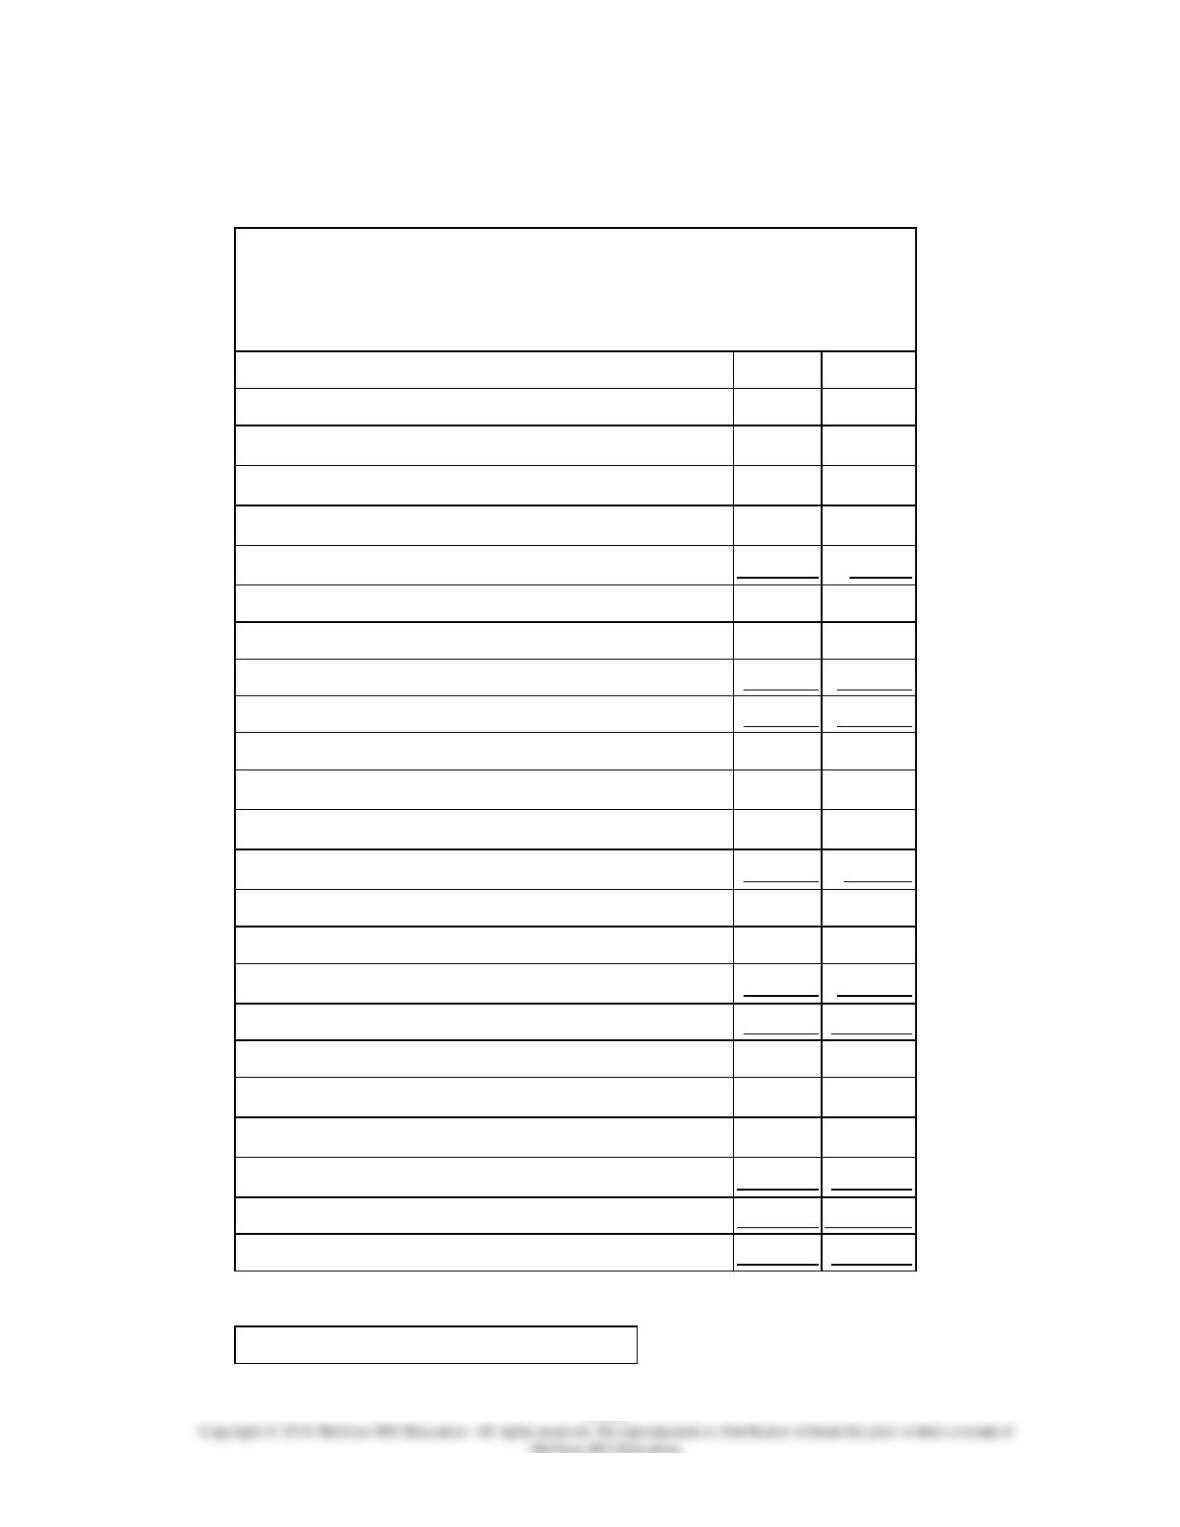
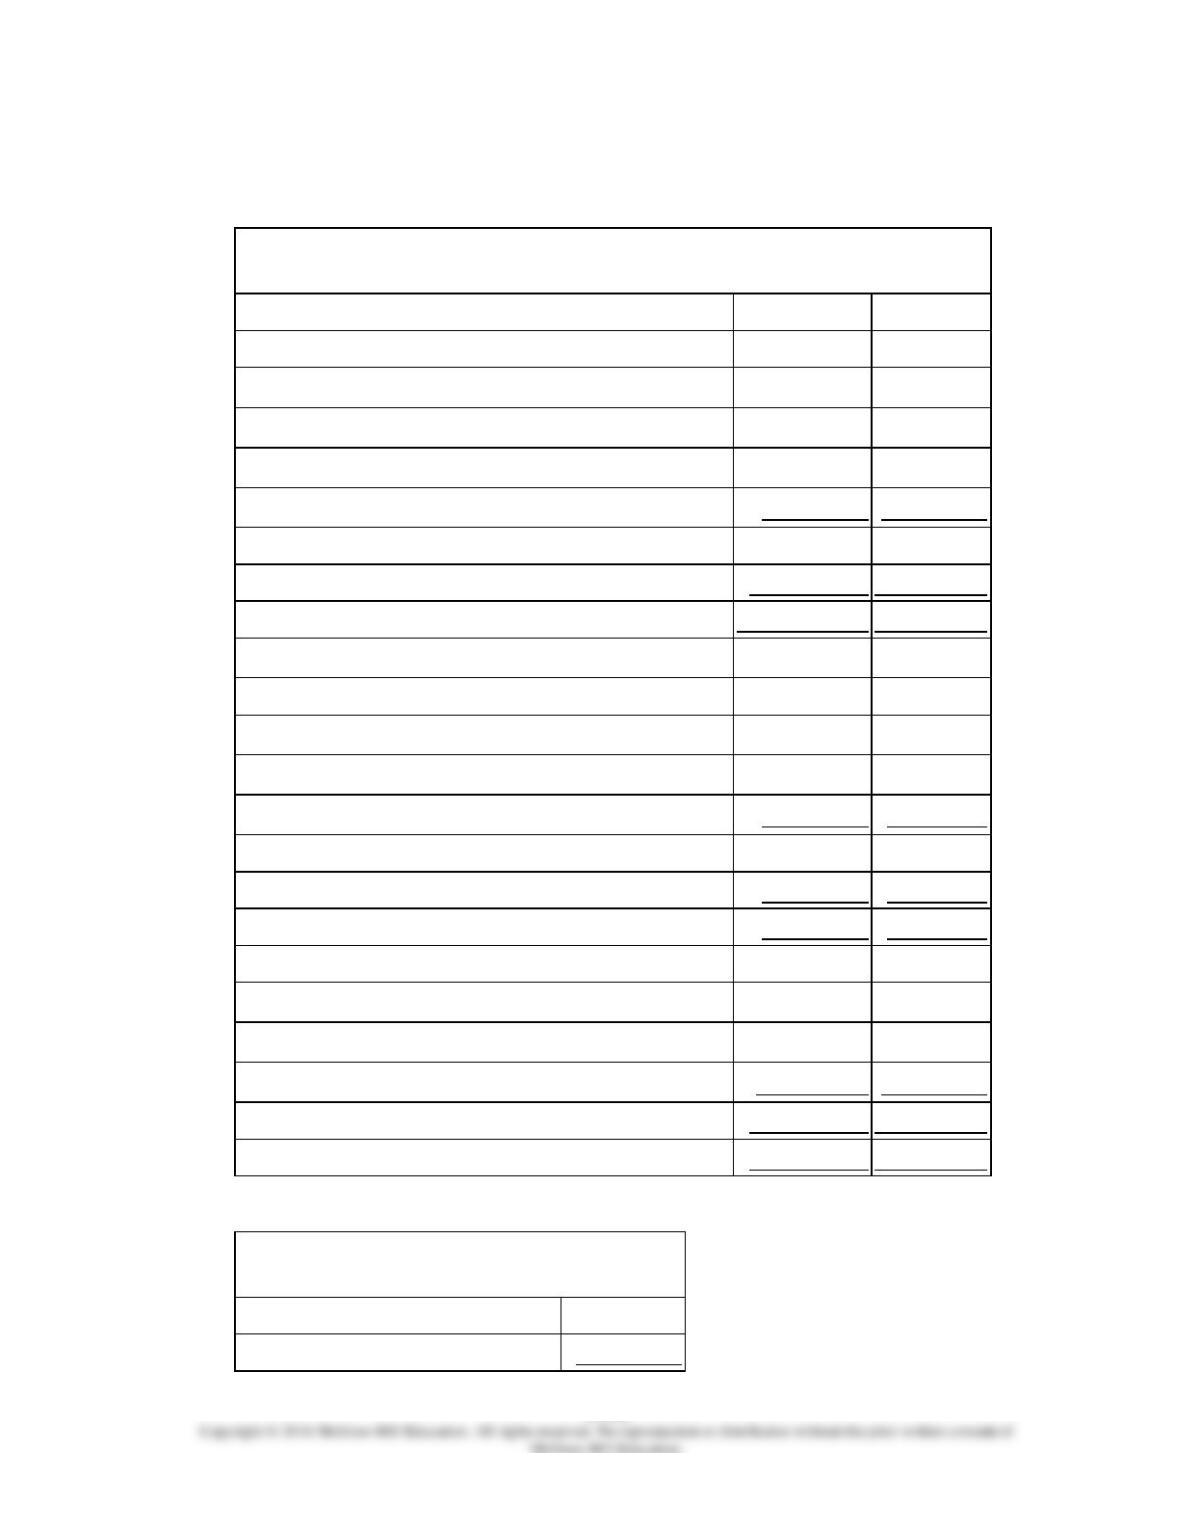
Financial statements for Praeger Corporation appear below:
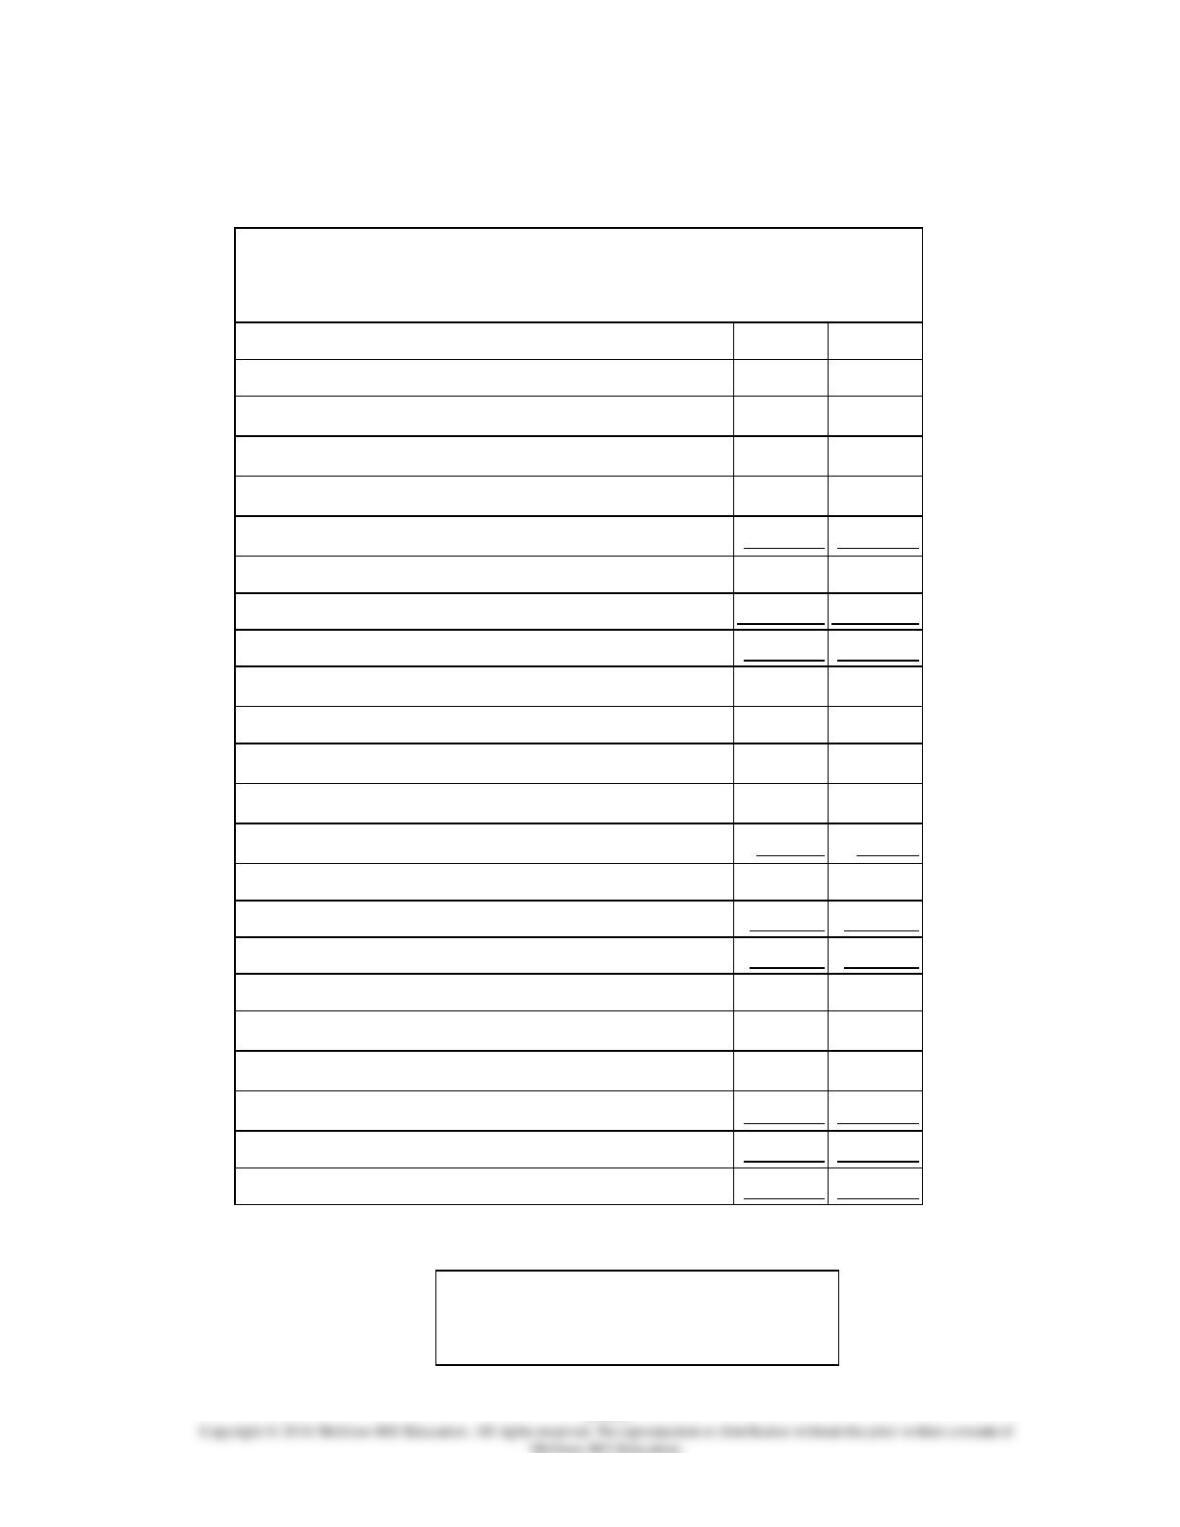
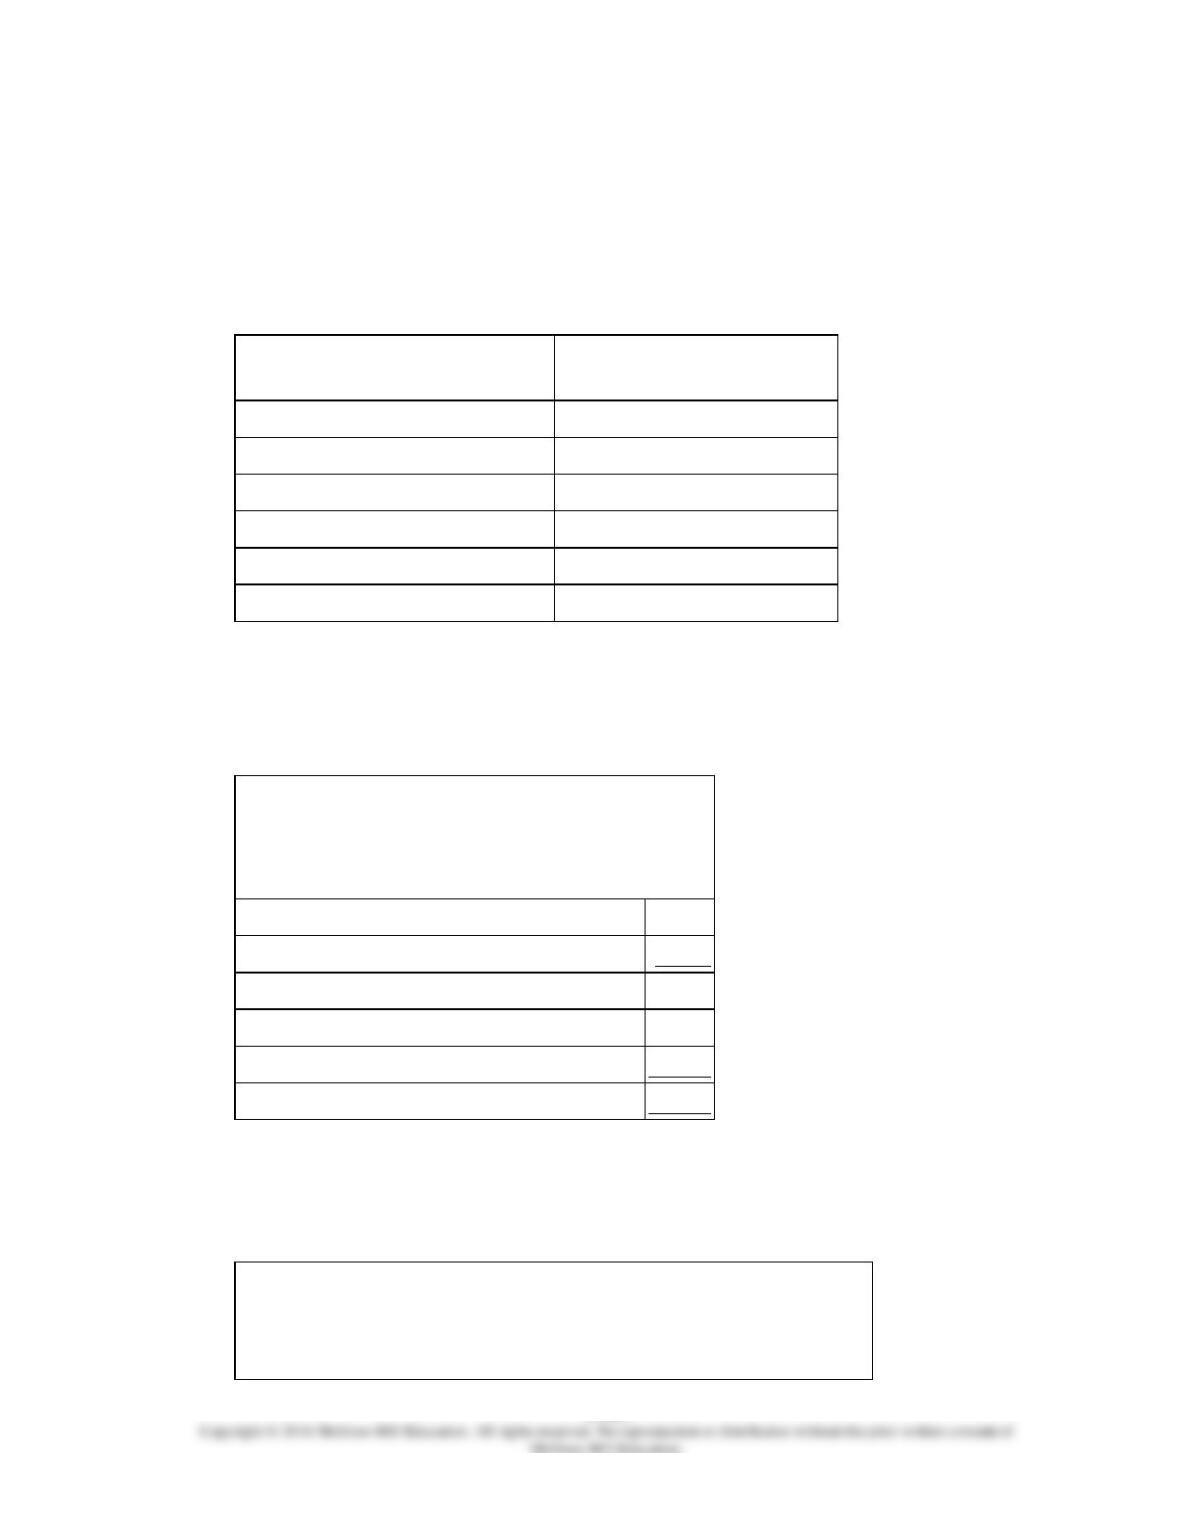
Praeger Corporation
Balance Sheet
December 31, Year 2 and Year 1
(dollars in thousands)
Year 2
Year 1
Current assets:
Cash and marketable securities
$100
$100
Accounts receivable, net
170
170
Inventory
110
110
Prepaid expenses
60
60
Total current assets
440
440
Noncurrent assets:
Plant & equipment, net
2,020
1,990
Total assets
$2,460
$2,430
Current liabilities:
Accounts payable
$140
$170
Accrued liabilities
70
50
Notes payable, short term
100
120
Total current liabilities
310
340
Noncurrent liabilities:
Bonds payable
500
500
Total liabilities
810
840
Stockholders’ equity:
Common stock, $5 par
200
200
Additional paid-in capital-common stock
300
300
Retained earnings
1,150
1,090
Total stockholders’ equity
1,650
1,590
Total liabilities & stockholders’ equity
$2,460
$2,430
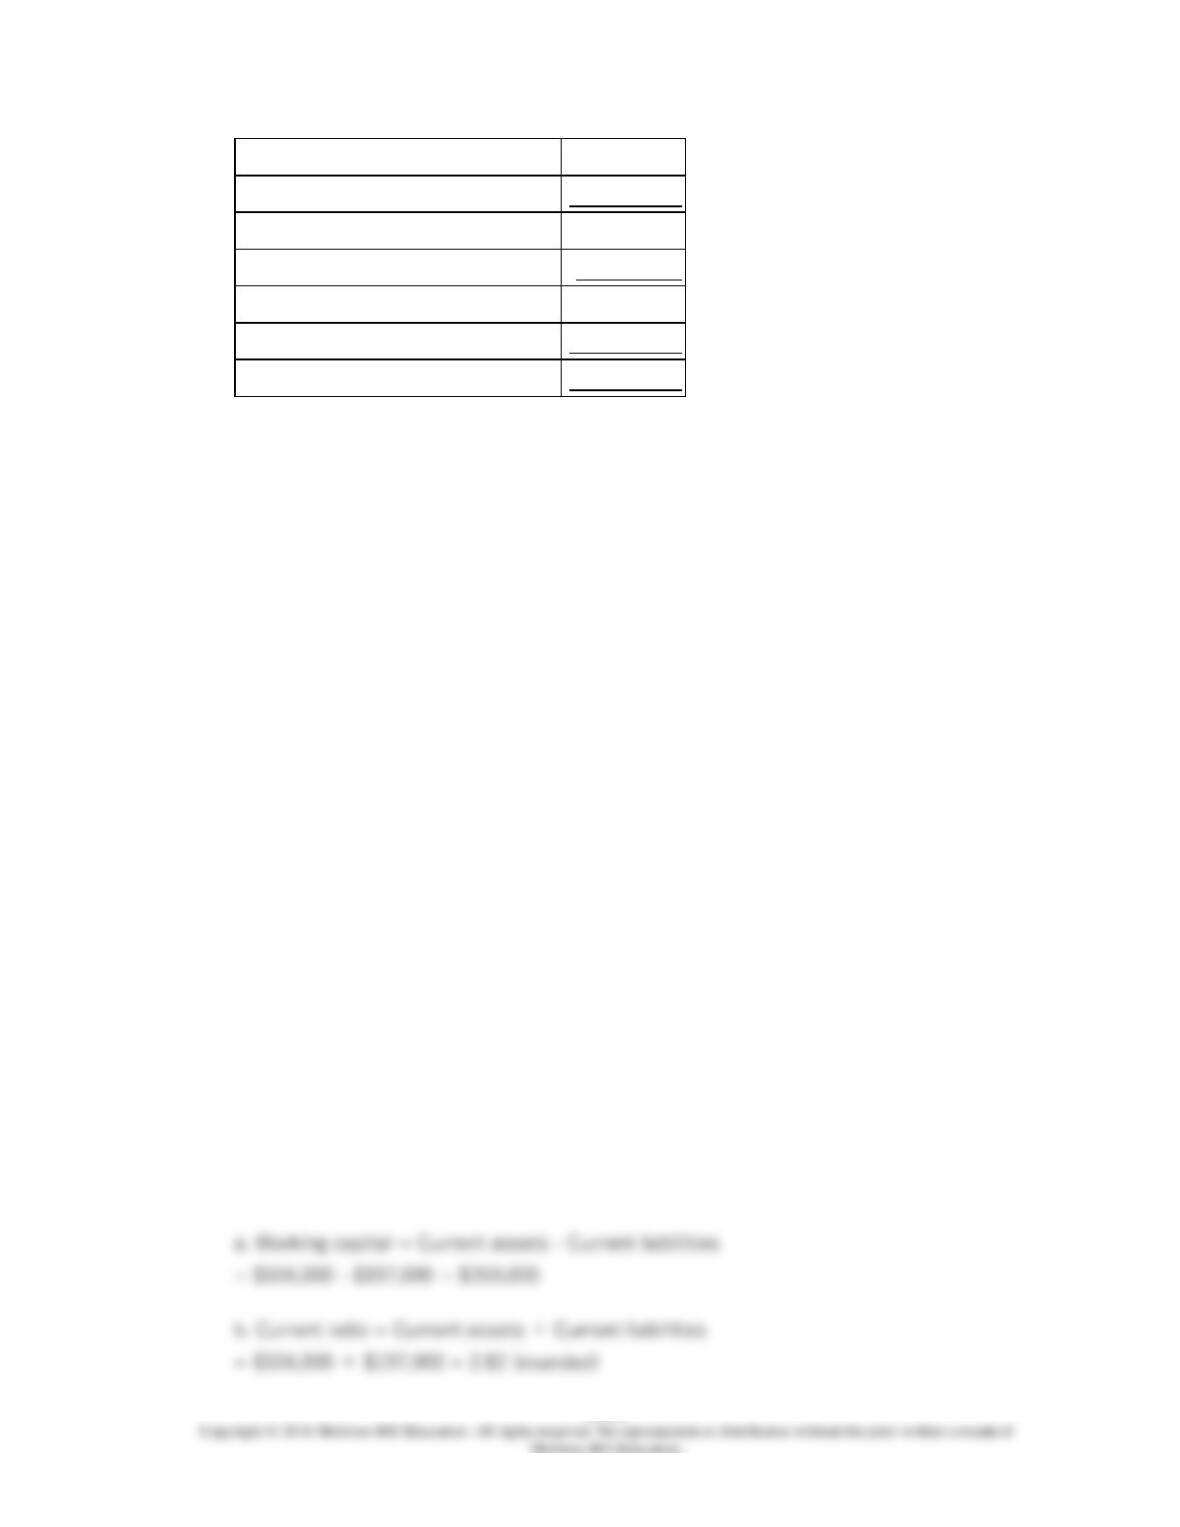
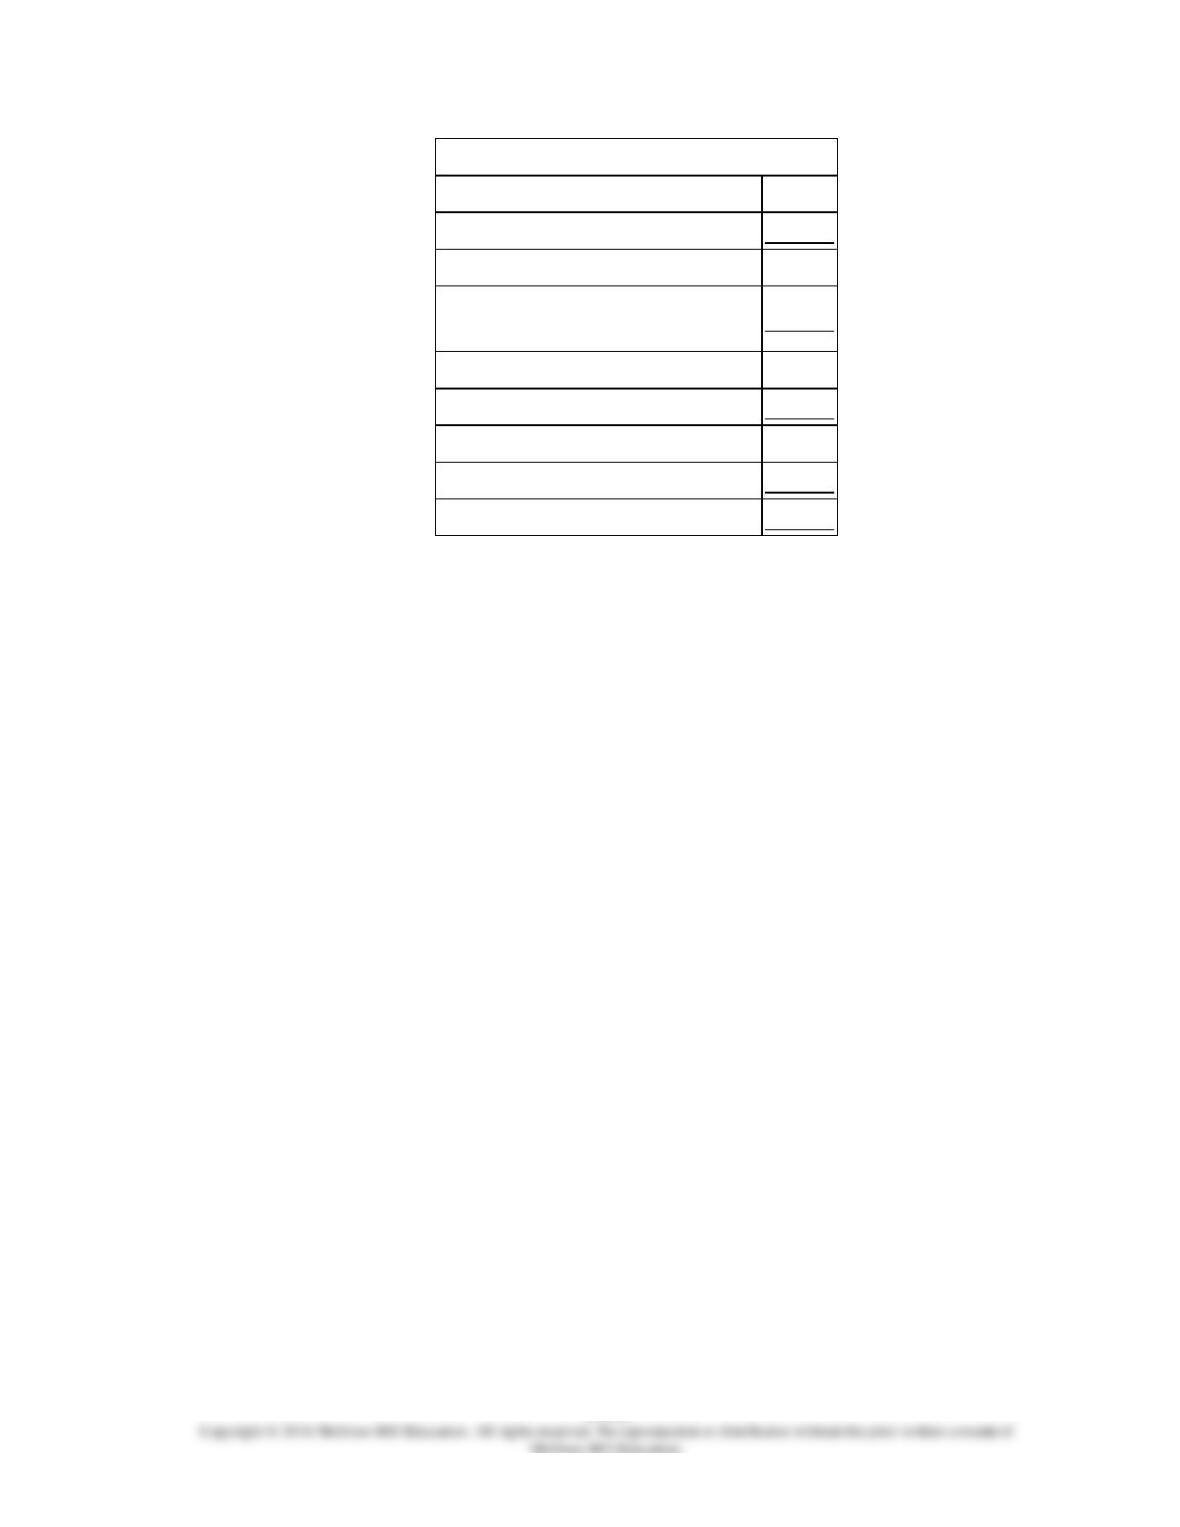
Praeger Corporation
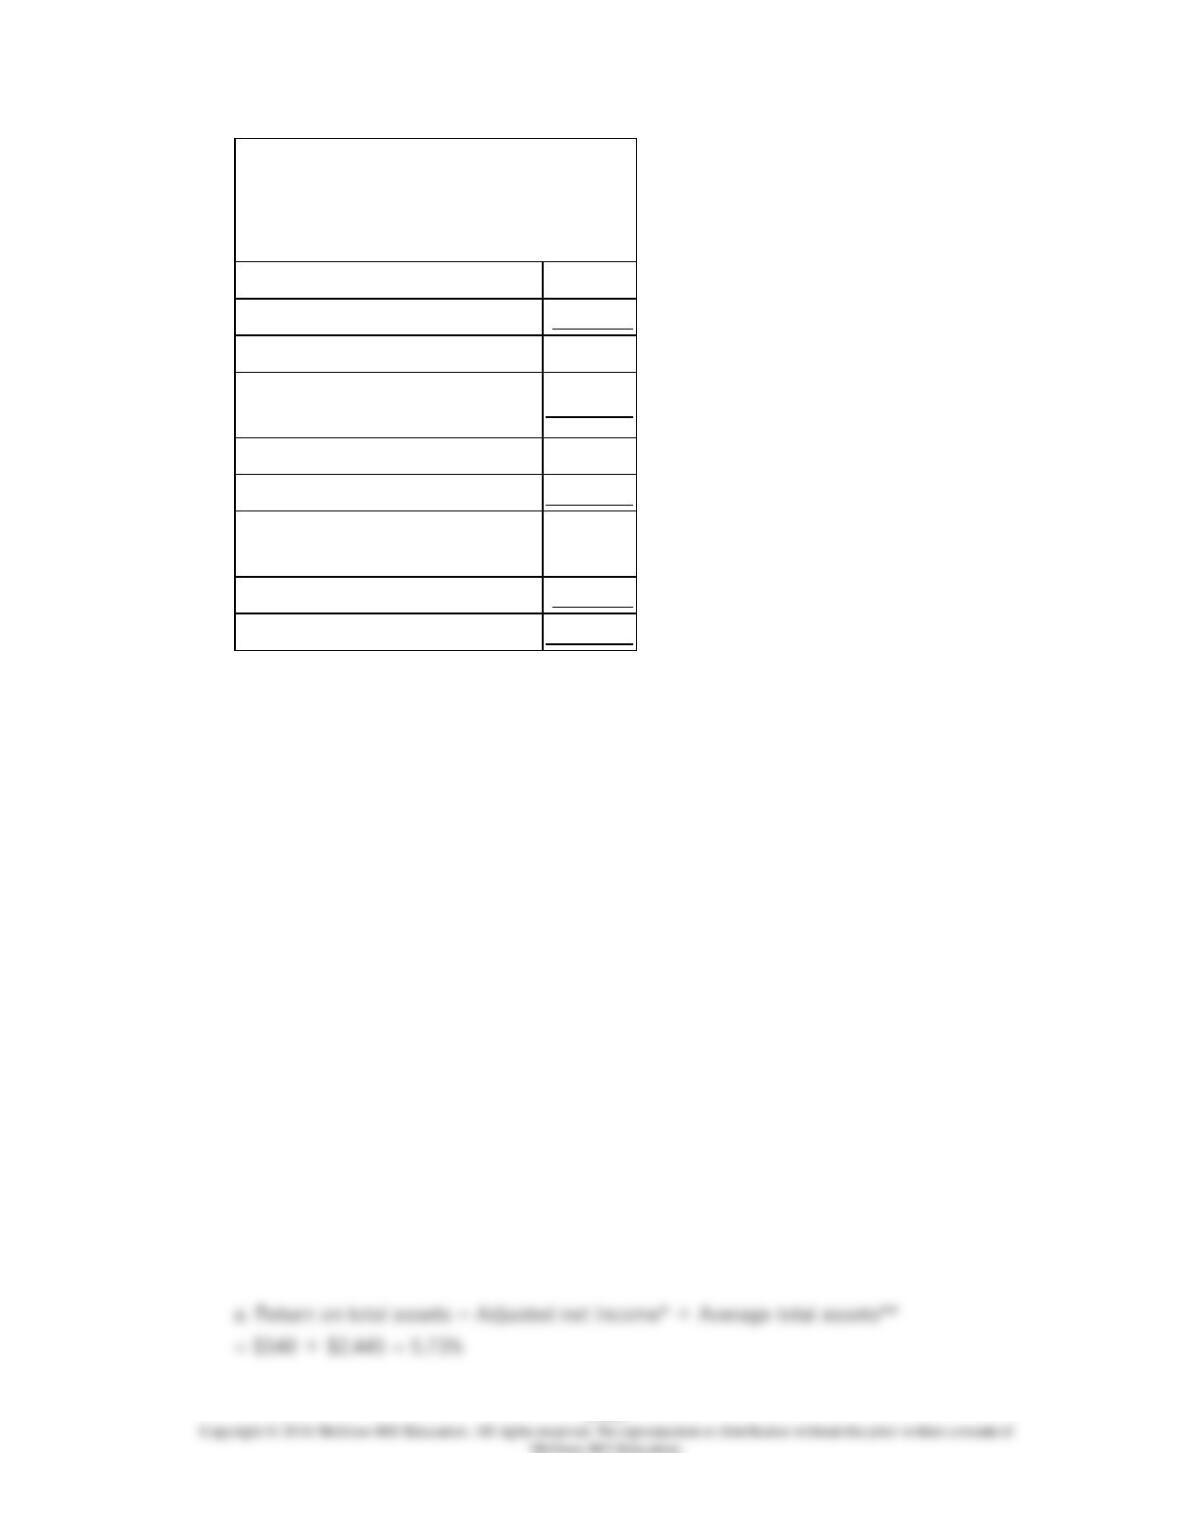
13–587
Income Statement
For the Year Ended December 31,
Year 2
(dollars in thousands)
Sales (all on account)
$1,100
Cost of goods sold
770
Gross margin
330
Selling and administrative
expense
130
Net operating income
200
Interest expense
50
Net income before
taxes
150
Income taxes (30%)
45
Net income
$105
Dividends during Year 2 totaled $45 thousand. The market price of a share of common
stock on December 31, Year 2 was $30.
Required:
Compute the following for Year 2:
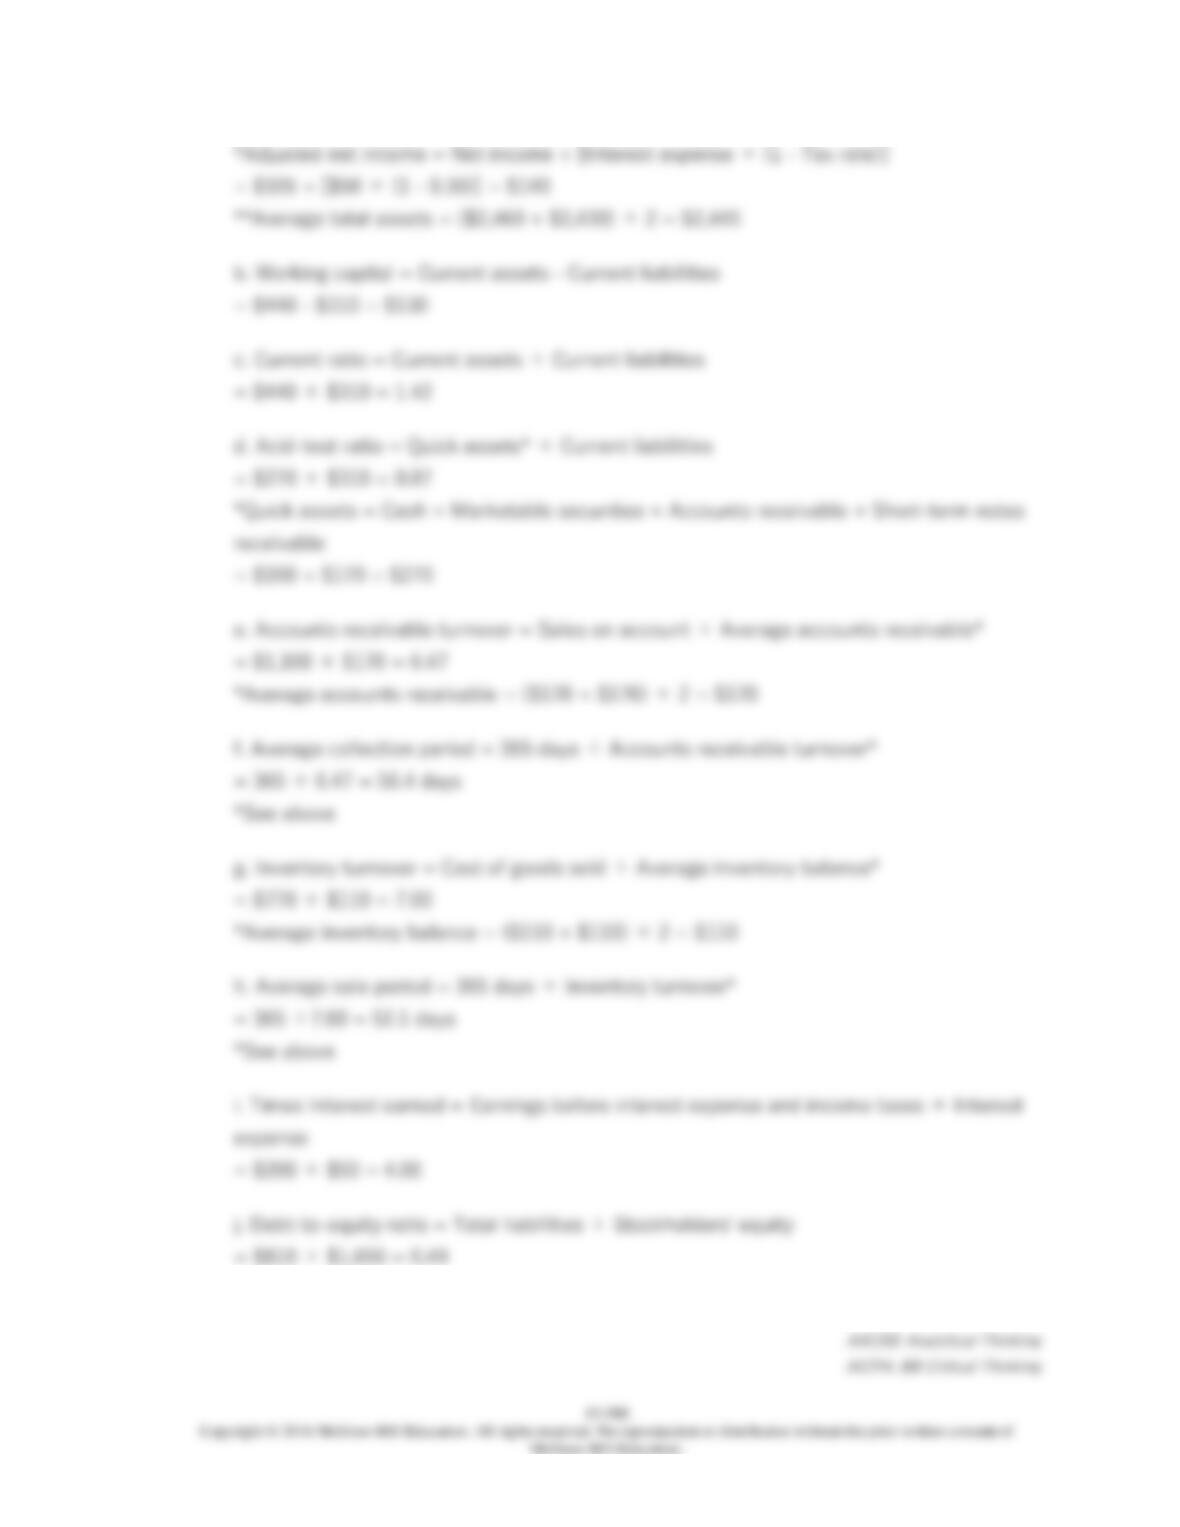
a. Return on total assets.
b. Working capital.
c. Current ratio.
d. Acid-test ratio.
e. Accounts receivable turnover.
f. Average collection period.
g. Inventory turnover.
h. Average sale period.
i. Times interest earned.
j. Debt-to-equity ratio.
13–589
13–590
256.
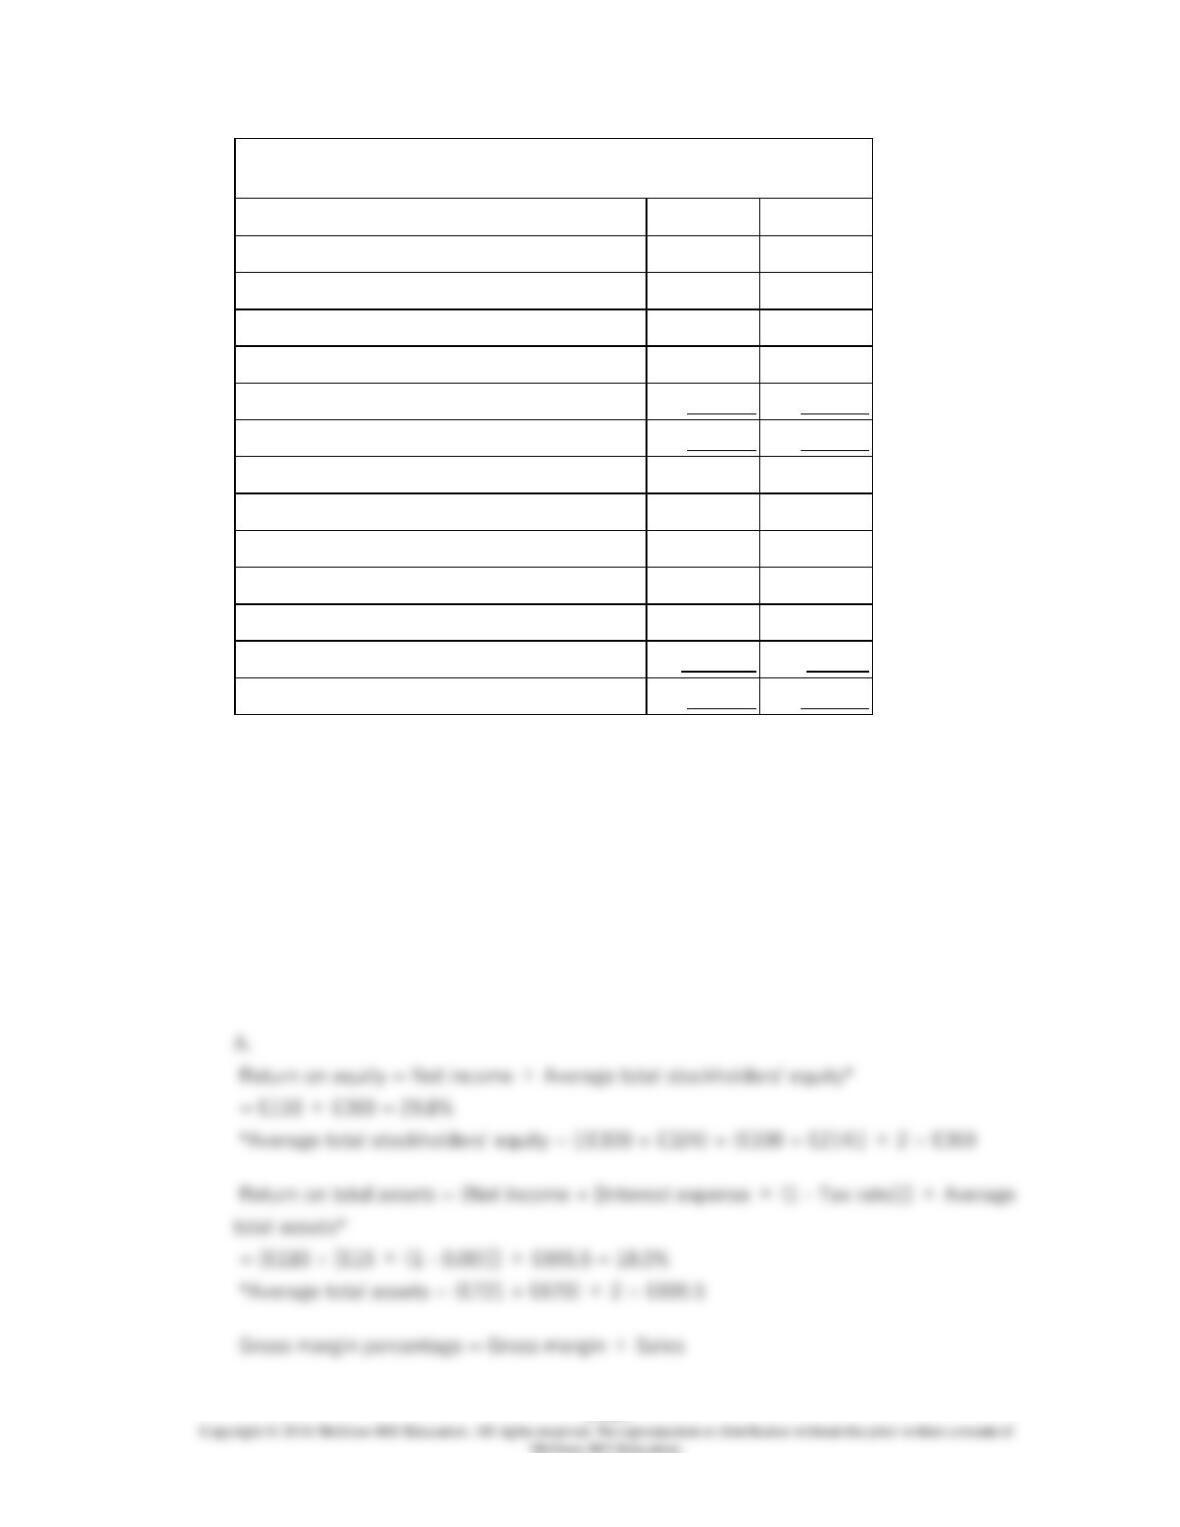
Kaloi Corporation has provided the following financial data:
Balance Sheet
December 31, Year 2 and Year 1
Assets
Year 2
Year 1
Current assets:
Cash
$205,000
$190,000
Accounts receivable
192,000
200,000
Inventory
118,000
130,000
Prepaid expenses
41,000
40,000
Total current assets
556,000
560,000
Plant and equipment, net
813,000
770,000
Total assets
$1,369,000
$1,330,000
Liabilities and Stockholders’ Equity
Current liabilities:
Accounts payable
$115,000
$100,000
Accrued liabilities
27,000
30,000
Notes payable, short term
55,000
60,000
Total current liabilities
197,000
190,000
Bonds payable
130,000
130,000
Total liabilities
327,000
320,000
Stockholders’ equity:
Common stock, $2 par value
100,000
100,000
Additional paid-in capital-common stock
60,000
60,000
Retained earnings
882,000
850,000
Total stockholders’ equity
1,042,000
1,010,000
Total liabilities & stockholders’ equity
$1,369,000
$1,330,000
Income Statement
For the Year Ended December 31, Year 2
Sales (all on account)
$1,370,000
Cost of goods sold
830,000
13–591
Gross margin
540,000
Operating expenses
478,286
Net operating income
61,714
Interest expense
11,000
Net income before taxes
50,714
Income taxes (30%)
15,214
Net income
$35,500
Dividends on common stock during Year 2 totaled $3,500. The market price of common
stock at the end of Year 2 was $7.46 per share.
Required:
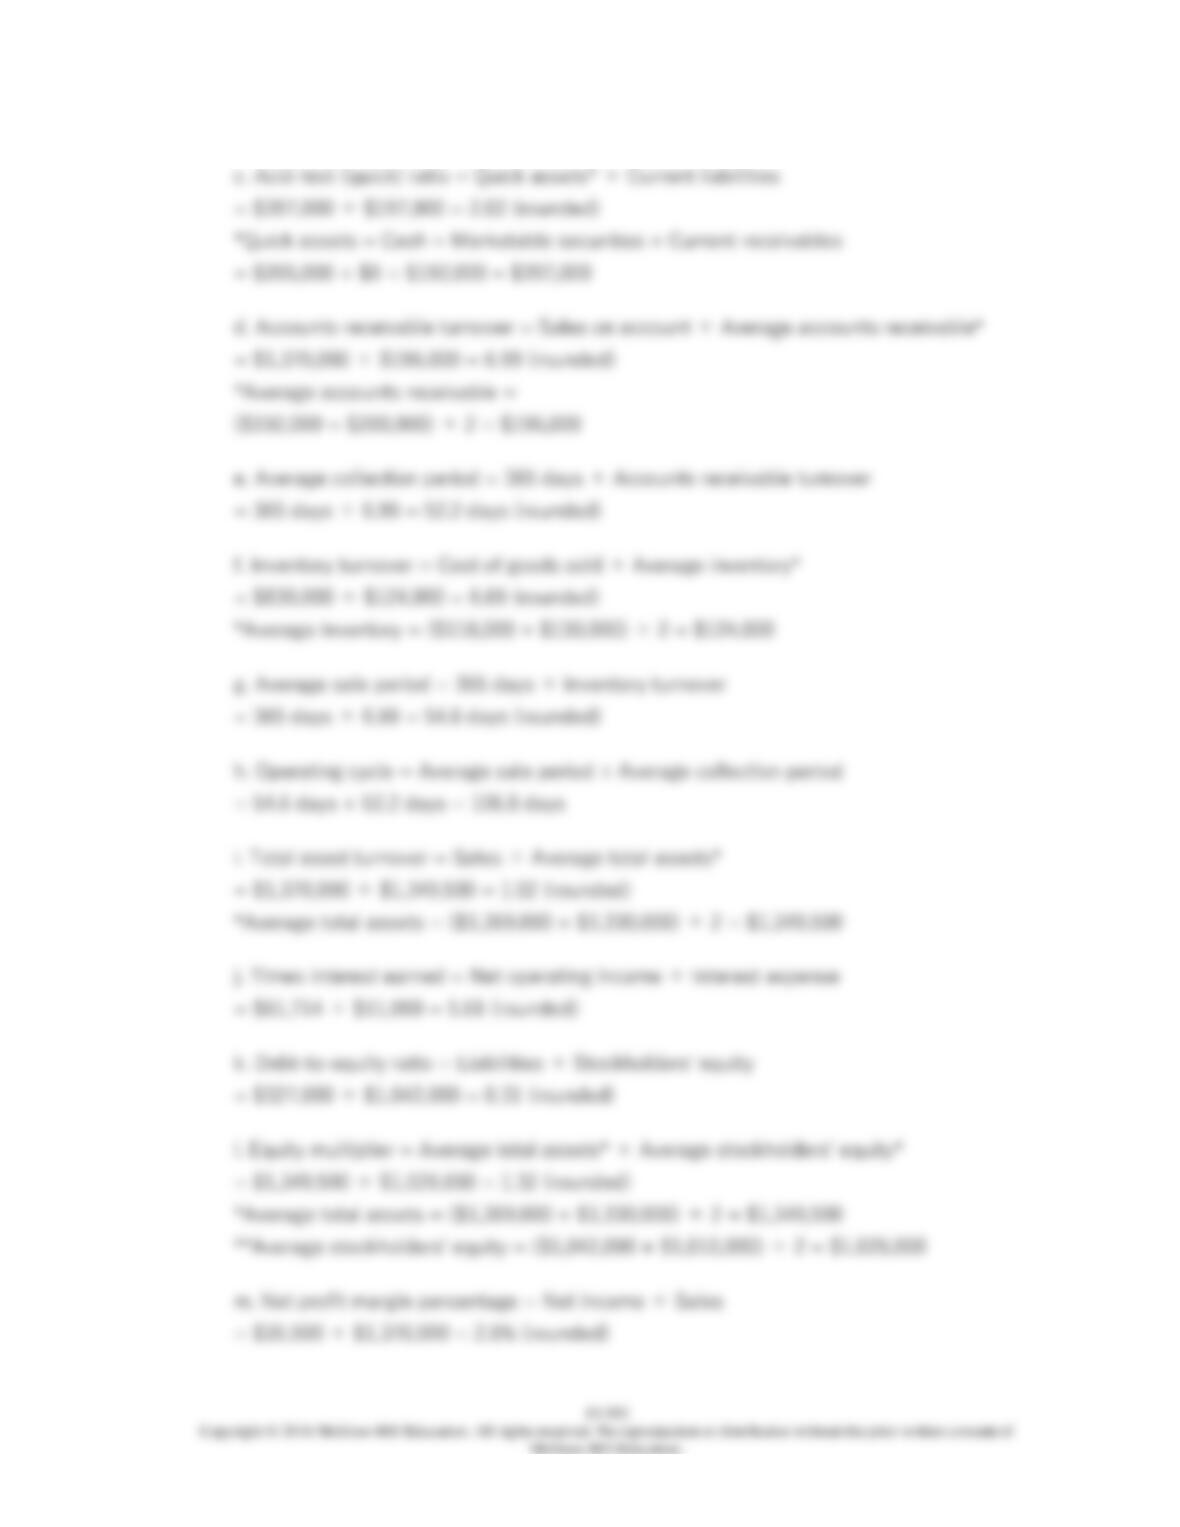
a. What is the company’s working capital at the end of Year 2?
b. What is the company’s current ratio at the end of Year 2?
c. What is the company’s acid-test (quick) ratio at the end of Year 2?
d. What is the company’s accounts receivable turnover for Year 2?
e. What is the company’s average collection period (age of receivables) for Year 2?
f. What is the company’s inventory turnover for Year 2?
g. What is the company’s average sale period (turnover in days) for Year 2?
h. What is the company’s operating cycle for Year 2?
i. What is the company’s total asset turnover for Year 2?
j. What is the company’s times interest earned for Year 2?
k. What is the company’s debt–to-equity ratio at the end of Year 2?
l. What is the company’s equity multiplier at the end of Year 2?
m. What is the company’s net profit margin percentage for Year 2?
n. What is the company’s gross margin percentage for Year 2?
o. What is the company’s return on total assets for Year 2?
p. What is the company’s return on equity for Year 2?
13–593
13–594
257.
Hyrkas Corporation’s most recent balance sheet and income statement appear below:
Balance Sheet
December 31, Year 2 and Year 1
(in thousands of dollars)
Assets
Year 2
Year 1
Current assets:
Cash
$150
$190
Accounts receivable
220
240
Inventory
190
160
Prepaid expenses
20
20
Total current assets
580
610
Plant and equipment, net
760
740
Total assets
$1,340
$1,350
Liabilities and Stockholders’ Equity
Current liabilities:
Accounts payable
$160
$190
Accrued liabilities
50
50
Notes payable, short term
40
40
Total current liabilities
250
280
Bonds payable
150
180
Total liabilities
400
460
Stockholders’ equity:
Common stock, $2 par value
200
200
Additional paid-in capital-common stock
330
330
Retained earnings
410
360
Total stockholders’ equity
940
890
Total liabilities & stockholders’ equity
$1,340
$1,350
Income Statement
For the Year Ended December 31,
Year 2
13–595
(in thousands of dollars)
Sales (all on account)
$1,200
Cost of goods sold
730
Gross margin
470
Selling and administrative
expense
335
Net operating income
135
Interest expense
21
Net income before taxes
114
Income taxes (30%)
34
Net income
$80
Dividends on common stock during Year 2 totaled $30 thousand. The market price of
common stock at the end of Year 2 was $6.90 per share.
Required:
Compute the following for Year 2:
a. Gross margin percentage.
b. Earnings per share.
c. Price-earnings ratio.
d. Dividend payout ratio.
e. Dividend yield ratio.
f. Return on total assets.
g. Return on equity.
h. Book value per share.
i. Working capital.
j. Current ratio.
k. Acid-test ratio.
l. Accounts receivable turnover.
m. Average collection period.
n. Inventory turnover.
o. Average sale period.
p. Times interest earned.
q. Debt-to-equity ratio.
13–598
258.
Kisselburg Corporation has provided the following financial data:
Balance Sheet
December 31, Year 2 and Year 1
Assets
Year 2
Year 1
Current assets:
Cash
$243,000
$180,000
Accounts receivable
123,000
120,000
Inventory
106,000
110,000
Prepaid expenses
41,000
50,000
Total current assets
513,000
460,000
Plant and equipment, net
663,000
700,000
Total assets
$1,176,000
$1,160,000
Liabilities and Stockholders’ Equity
Current liabilities:
Accounts payable
$96,000
$110,000
Accrued liabilities
44,000
50,000
Notes payable, short term
93,000
90,000
Total current liabilities
233,000
250,000
Bonds payable
260,000
260,000
Total liabilities
493,000
510,000
Stockholders’ equity:
Common stock, $2 par value
160,000
160,000
Additional paid-in capital-common stock
50,000
50,000
Retained earnings
473,000
440,000
Total stockholders’ equity
683,000
650,000
Total liabilities & stockholders’ equity
$1,176,000
$1,160,000
Income Statement
For the Year Ended December 31, Year 2
Sales (all on account)
$1,360,000
Cost of goods sold
800,000
13–599
Gross margin
560,000
Operating expenses
482,077
Net operating income
77,923
Interest expense
21,000
Net income before taxes
56,923
Income taxes (35%)
19,923
Net income
$37,000
Dividends on common stock during Year 2 totaled $4,000. The market price of common
stock at the end of Year 2 was $5.75 per share.
Required:
a. What is the company’s working capital at the end of Year 2?
b. What is the company’s current ratio at the end of Year 2?
c. What is the company’s acid-test (quick) ratio at the end of Year 2?
d. What is the company’s accounts receivable turnover for Year 2?
e. What is the company’s average collection period (age of receivables) for Year 2?
f. What is the company’s inventory turnover for Year 2?
g. What is the company’s average sale period (turnover in days) for Year 2?
h. What is the company’s operating cycle for Year 2?
i. What is the company’s total asset turnover for Year 2?
j. What is the company’s times interest earned for Year 2?
k. What is the company’s debt–to-equity ratio at the end of Year 2?
l. What is the company’s equity multiplier at the end of Year 2?
m. What is the company’s net profit margin percentage for Year 2?
n. What is the company’s gross margin percentage for Year 2?
o. What is the company’s return on total assets for Year 2?
p. What is the company’s return on equity for Year 2?
q. What is the company’s earnings per share for Year 2?
r. What is the company’s price-earnings ratio for Year 2?
s. What is the company’s dividend payout ratio for Year 2?
t. What is the company’s dividend yield ratio for Year 2?
u. What is the company’s book value per share at the end of Year 2?
13–602
13–603
259.
M. K. Berry is the managing director of CE Ltd. a small, family-owned company which
manufactures cutlery. His company belongs to a trade association which publishes a
monthly magazine. The latest issue of the magazine contains a very brief article based on
the analysis of the accounting statements published by the 40 companies which
manufacture this type of product. The article contains the following table:
Average for all
companies in the industry
Return on equity
33%
Return on total assets
29%
Gross margin percentage
30%
Current ratio
1.9:1
Average sale period
37 days
Average collection period
41 days
CE Ltd’s latest financial statements are as follows:
CE Ltd.
Income Statement
for the year ended 31 October
(in thousands)
Sales
£900
Cost of goods sold
720
Gross margin
180
Selling and administrative expenses
55
Interest
15
Net income
£110
The country in which the company operates has no corporate income tax. No dividends
were paid during the year. All sales are on account.
CE Ltd.
Balance Sheets
as of 31 October
13–604
(in thousands)
This Year
Last Year
Current assets:
Cash
£5
£20
Accounts receivable
120
110
Inventories
96
80
Noncurrent assets
500
460
Total assets
£721
£670
Current liabilities:
Accounts payable
£147
£206
Noncurrent liabilities:
Bonds payable
150
150
Common stock
100
100
Retained earnings
324
214
Total liabilities and stockholders’ equity
£721
£670
Required:
a. Calculate each of the ratios listed in the magazine article for this year for CE, and
comment briefly on CE Ltd’s performance in comparison to the industrial averages.
b. Explain why it could be misleading to compare CE Ltd’s ratios with those taken from
the article.