
13-282
254. Two-Rivers Inc. (TRI) manufactures a variety of consumer products. The company’s
founders have run the company for thirty years and are now interested in retiring. Consequently,
they are seeking a purchaser, and a group of investors is looking into the acquisition of TRI. To
evaluate its financial stability, TRI was requested to provide its latest financial statements and
selected financial ratios. Summary information provided by TRI is presented below.
TRI
Statement of Income
For the Year Ended November 30, Year 2
(In thousands)
Sales (net) $31,000
Costs and expenses:
Cost of goods sold 17,600
Selling and administrative expense 3,550
Depreciation and amortization expense 1,890
Interest expense 900
Total costs and expenses 23,940
Income before taxes 7,060
Income taxes 2,900
Net Income $4,160
TRI
Balance Sheet
As of November 30
(in thousands)
Year 2 Year 1
Cash $400 $500
Marketable securities (at cost) 500 200
Accounts receivable (net) 3,200 2,900
Inventory 5,800 5,400
Total current assets 9,900 9,000
Property, plant, & equipment (net) 7,100 7,000
Total assets $17,000 $16,000
Accounts payable $3,700 $3,400
Income taxes payable 900 800
Accrued expenses 1,700 1,400
Total current liabilities 6,300 5,600
Long-term debt 2,000 1,800
Total liabilities 8,300 7,400
Common stock ($1 par value) 2,700 2,700

13-283
Paid-in capital in excess of par 1,000 1,000
Retained earnings 5,000 4,900
Total stockholders’ equity 8,700 8,600
Total liabilities and stockholders’ equity $17,000 $16,000
Selected Financial Ratios
TRI TRI Industry
Year 1 Year 0 Average
Current ratio 1.62 1.61 1.63
Acid–test ratio 0.63 0.64 0.68
Times interest earned 8.50 8.55 8.45
Debt to equity 1.02 0.94 1.03
Inventory turnover 3.21 3.17 3.18
Required:
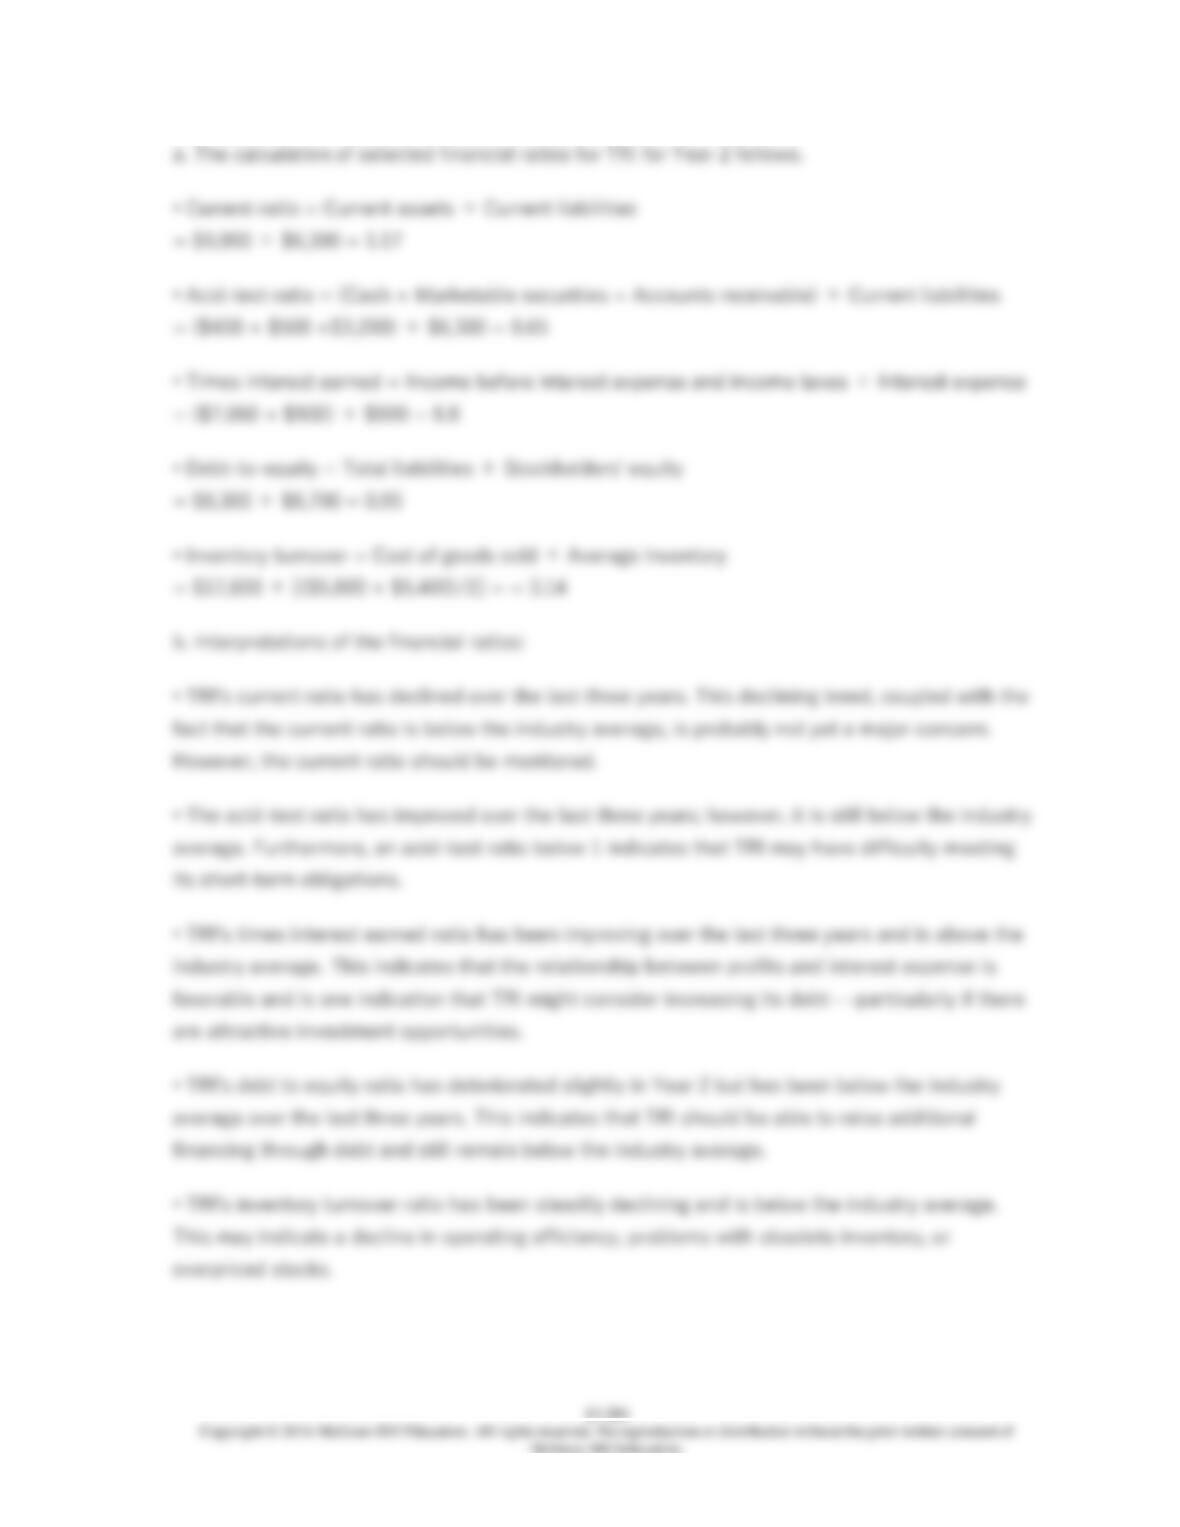
a. Calculate the select financial ratios for the fiscal year Year 2.
b. Interpret what each of these financial ratios means in terms of TRI’s financial stability and
operating efficiency.

13-286
255. Financial statements for Praeger Corporation appear below:
Praeger Corporation
Balance Sheet
December 31, Year 2 and Year 1
(dollars in thousands)
Year 2 Year 1
Current assets:
Cash and marketable securities $100 $100
Accounts receivable, net 170 170
Inventory 110 110
Prepaid expenses 60 60
Total current assets 440 440
Noncurrent assets:
Plant & equipment, net 2,020 1,990
Total assets $2,460 $2,430
Current liabilities:
Accounts payable $140 $170
Accrued liabilities 70 50
Notes payable, short term 100 120
Total current liabilities 310 340
Noncurrent liabilities:
Bonds payable 500 500
Total liabilities 810 840
Stockholders’ equity:
Common stock, $5 par 200 200
Additional paid-in capital-common stock 300 300
Retained earnings 1,150 1,090
Total stockholders’ equity 1,650 1,590
Total liabilities & stockholders’ equity $2,460 $2,430
Praeger Corporation
Income Statement
For the Year Ended December 31, Year 2
(dollars in thousands)
Sales (all on account) $1,100
Cost of goods sold 770
Gross margin 330
Selling and administrative expense 130

13-287
Net operating income 200
Interest expense 50
Net income before taxes 150
Income taxes (30%) 45
Net income $105
Dividends during Year 2 totaled $45 thousand. The market price of a share of common stock on
December 31, Year 2 was $30.
Required:
Compute the following for Year 2:
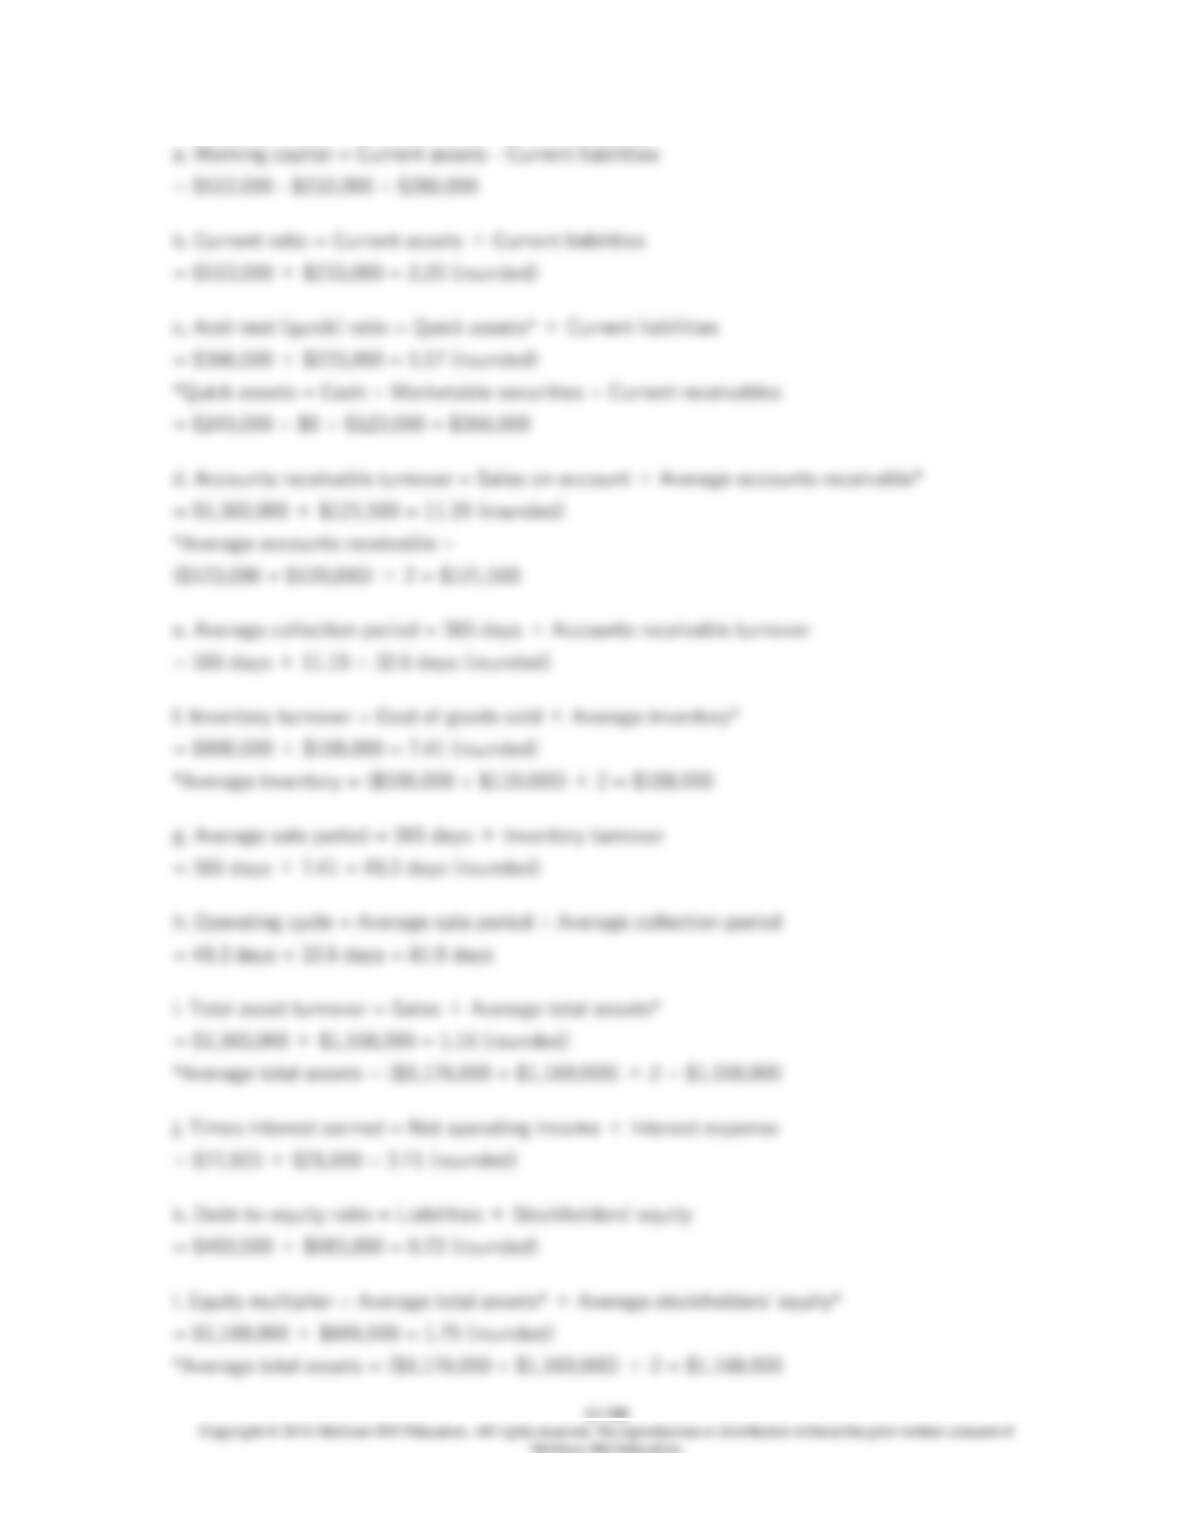
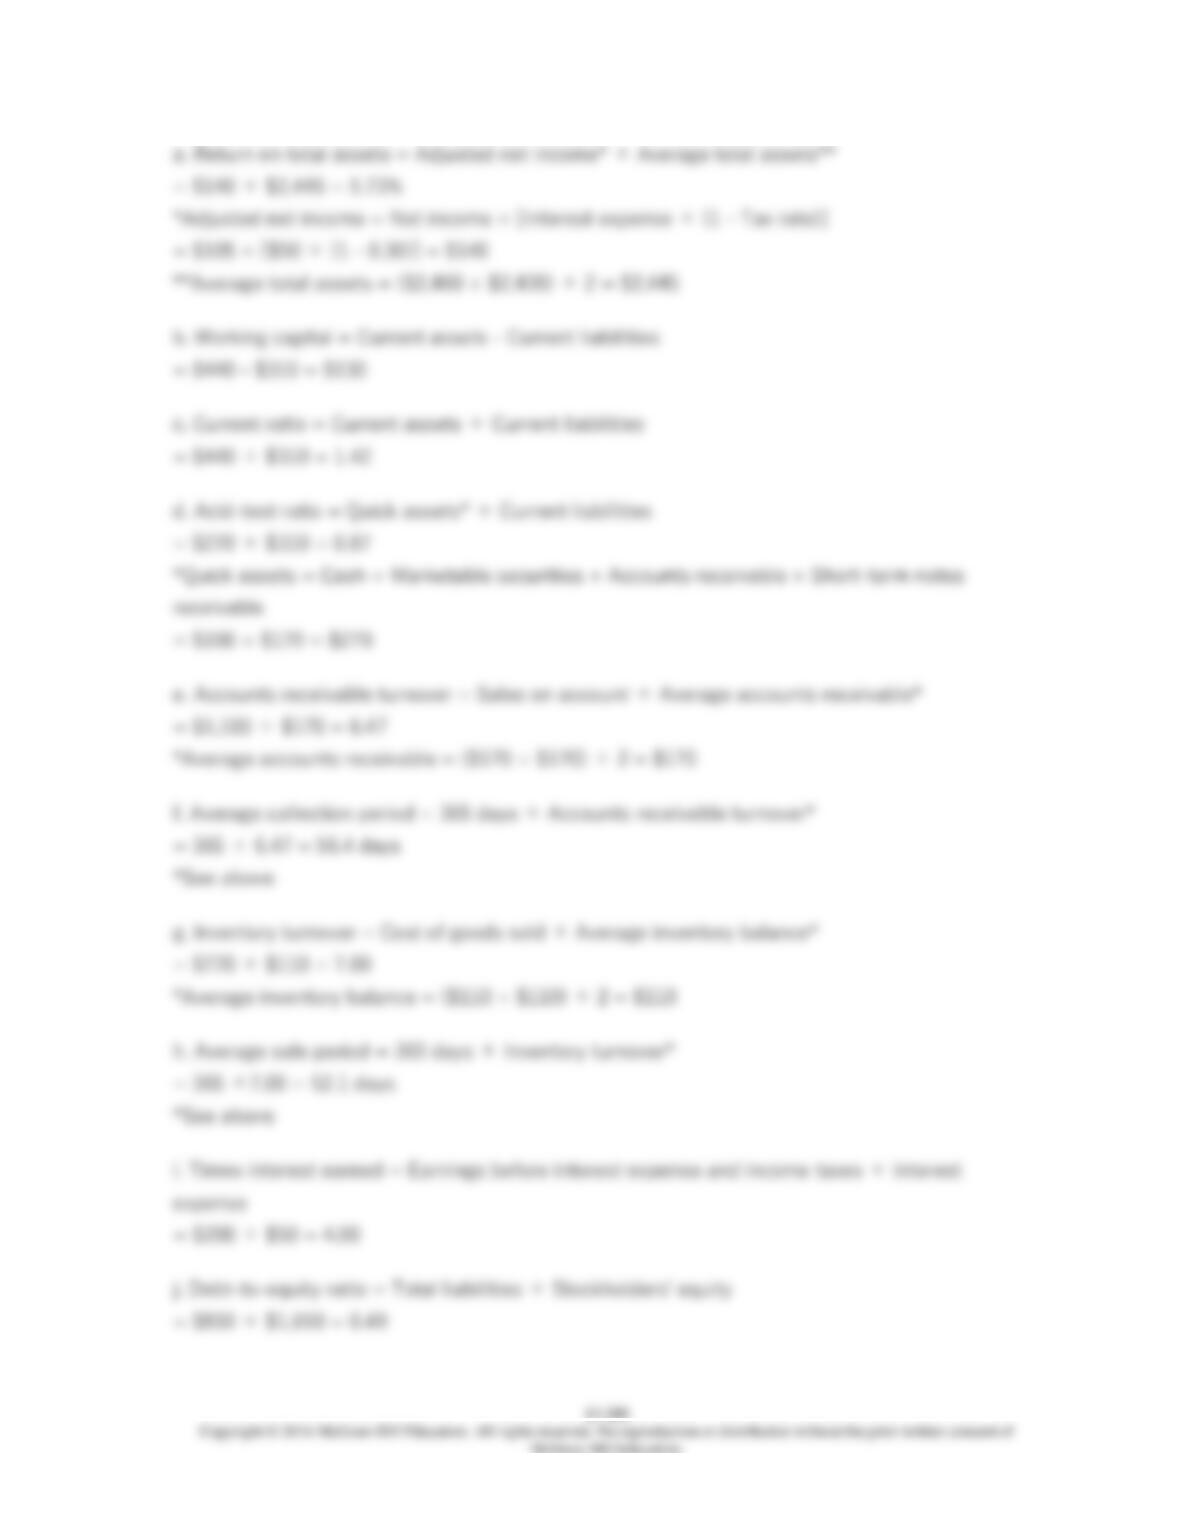
a. Return on total assets.
b. Working capital.
c. Current ratio.
d. Acid-test ratio.
e. Accounts receivable turnover.
f. Average collection period.
g. Inventory turnover.
h. Average sale period.
i. Times interest earned.
j. Debt-to-equity ratio.

13-290
256. Kaloi Corporation has provided the following financial data:
Balance Sheet
December 31, Year 2 and Year 1
Assets Year 2 Year 1
Current assets:
Cash $205,000 $190,000
Accounts receivable 192,000 200,000
Inventory 118,000 130,000
Prepaid expenses 41,000 40,000
Total current assets 556,000 560,000
Plant and equipment, net 813,000 770,000
Total assets $1,369,000 $1,330,000
Liabilities and Stockholders’ Equity
Current liabilities:
Accounts payable $115,000 $100,000
Accrued liabilities 27,000 30,000
Notes payable, short term 55,000 60,000
Total current liabilities 197,000 190,000
Bonds payable 130,000 130,000
Total liabilities 327,000 320,000
Stockholders’ equity:
Common stock, $2 par value 100,000 100,000
Additional paid-in capital-common stock 60,000 60,000
Retained earnings 882,000 850,000
Total stockholders’ equity 1,042,000 1,010,000
Total liabilities & stockholders’ equity $1,369,000 $1,330,000
Income Statement
For the Year Ended December 31, Year 2
Sales (all on account) $1,370,000
Cost of goods sold 830,000
Gross margin 540,000
Operating expenses 478,286
Net operating income 61,714
Interest expense 11,000
Net income before taxes 50,714
Income taxes (30%) 15,214
Net income $35,500

13-291
Dividends on common stock during Year 2 totaled $3,500. The market price of common stock at
the end of Year 2 was $7.46 per share.
Required:
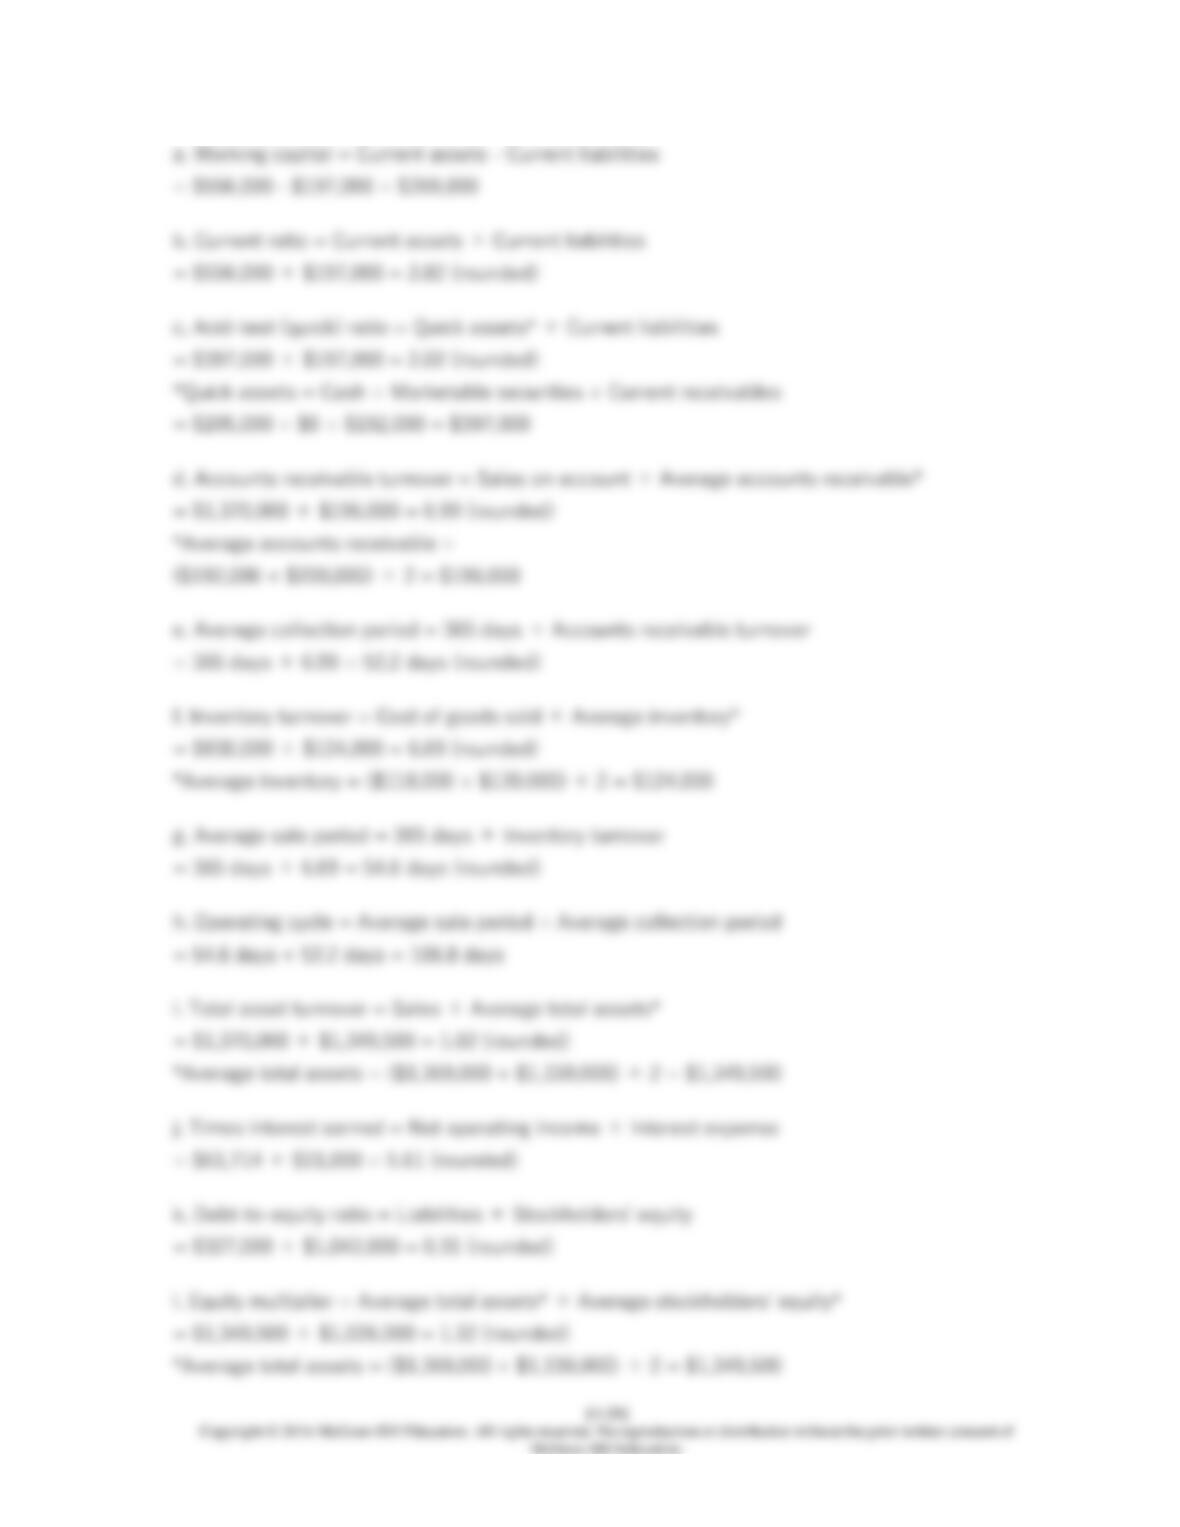
a. What is the company’s working capital at the end of Year 2?
b. What is the company’s current ratio at the end of Year 2?
c. What is the company’s acid-test (quick) ratio at the end of Year 2?
d. What is the company’s accounts receivable turnover for Year 2?
e. What is the company’s average collection period (age of receivables) for Year 2?
f. What is the company’s inventory turnover for Year 2?
g. What is the company’s average sale period (turnover in days) for Year 2?
h. What is the company’s operating cycle for Year 2?
i. What is the company’s total asset turnover for Year 2?
j. What is the company’s times interest earned for Year 2?
k. What is the company’s debt-to-equity ratio at the end of Year 2?
l. What is the company’s equity multiplier at the end of Year 2?
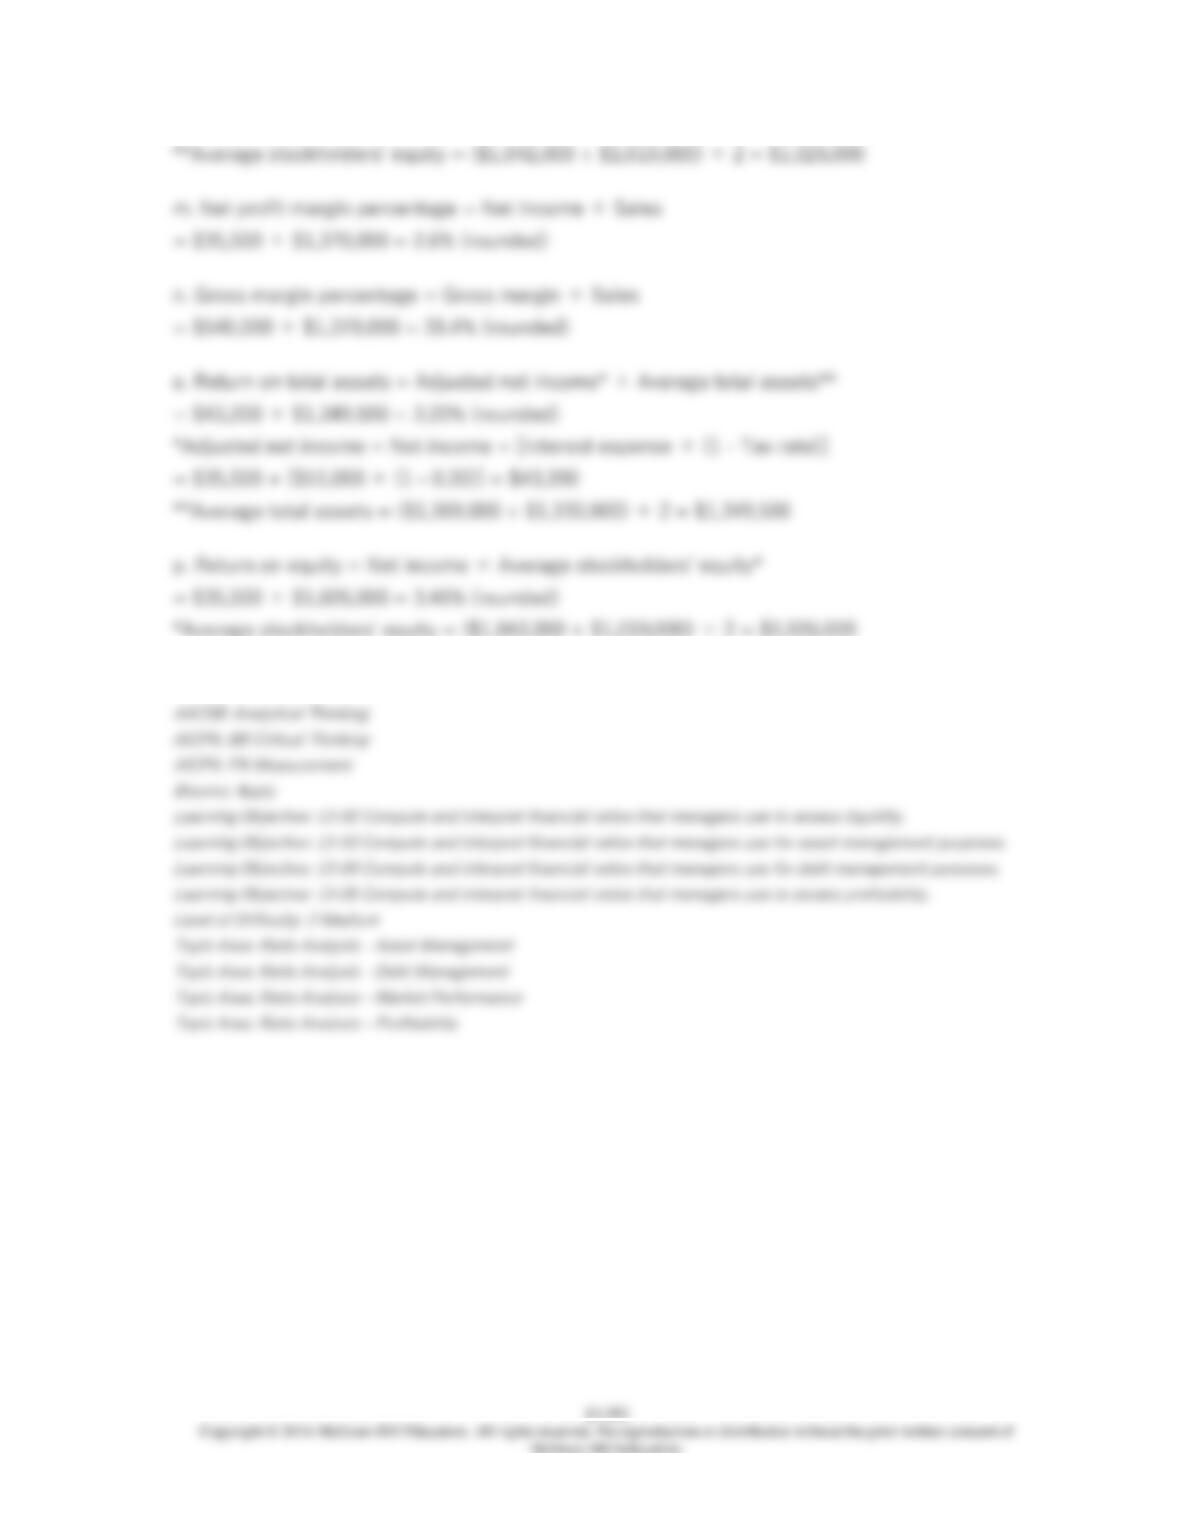
m. What is the company’s net profit margin percentage for Year 2?
n. What is the company’s gross margin percentage for Year 2?
o. What is the company’s return on total assets for Year 2?
p. What is the company’s return on equity for Year 2?

13-294
257. Hyrkas Corporation’s most recent balance sheet and income statement appear below:
Balance Sheet
December 31, Year 2 and Year 1
(in thousands of dollars)
Assets Year 2 Year 1
Current assets:
Cash $150 $190
Accounts receivable 220 240
Inventory 190 160
Prepaid expenses 20 20
Total current assets 580 610
Plant and equipment, net 760 740
Total assets $1,340 $1,350
Liabilities and Stockholders’ Equity
Current liabilities:
Accounts payable $160 $190
Accrued liabilities 50 50
Notes payable, short term 40 40
Total current liabilities 250 280
Bonds payable 150 180
Total liabilities 400 460
Stockholders’ equity:
Common stock, $2 par value 200 200
Additional paid-in capital-common stock 330 330
Retained earnings 410 360
Total stockholders’ equity 940 890
Total liabilities & stockholders’ equity $1,340 $1,350
Income Statement
For the Year Ended December 31, Year 2
(in thousands of dollars)
Sales (all on account) $1,200
Cost of goods sold 730
Gross margin 470
Selling and administrative expense 335
Net operating income 135
Interest expense 21
Net income before taxes 114

13-295
Income taxes (30%) 34
Net income $80
Dividends on common stock during Year 2 totaled $30 thousand. The market price of common
stock at the end of Year 2 was $6.90 per share.
Required:
Compute the following for Year 2:
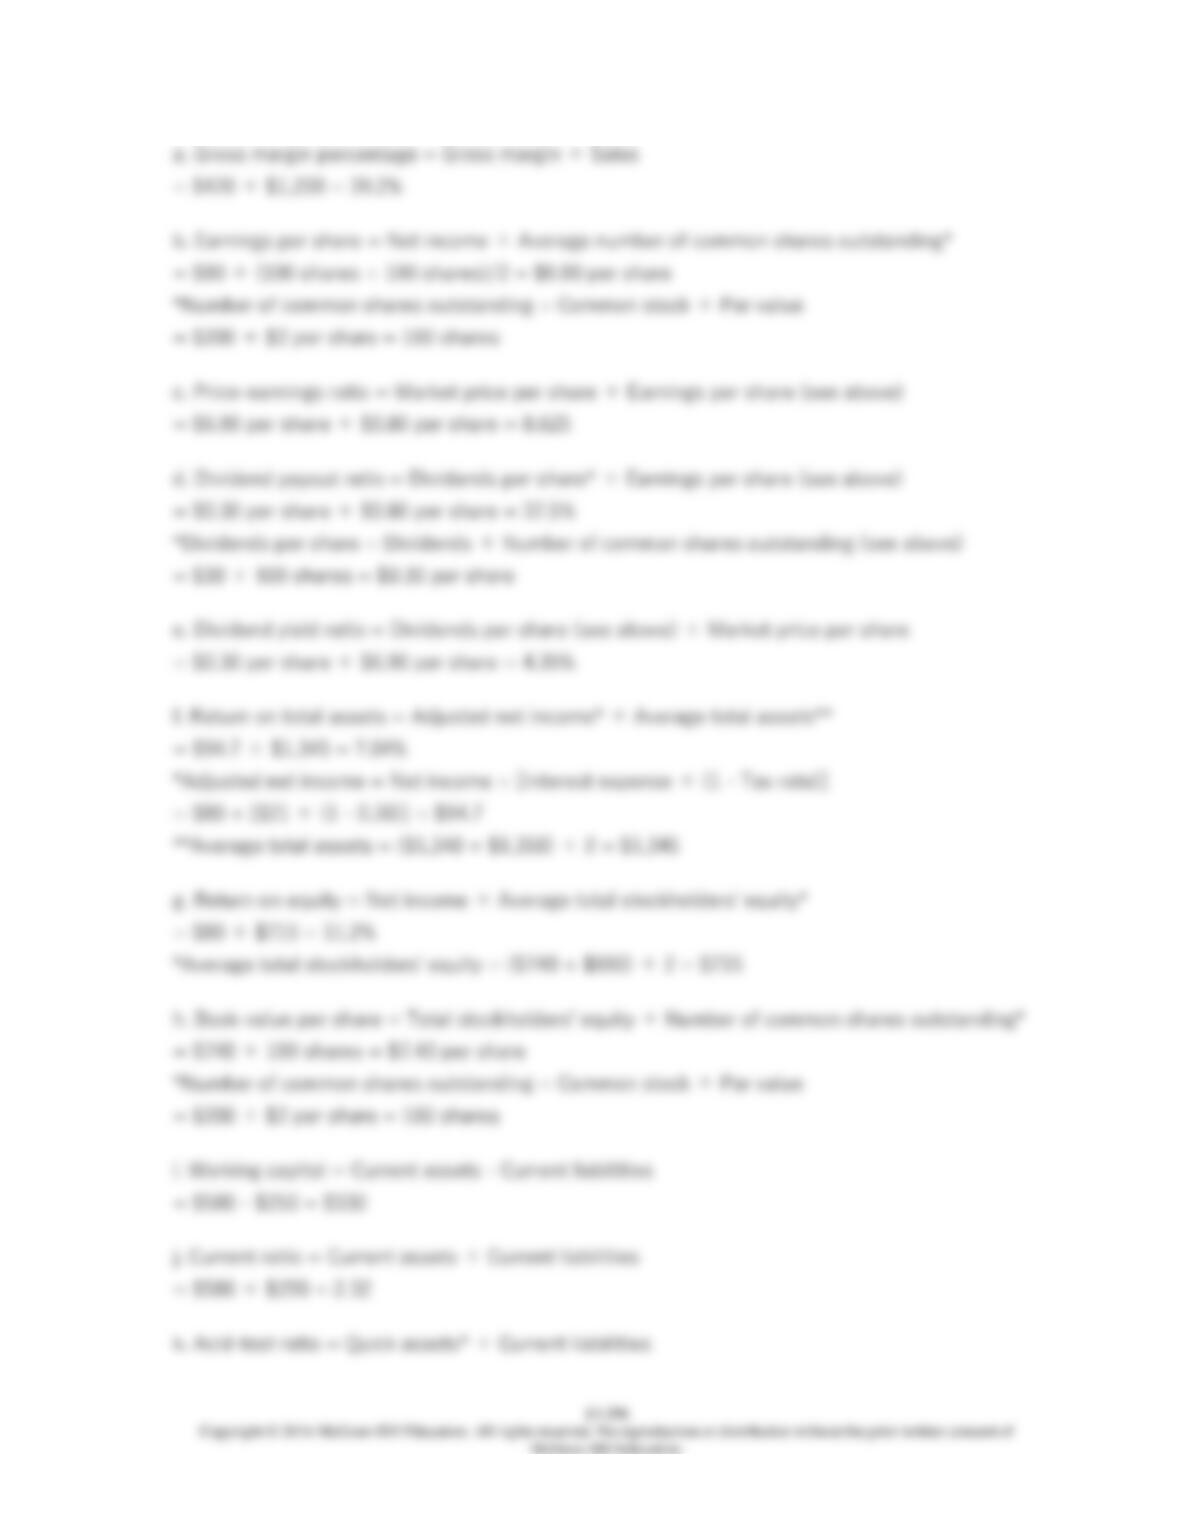
a. Gross margin percentage.
b. Earnings per share.
c. Price-earnings ratio.
d. Dividend payout ratio.
e. Dividend yield ratio.
f. Return on total assets.
g. Return on equity.
h. Book value per share.
i. Working capital.
j. Current ratio.
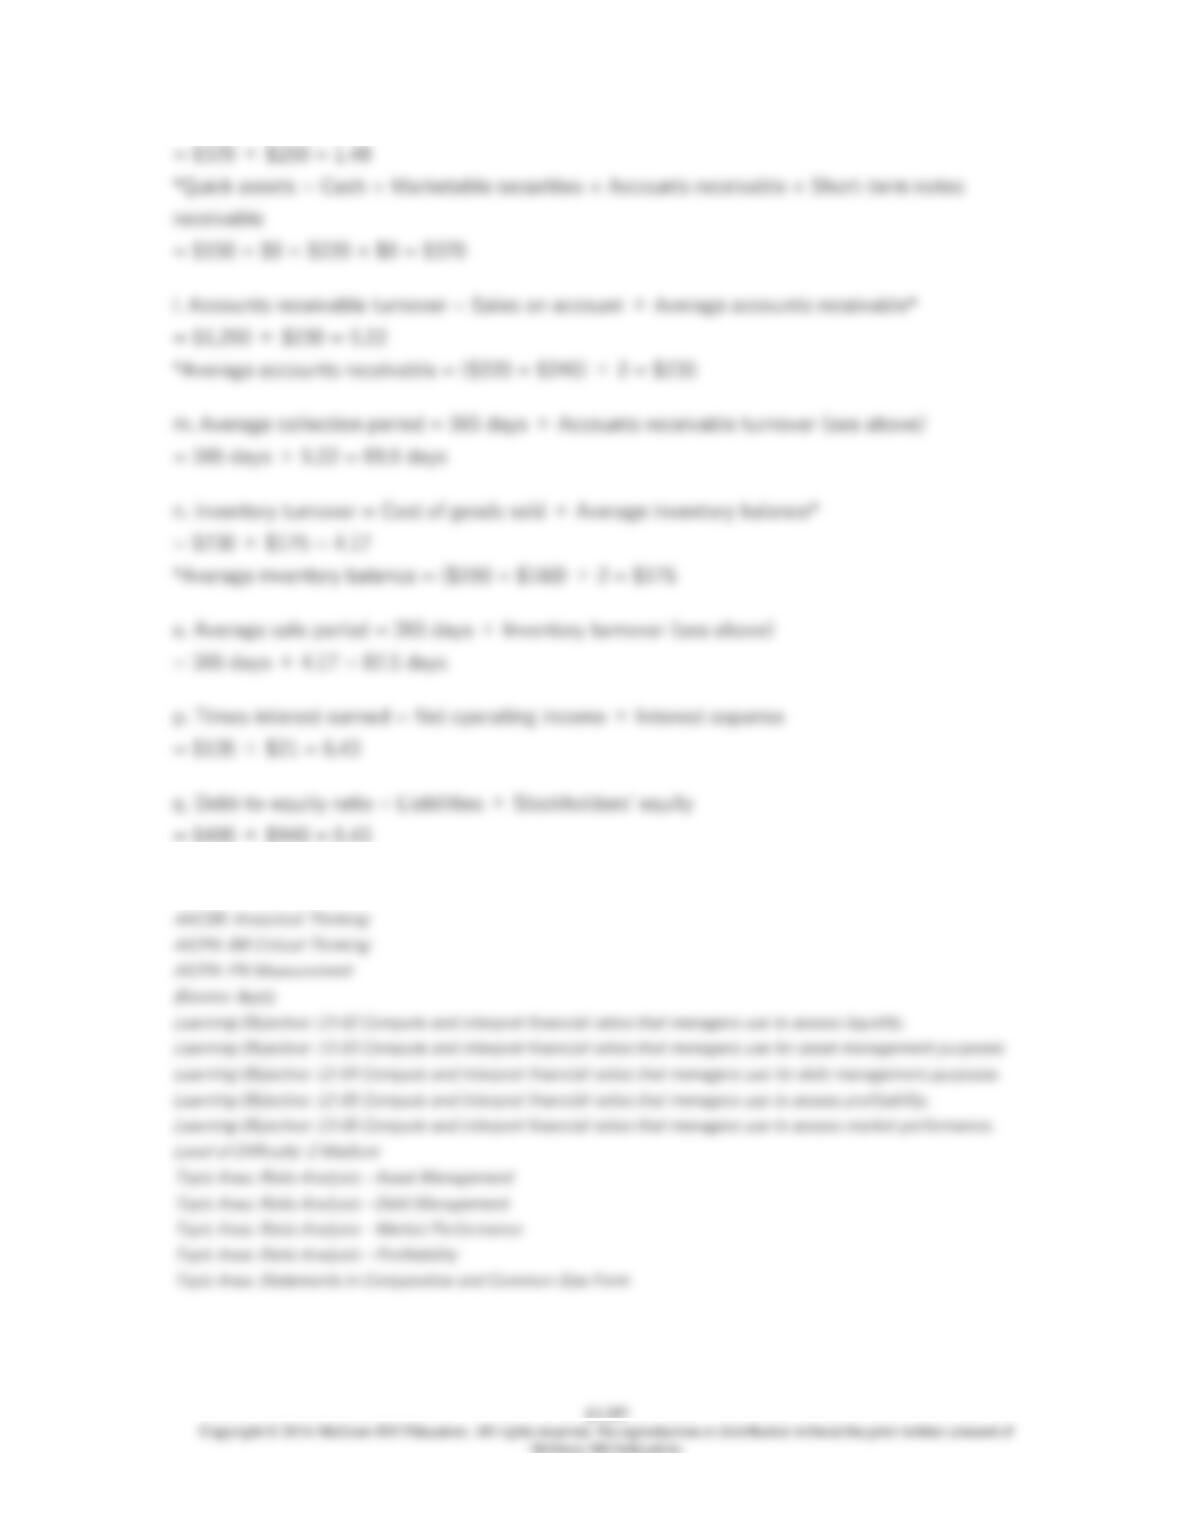
k. Acid-test ratio.
l. Accounts receivable turnover.
m. Average collection period.
n. Inventory turnover.
o. Average sale period.
p. Times interest earned.
q. Debt-to–equity ratio.

13-298
258. Kisselburg Corporation has provided the following financial data:
Balance Sheet
December 31, Year 2 and Year 1
Assets Year 2 Year 1
Current assets:
Cash $243,000 $180,000
Accounts receivable 123,000 120,000
Inventory 106,000 110,000
Prepaid expenses 41,000 50,000
Total current assets 513,000 460,000
Plant and equipment, net 663,000 700,000
Total assets $1,176,000 $1,160,000
Liabilities and Stockholders’ Equity
Current liabilities:
Accounts payable $96,000 $110,000
Accrued liabilities 44,000 50,000
Notes payable, short term 93,000 90,000
Total current liabilities 233,000 250,000
Bonds payable 260,000 260,000
Total liabilities 493,000 510,000
Stockholders’ equity:
Common stock, $2 par value 160,000 160,000
Additional paid-in capital-common stock 50,000 50,000
Retained earnings 473,000 440,000
Total stockholders’ equity 683,000 650,000
Total liabilities & stockholders’ equity $1,176,000 $1,160,000
Income Statement
For the Year Ended December 31, Year 2
Sales (all on account) $1,360,000
Cost of goods sold 800,000
Gross margin 560,000
Operating expenses 482,077
Net operating income 77,923
Interest expense 21,000
Net income before taxes 56,923
Income taxes (35%) 19,923
Net income $37,000

13-299
Dividends on common stock during Year 2 totaled $4,000. The market price of common stock at
the end of Year 2 was $5.75 per share.
Required:
a. What is the company’s working capital at the end of Year 2?
b. What is the company’s current ratio at the end of Year 2?
c. What is the company’s acid-test (quick) ratio at the end of Year 2?
d. What is the company’s accounts receivable turnover for Year 2?
e. What is the company’s average collection period (age of receivables) for Year 2?
f. What is the company’s inventory turnover for Year 2?
g. What is the company’s average sale period (turnover in days) for Year 2?
h. What is the company’s operating cycle for Year 2?
i. What is the company’s total asset turnover for Year 2?
j. What is the company’s times interest earned for Year 2?
k. What is the company’s debt-to-equity ratio at the end of Year 2?
l. What is the company’s equity multiplier at the end of Year 2?
m. What is the company’s net profit margin percentage for Year 2?
n. What is the company’s gross margin percentage for Year 2?
o. What is the company’s return on total assets for Year 2?
p. What is the company’s return on equity for Year 2?
q. What is the company’s earnings per share for Year 2?
r. What is the company’s price-earnings ratio for Year 2?
s. What is the company’s dividend payout ratio for Year 2?
t. What is the company’s dividend yield ratio for Year 2?
u. What is the company’s book value per share at the end of Year 2?