234.
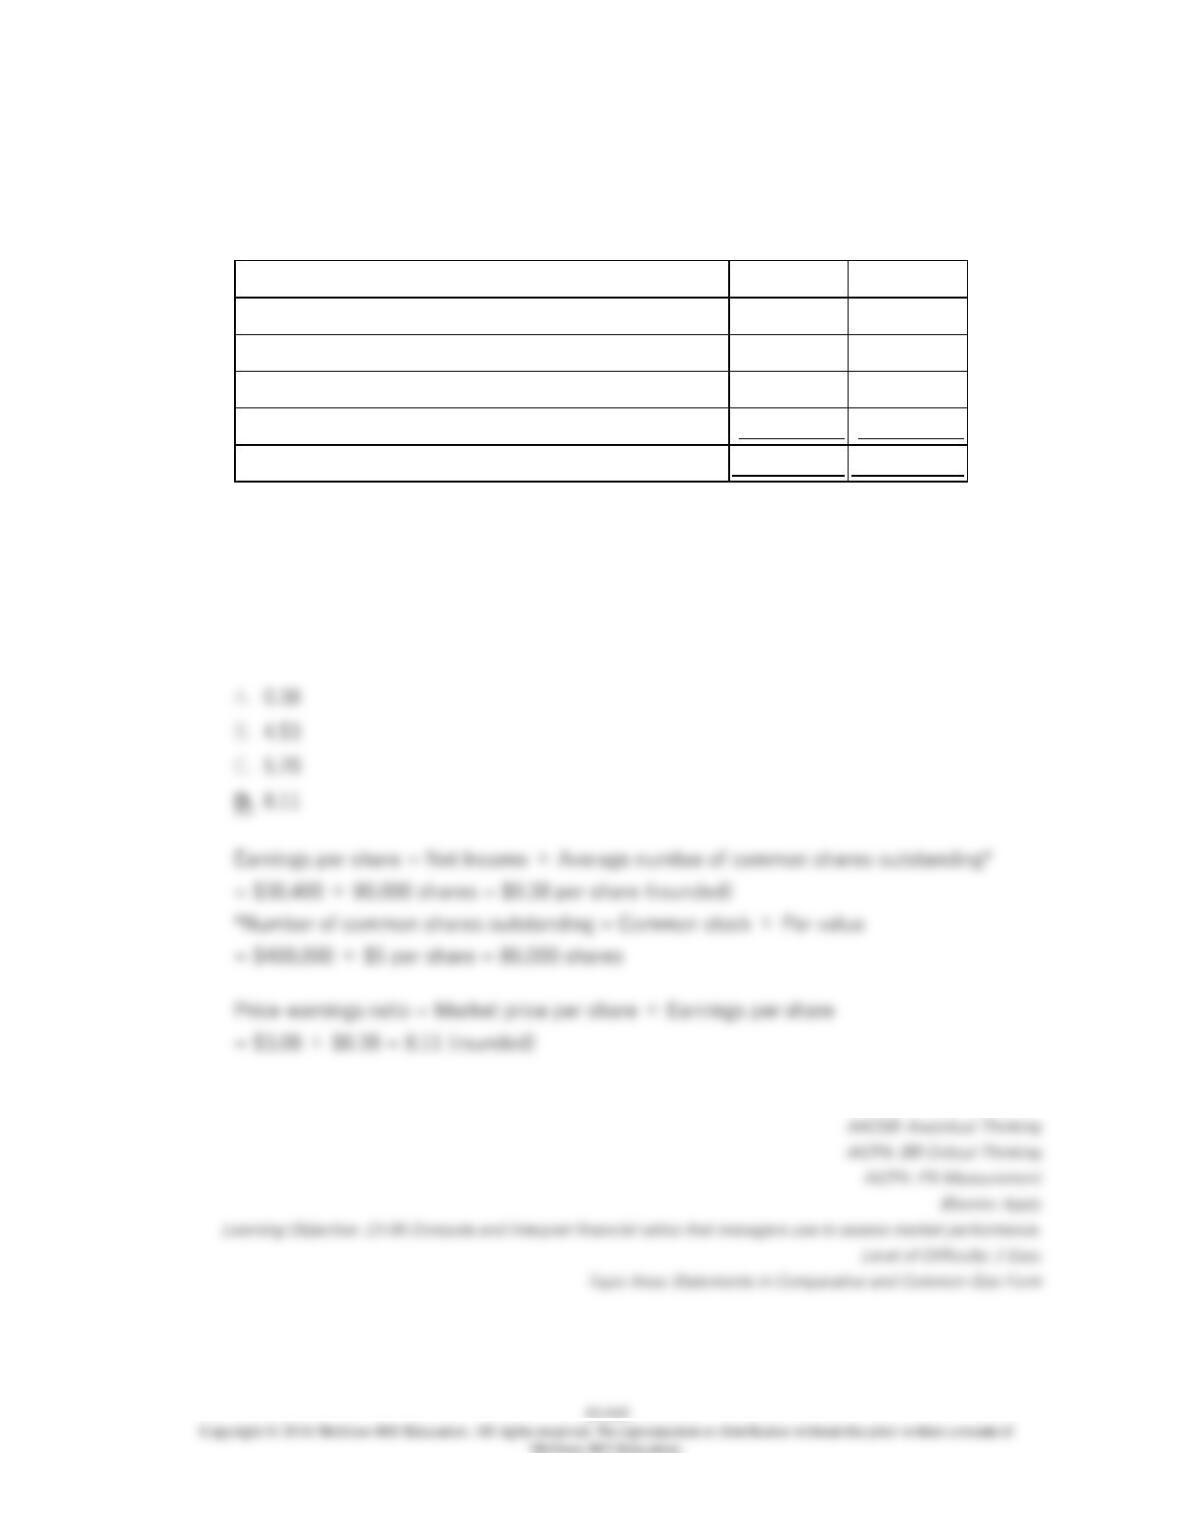
Sperle Corporation has provided the following data concerning its stockholders’ equity
accounts:
Year 2
Year 1
Stockholders’ equity:
Common stock, $5 par value
$400,000
$400,000
Additional paid-in capital-common stock
60,000
60,000
Retained earnings
654,000
630,000
Total stockholders’ equity
$1,114,000
$1,090,000
Net income for Year 2 was $30,400. Dividends on common stock during Year 2 totaled
$6,400. The market price of common stock at the end of Year 2 was $3.08 per share.
The company’s price-earnings ratio for Year 2 is closest to:
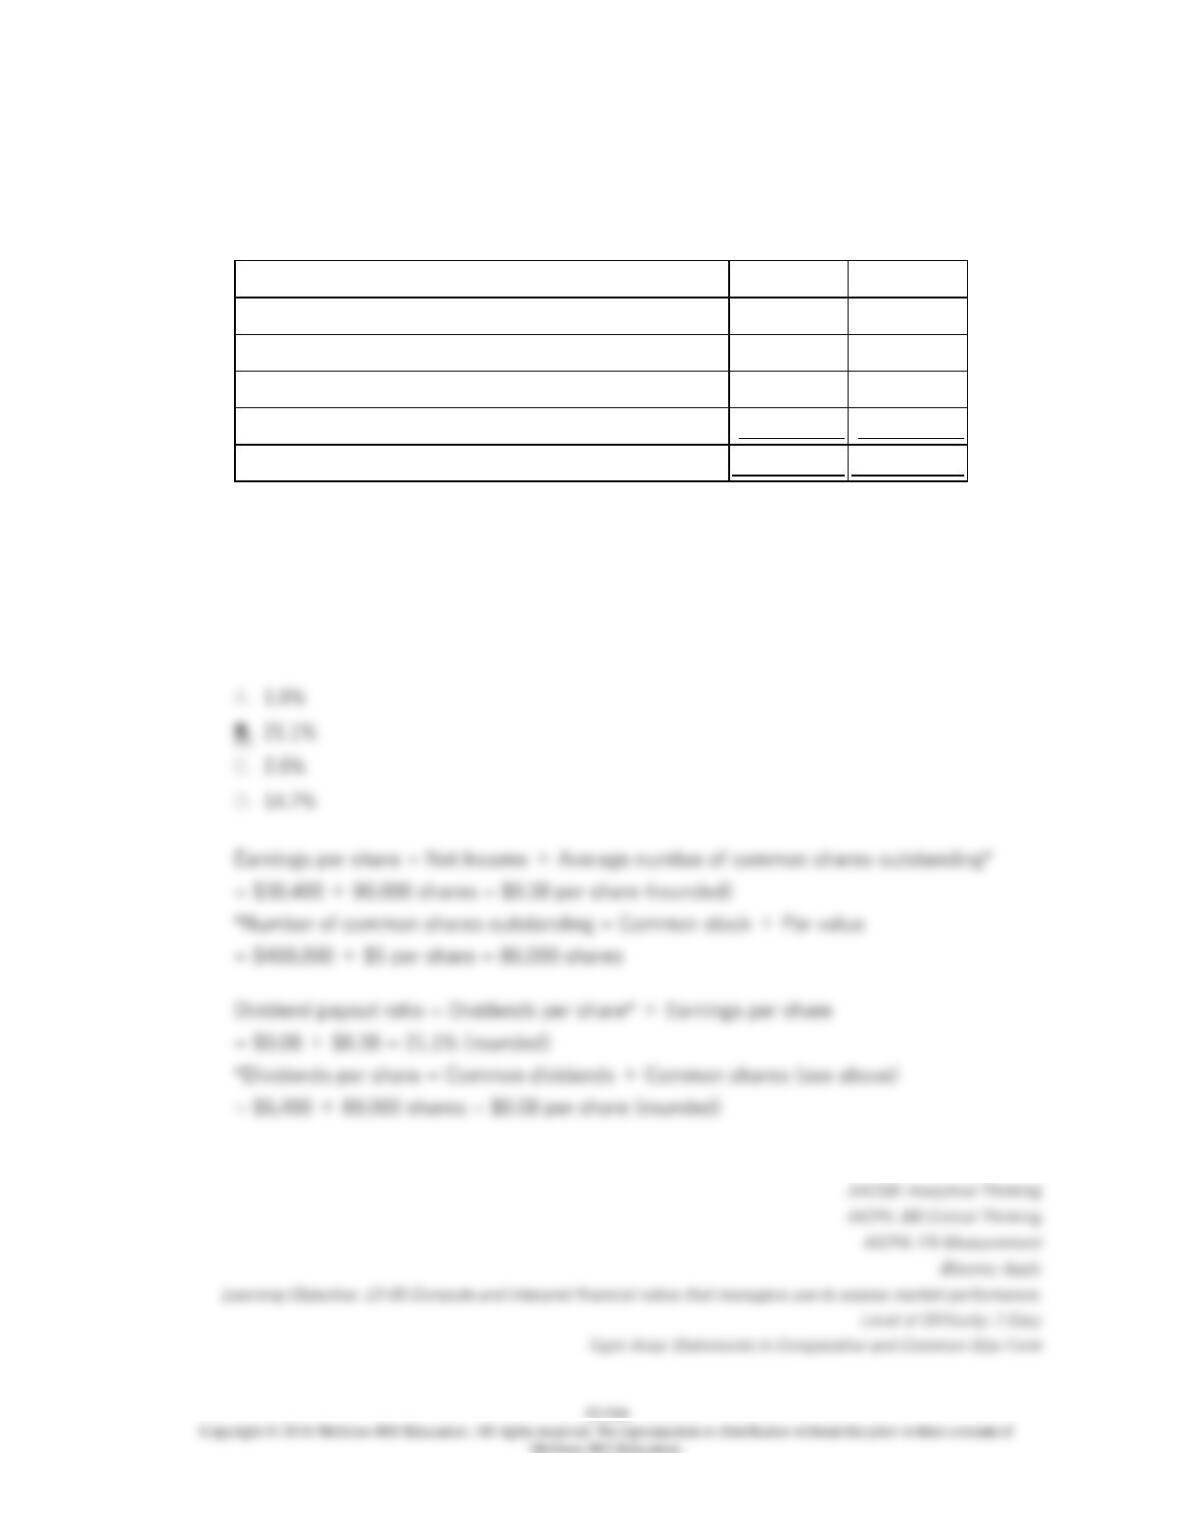
235.
Sperle Corporation has provided the following data concerning its stockholders’ equity
accounts:
Year 2
Year 1
Stockholders’ equity:
Common stock, $5 par value
$400,000
$400,000
Additional paid-in capital-common stock
60,000
60,000
Retained earnings
654,000
630,000
Total stockholders’ equity
$1,114,000
$1,090,000
Net income for Year 2 was $30,400. Dividends on common stock during Year 2 totaled
$6,400. The market price of common stock at the end of Year 2 was $3.08 per share.
The company’s dividend payout ratio for Year 2 is closest to:
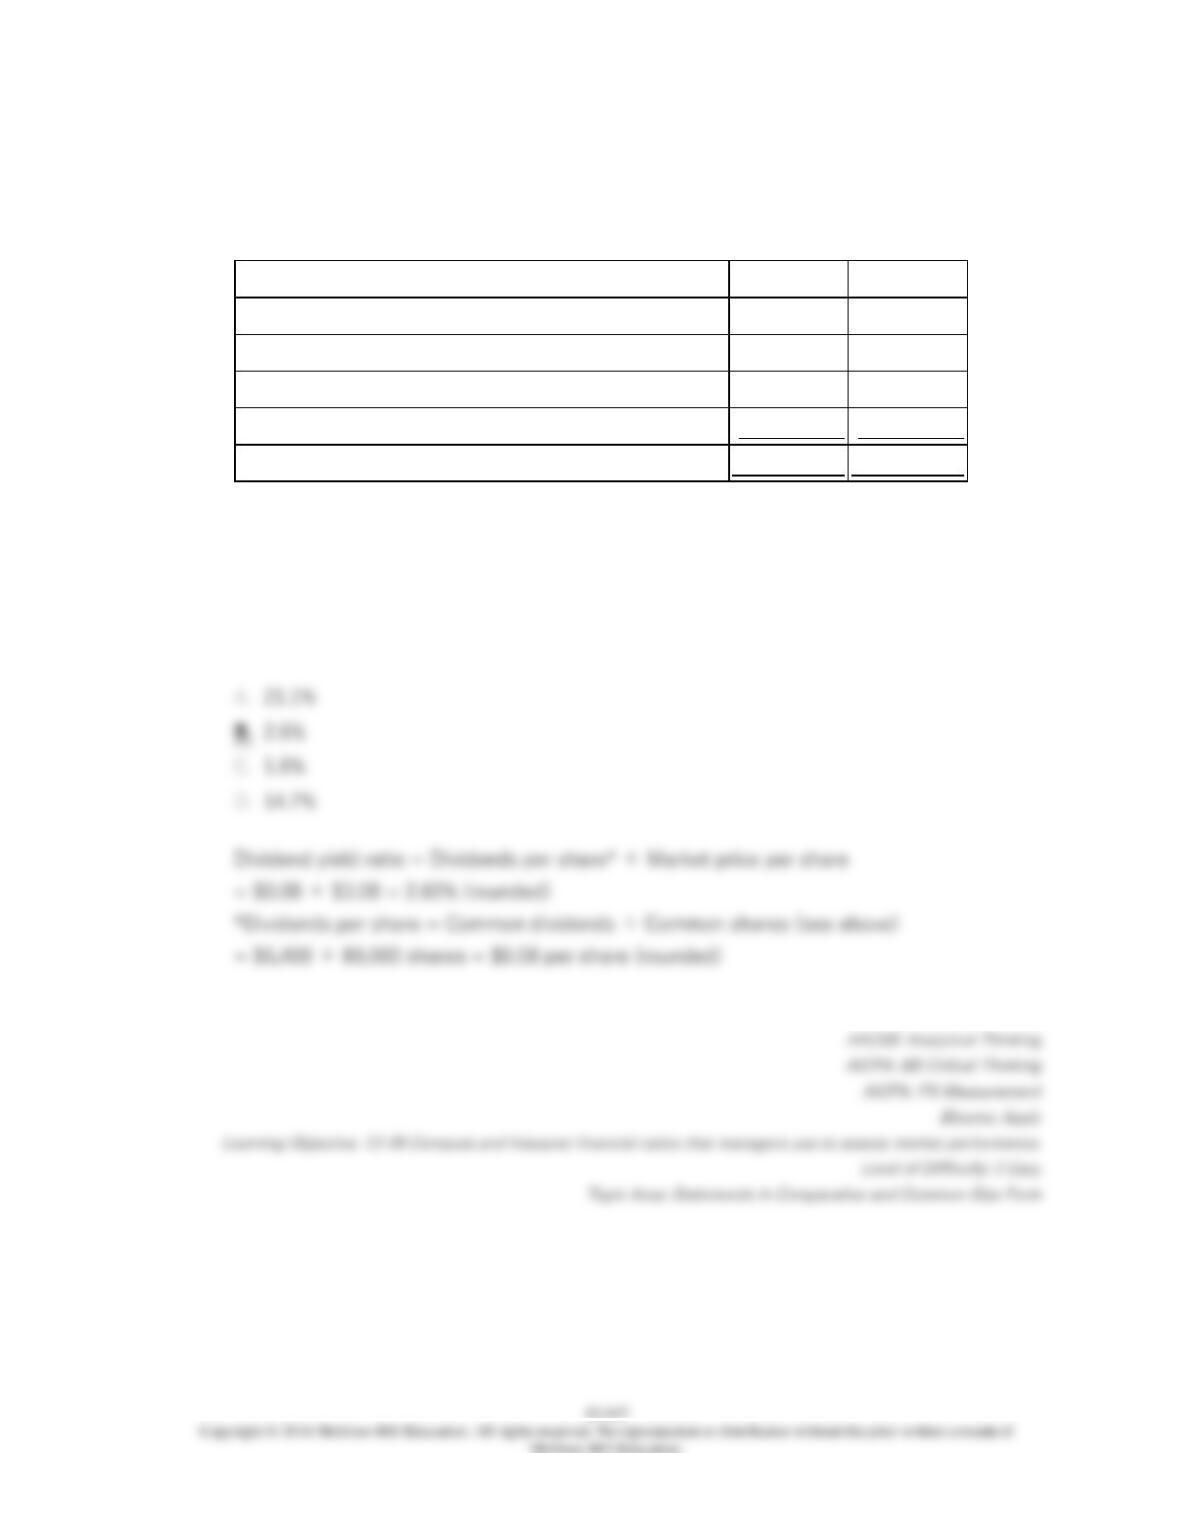
236.
Sperle Corporation has provided the following data concerning its stockholders’ equity
accounts:
Year 2
Year 1
Stockholders’ equity:
Common stock, $5 par value
$400,000
$400,000
Additional paid-in capital-common stock
60,000
60,000
Retained earnings
654,000
630,000
Total stockholders’ equity
$1,114,000
$1,090,000
Net income for Year 2 was $30,400. Dividends on common stock during Year 2 totaled
$6,400. The market price of common stock at the end of Year 2 was $3.08 per share.
The company’s dividend yield ratio for Year 2 is closest to:
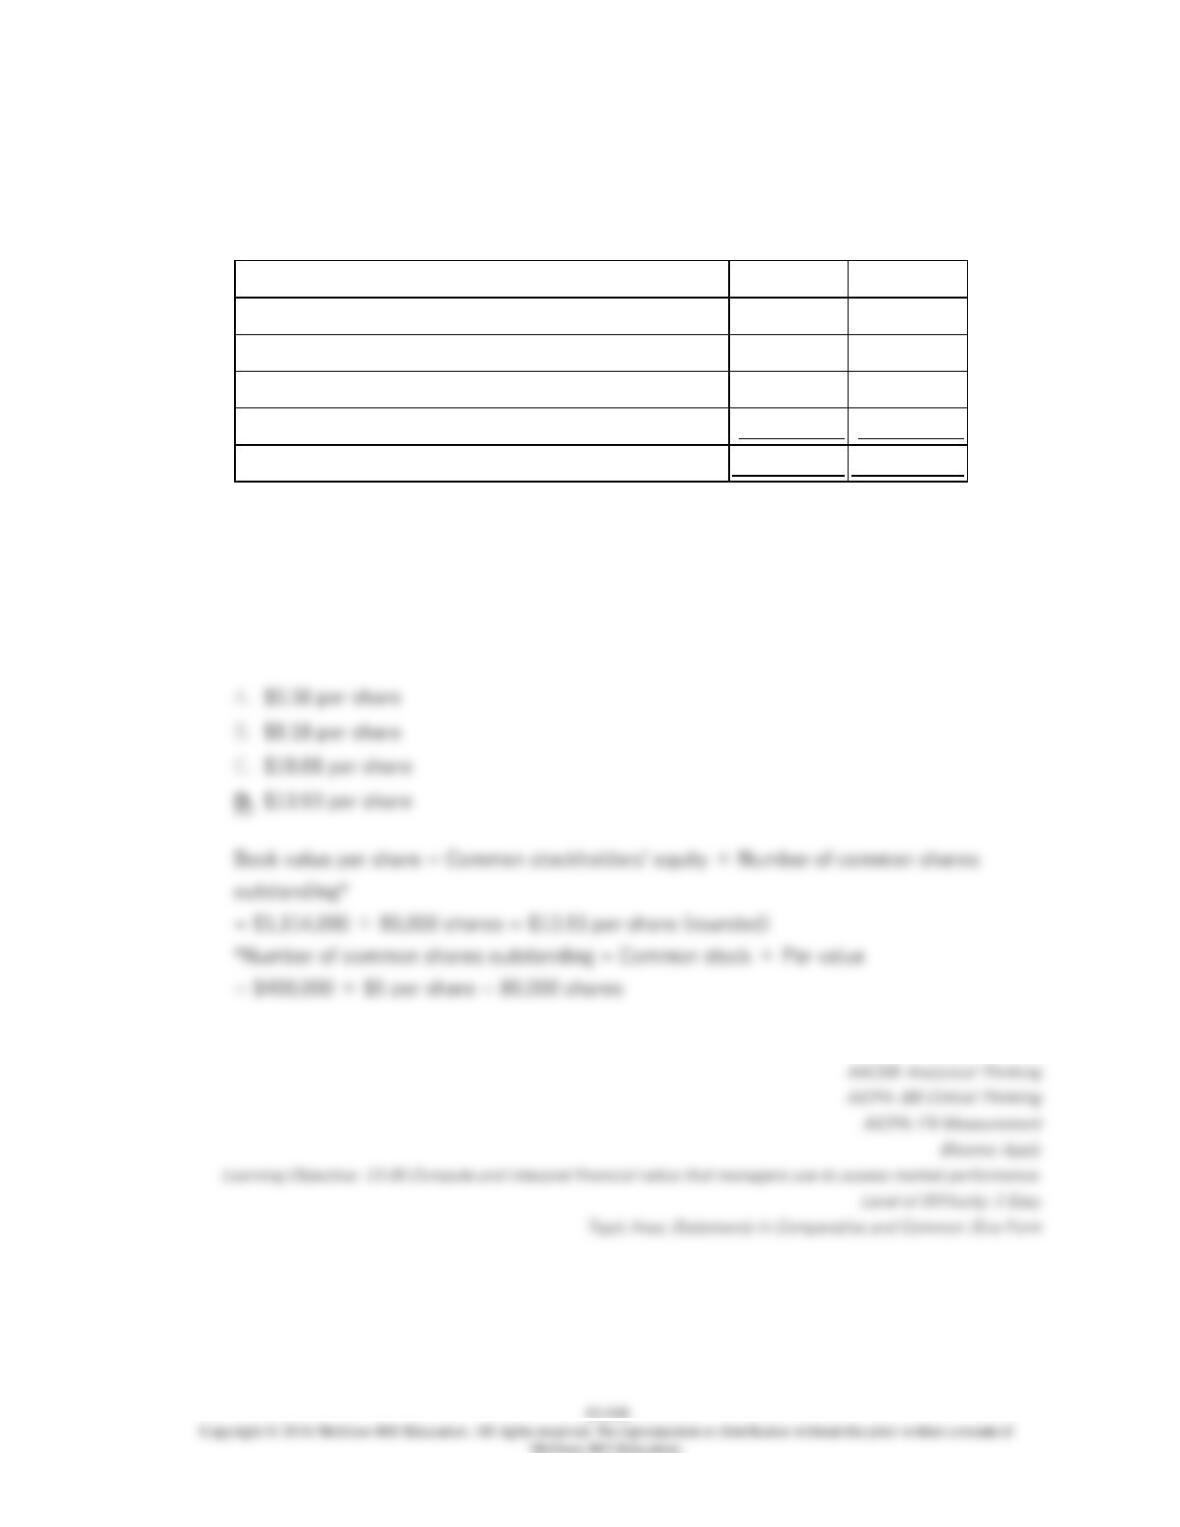
237.
Sperle Corporation has provided the following data concerning its stockholders’ equity
accounts:
Year 2
Year 1
Stockholders’ equity:
Common stock, $5 par value
$400,000
$400,000
Additional paid-in capital-common stock
60,000
60,000
Retained earnings
654,000
630,000
Total stockholders’ equity
$1,114,000
$1,090,000
Net income for Year 2 was $30,400. Dividends on common stock during Year 2 totaled
$6,400. The market price of common stock at the end of Year 2 was $3.08 per share.
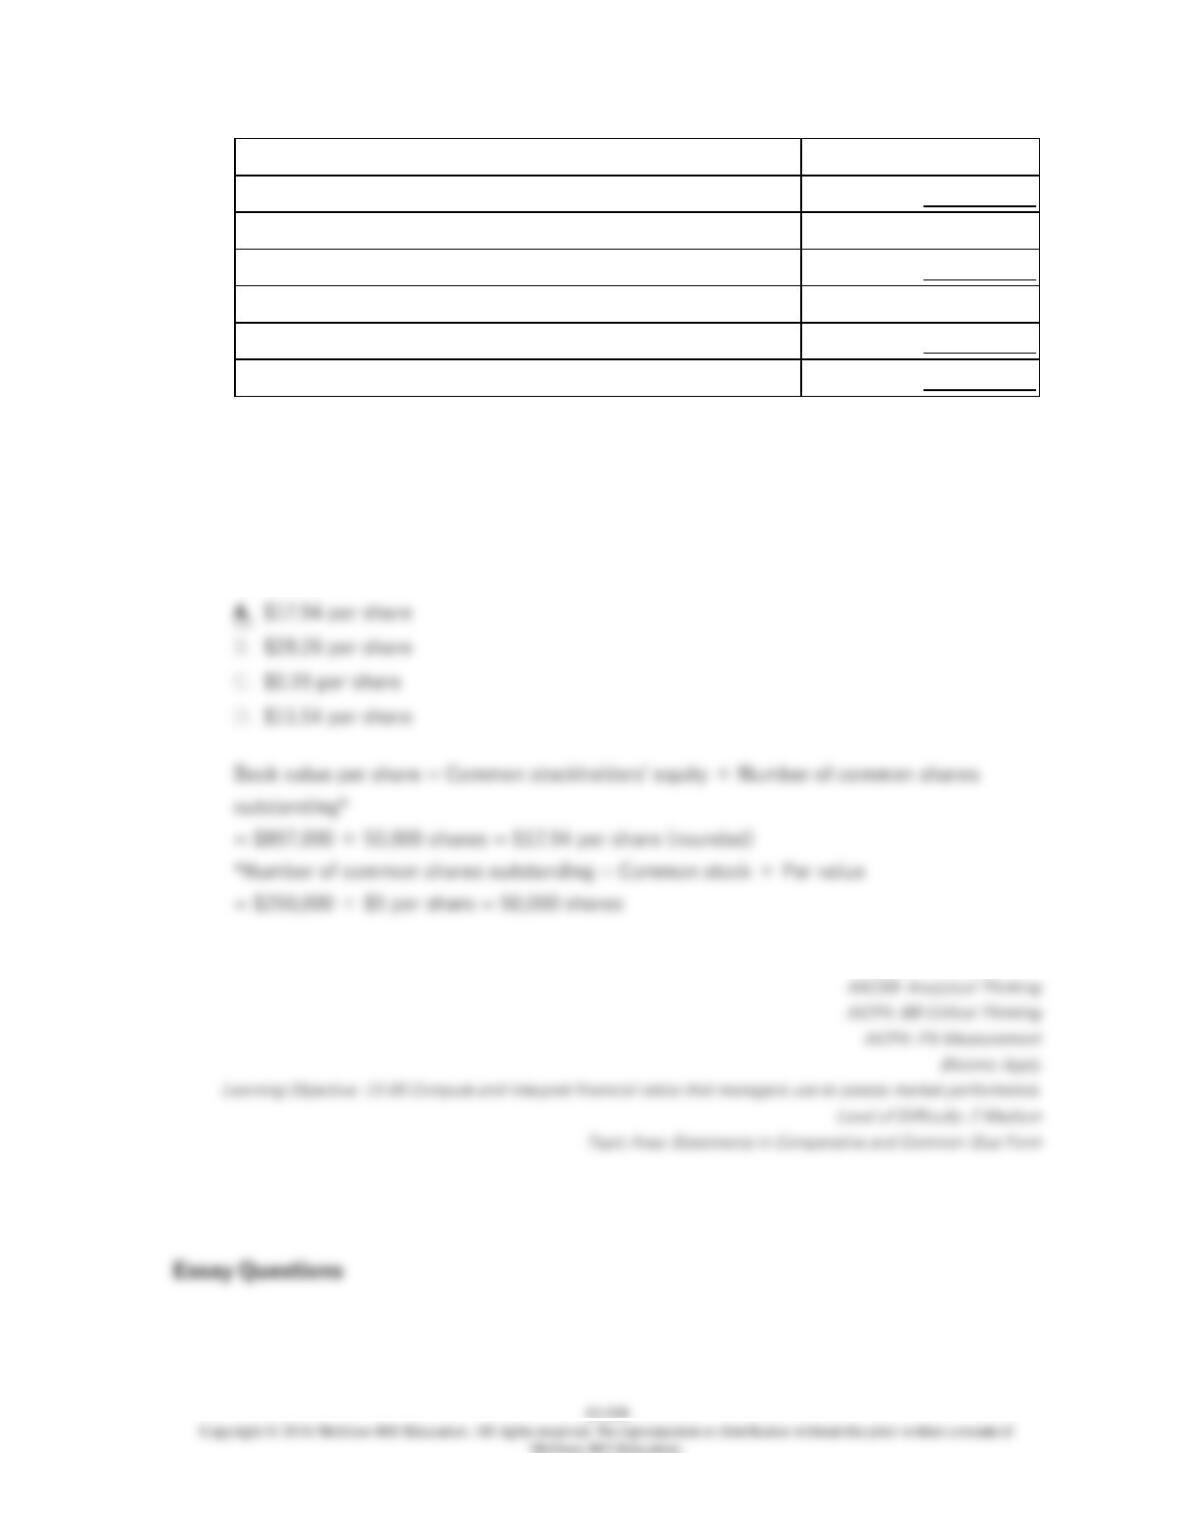
The company’s book value per share at the end of Year 2 is closest to:
13–549
238.
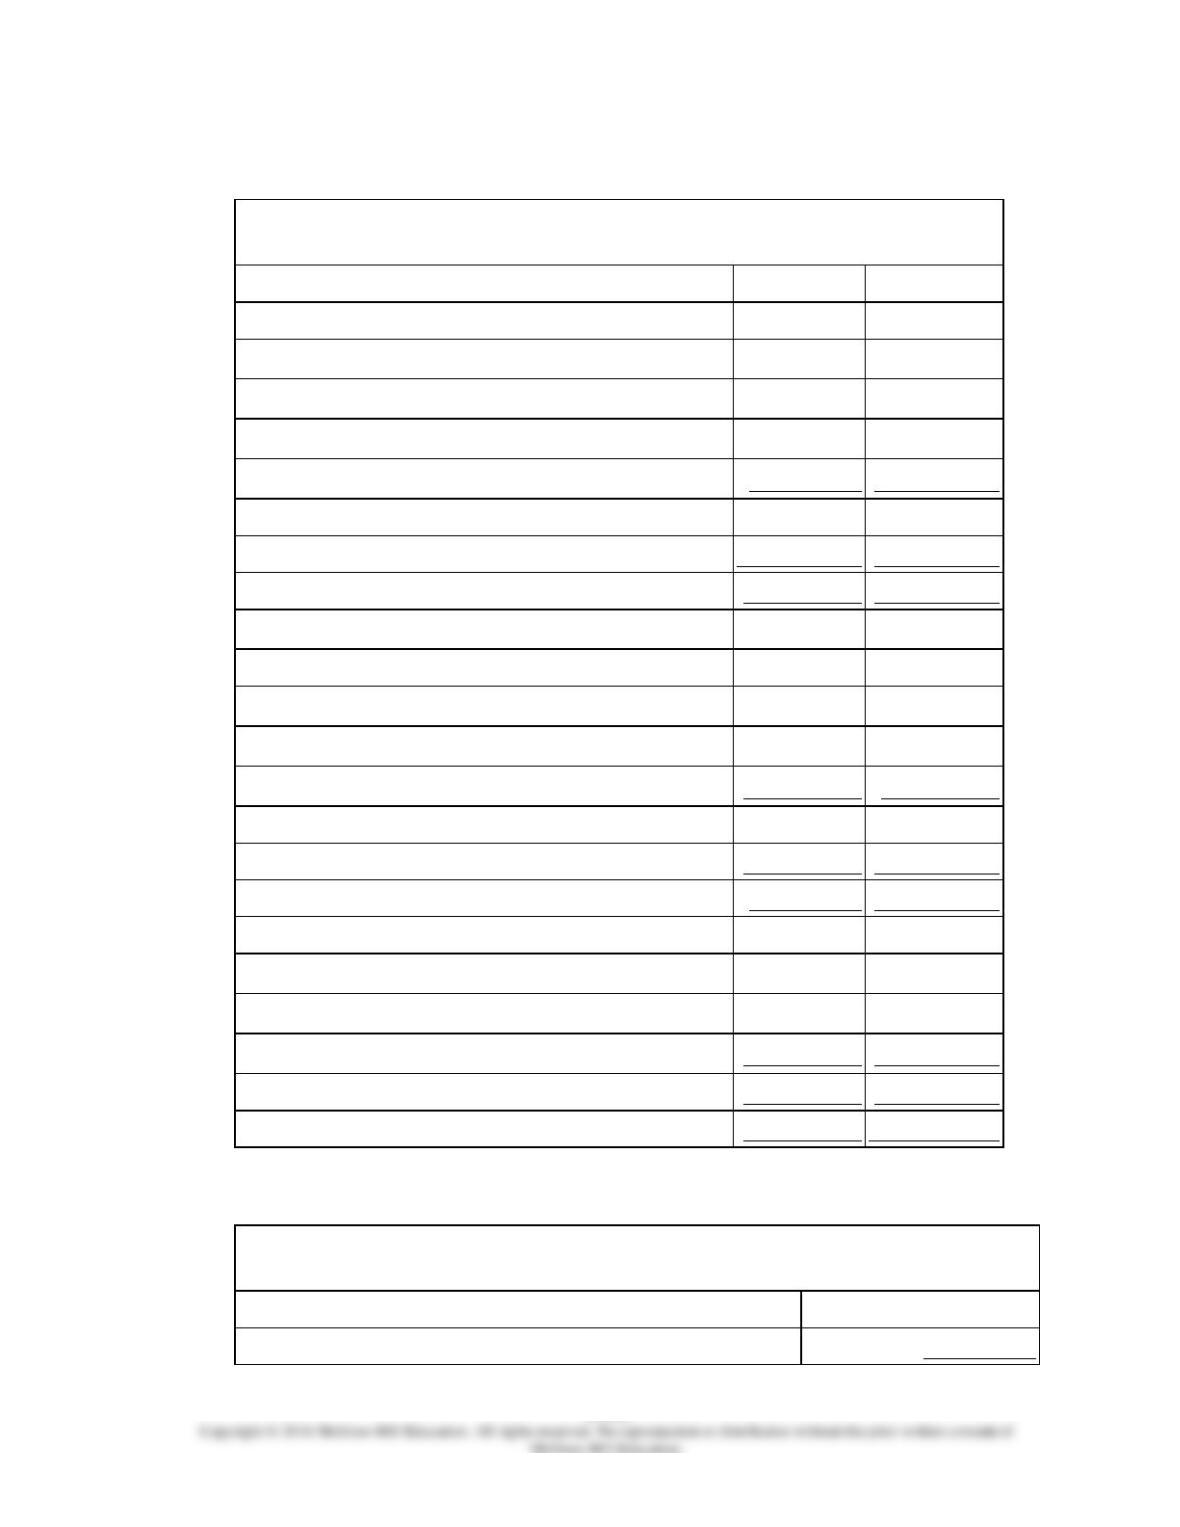
Symons Corporation has provided the following financial data:
Balance Sheet
December 31, Year 2 and Year 1
Assets
Year 2
Year 1
Current assets:
Cash
$225,000
$160,000
Accounts receivable
191,000
180,000
Inventory
96,000
110,000
Prepaid expenses
91,000
80,000
Total current assets
603,000
530,000
Plant and equipment, net
810,000
840,000
Total assets
$1,413,000
$1,370,000
Liabilities and Stockholders’ Equity
Current liabilities:
Accounts payable
$226,000
$190,000
Accrued liabilities
66,000
70,000
Notes payable, short term
54,000
50,000
Total current liabilities
346,000
310,000
Bonds payable
170,000
170,000
Total liabilities
516,000
480,000
Stockholders’ equity:
Common stock, $5 par value
250,000
250,000
Additional paid-in capital-common stock
70,000
70,000
Retained earnings
577,000
570,000
Total stockholders’ equity
897,000
890,000
Total liabilities & stockholders’ equity
$1,413,000
$1,370,000
Income Statement—Year 2
For the Year Ended December 31, Year 2
Sales (all on account)
$1,260,000
Cost of goods sold
760,000

Gross margin
500,000
Operating expenses
473,429
Net operating income
26,571
Interest expense
13,000
Net income before taxes
13,571
Income taxes (30%)
4,071
Net income
$9,500
Dividends on common stock during Year 2 totaled $2,500. The market price of common
stock at the end of Year 2 was $2.01 per share.
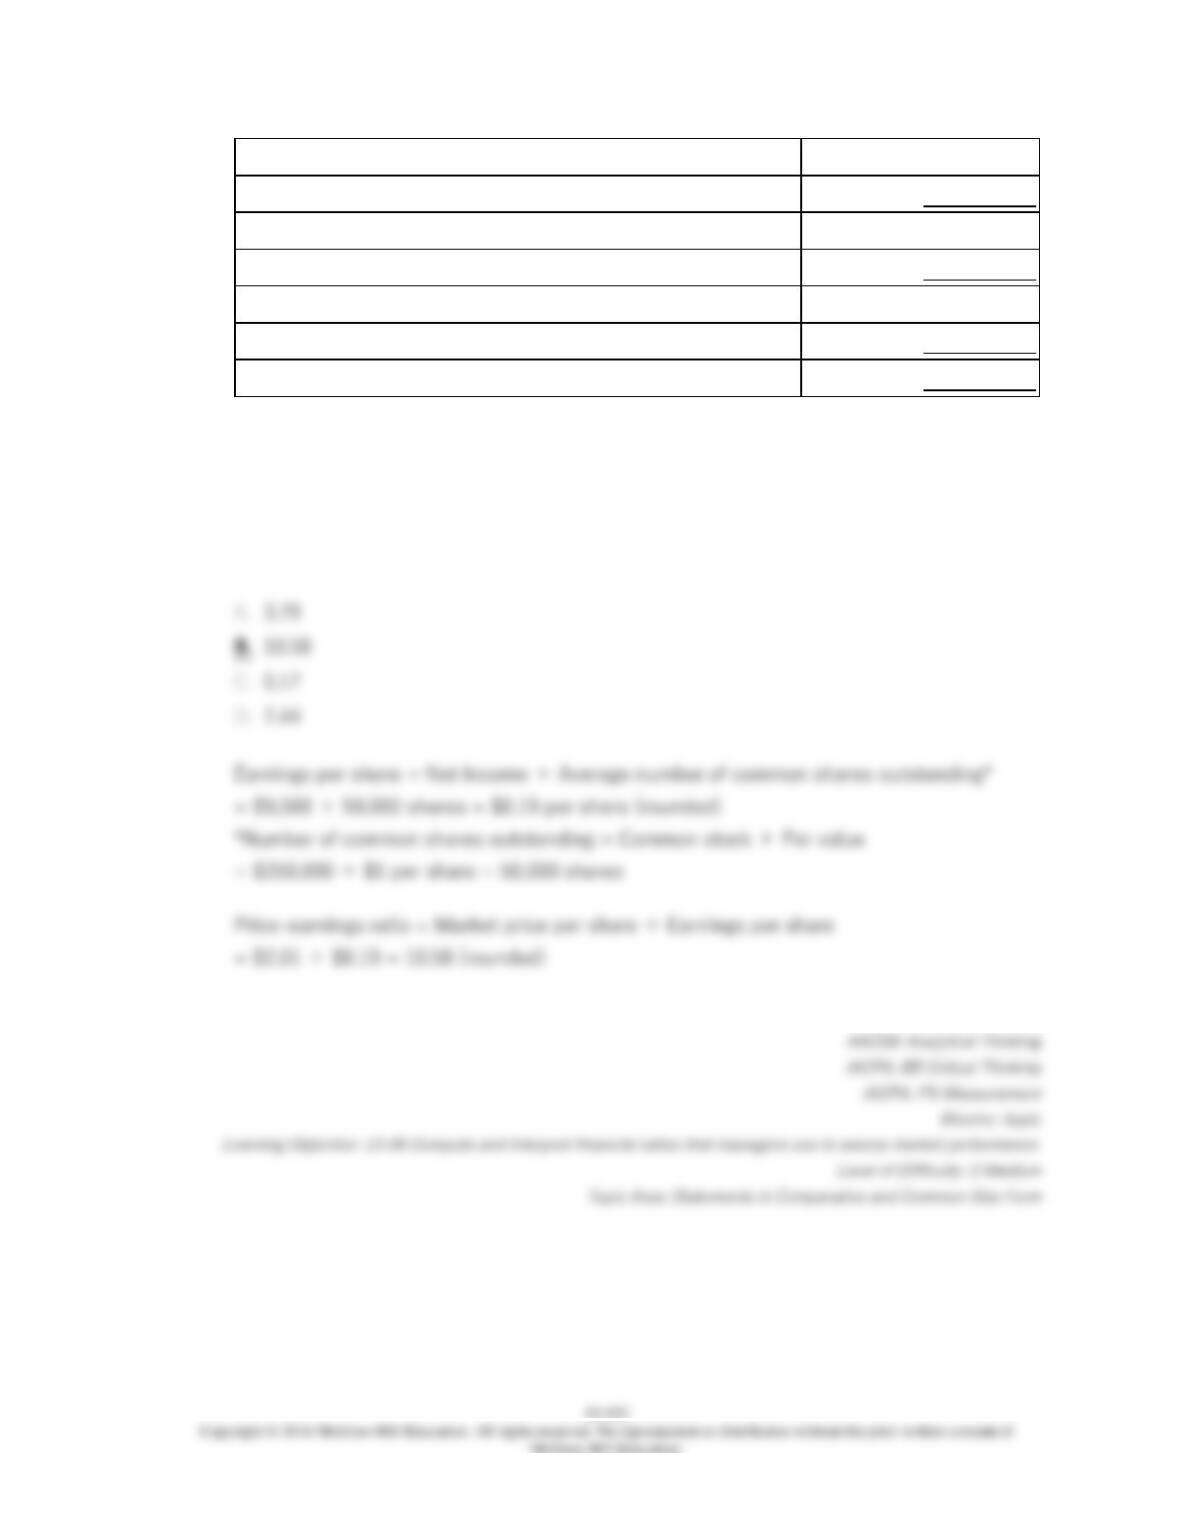
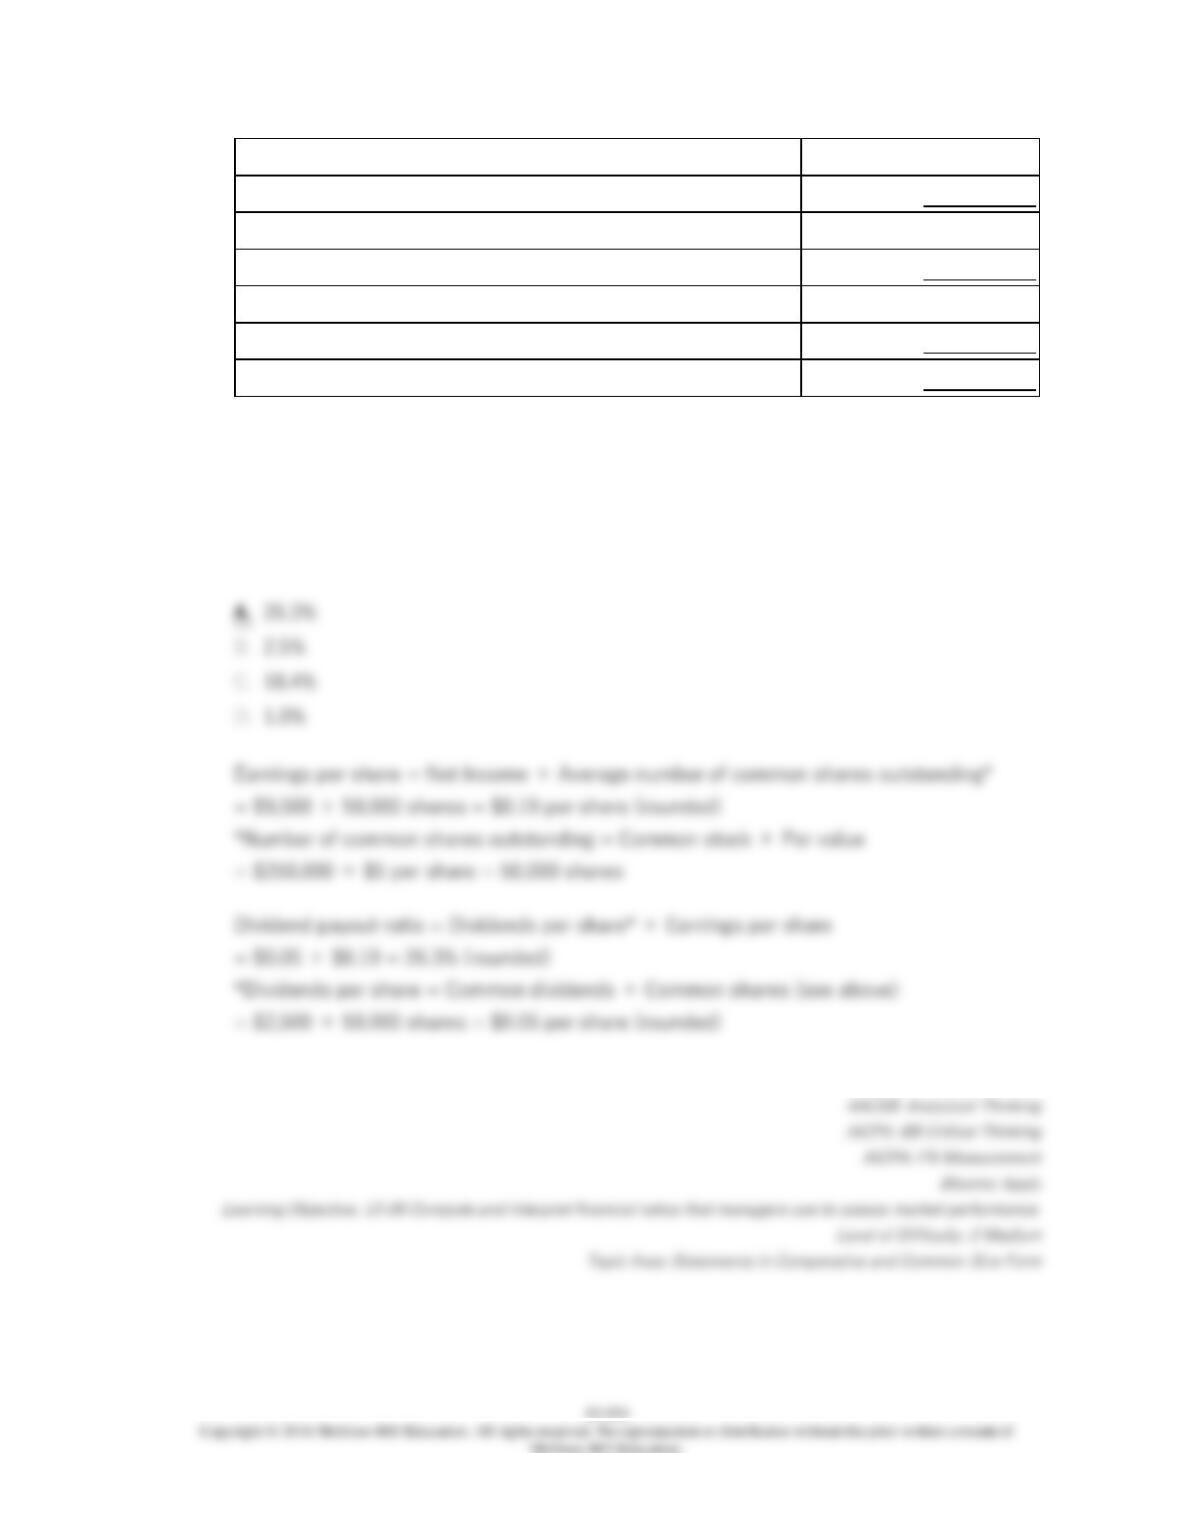
The company’s earnings per share for Year 2 is closest to:
= $250,000 ÷ $5 per share = 50,000 shares
13–551
239.
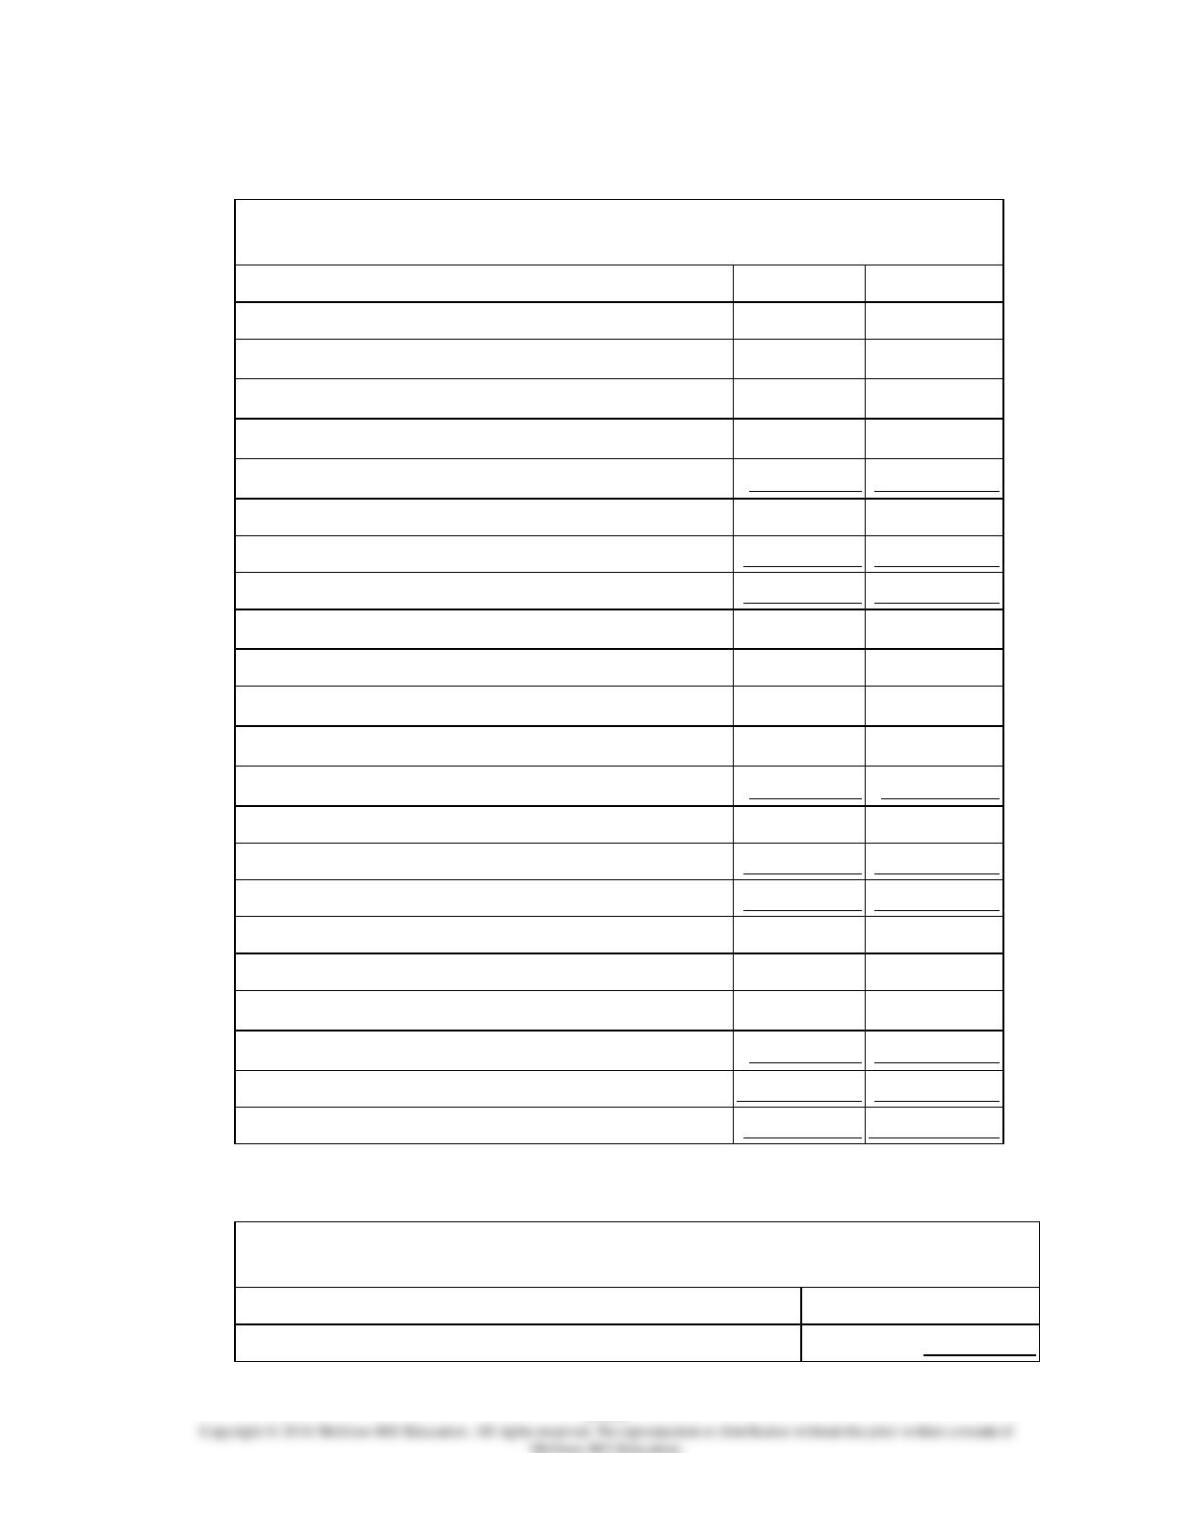
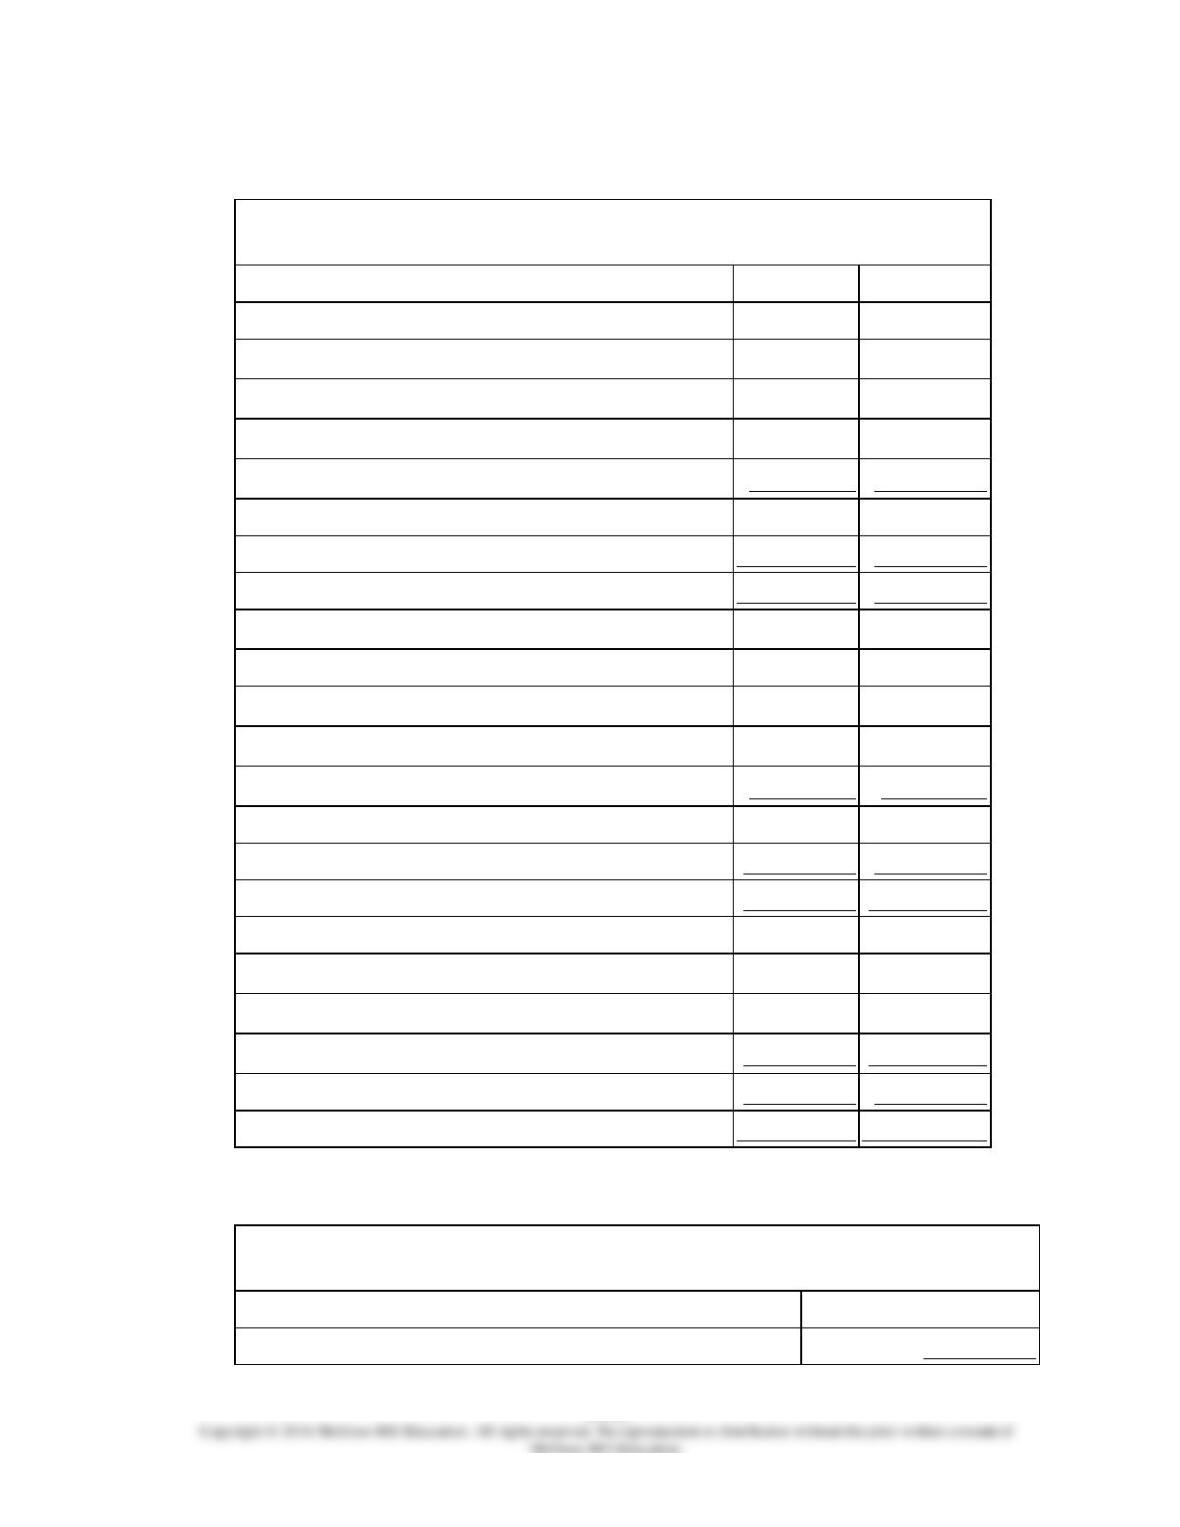
Symons Corporation has provided the following financial data:
Balance Sheet
December 31, Year 2 and Year 1
Assets
Year 2
Year 1
Current assets:
Cash
$225,000
$160,000
Accounts receivable
191,000
180,000
Inventory
96,000
110,000
Prepaid expenses
91,000
80,000
Total current assets
603,000
530,000
Plant and equipment, net
810,000
840,000
Total assets
$1,413,000
$1,370,000
Liabilities and Stockholders’ Equity
Current liabilities:
Accounts payable
$226,000
$190,000
Accrued liabilities
66,000
70,000
Notes payable, short term
54,000
50,000
Total current liabilities
346,000
310,000
Bonds payable
170,000
170,000
Total liabilities
516,000
480,000
Stockholders’ equity:
Common stock, $5 par value
250,000
250,000
Additional paid-in capital-common stock
70,000
70,000
Retained earnings
577,000
570,000
Total stockholders’ equity
897,000
890,000
Total liabilities & stockholders’ equity
$1,413,000
$1,370,000
Income Statement—Year 2
For the Year Ended December 31, Year 2
Sales (all on account)
$1,260,000
Cost of goods sold
760,000
Gross margin
500,000
Operating expenses
473,429
Net operating income
26,571
Interest expense
13,000
Net income before taxes
13,571
Income taxes (30%)
4,071
Net income
$9,500
Dividends on common stock during Year 2 totaled $2,500. The market price of common
stock at the end of Year 2 was $2.01 per share.
The company’s price-earnings ratio for Year 2 is closest to:
13–553
240.
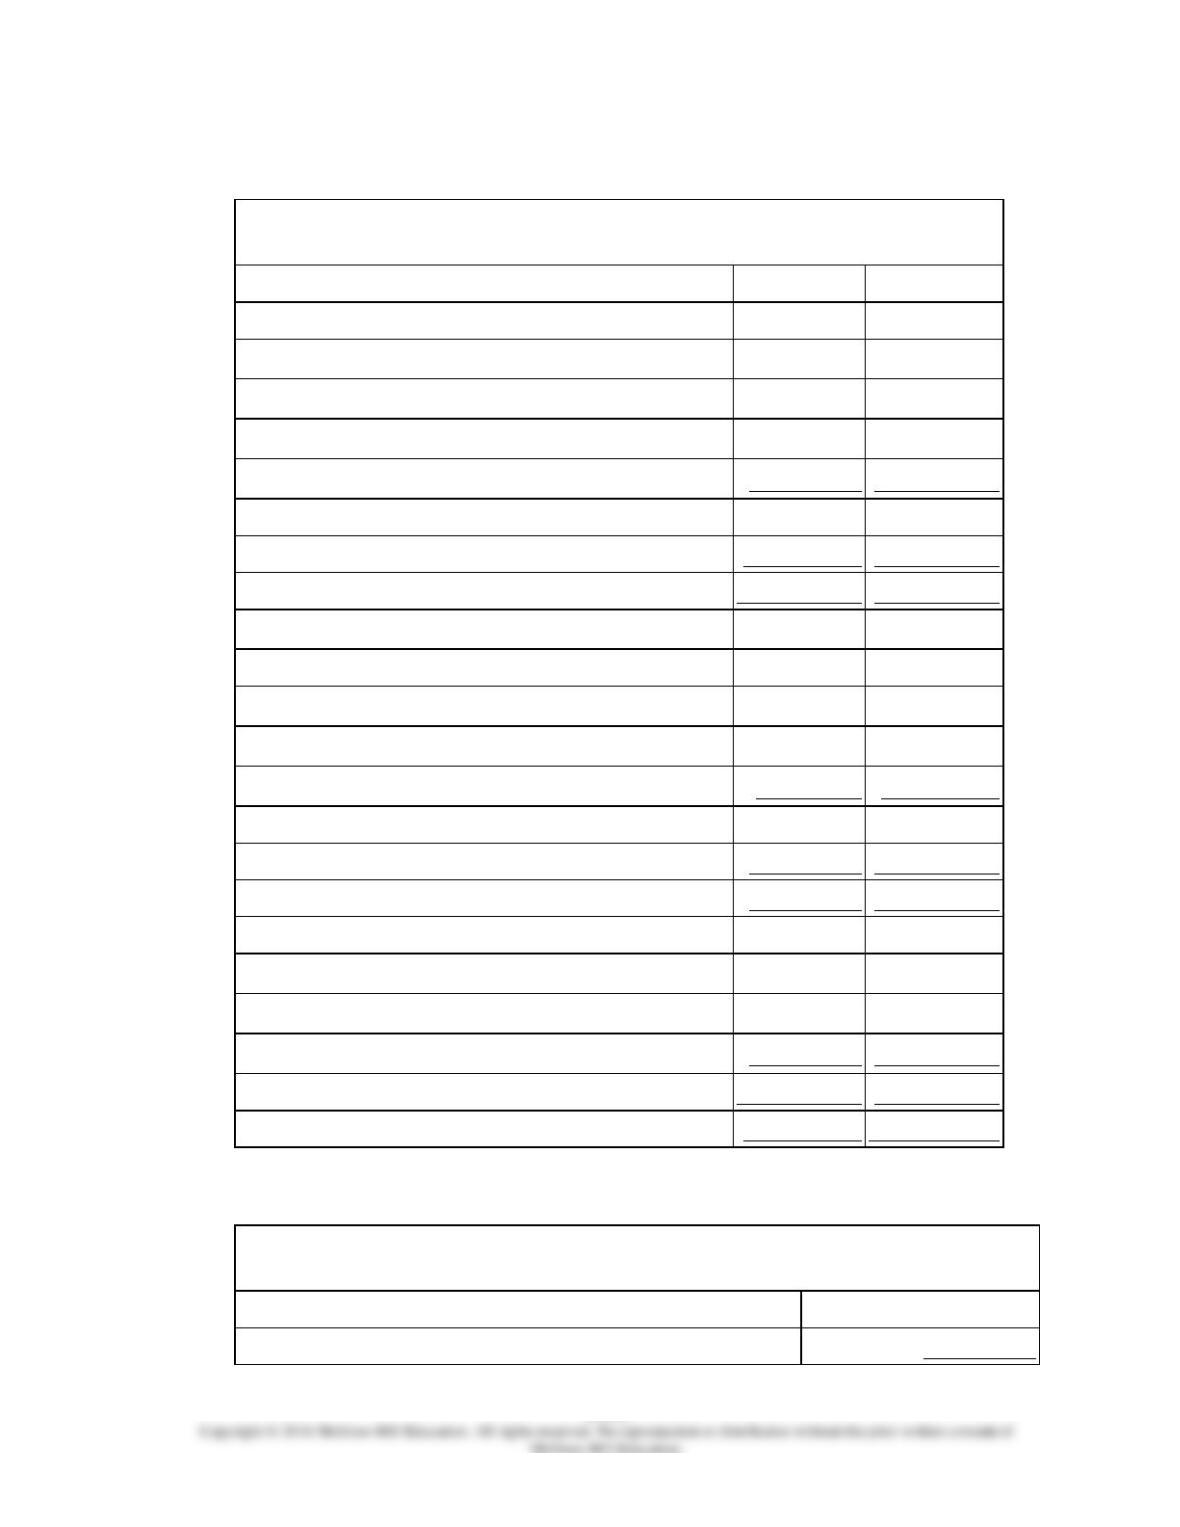
Symons Corporation has provided the following financial data:
Balance Sheet
December 31, Year 2 and Year 1
Assets
Year 2
Year 1
Current assets:
Cash
$225,000
$160,000
Accounts receivable
191,000
180,000
Inventory
96,000
110,000
Prepaid expenses
91,000
80,000
Total current assets
603,000
530,000
Plant and equipment, net
810,000
840,000
Total assets
$1,413,000
$1,370,000
Liabilities and Stockholders’ Equity
Current liabilities:
Accounts payable
$226,000
$190,000
Accrued liabilities
66,000
70,000
Notes payable, short term
54,000
50,000
Total current liabilities
346,000
310,000
Bonds payable
170,000
170,000
Total liabilities
516,000
480,000
Stockholders’ equity:
Common stock, $5 par value
250,000
250,000
Additional paid-in capital-common stock
70,000
70,000
Retained earnings
577,000
570,000
Total stockholders’ equity
897,000
890,000
Total liabilities & stockholders’ equity
$1,413,000
$1,370,000
Income Statement—Year 2
For the Year Ended December 31, Year 2
Sales (all on account)
$1,260,000
Cost of goods sold
760,000
Gross margin
500,000
Operating expenses
473,429
Net operating income
26,571
Interest expense
13,000
Net income before taxes
13,571
Income taxes (30%)
4,071
Net income
$9,500
Dividends on common stock during Year 2 totaled $2,500. The market price of common
stock at the end of Year 2 was $2.01 per share.
The company’s dividend payout ratio for Year 2 is closest to:
13–555
241.
Symons Corporation has provided the following financial data:
Balance Sheet
December 31, Year 2 and Year 1
Assets
Year 2
Year 1
Current assets:
Cash
$225,000
$160,000
Accounts receivable
191,000
180,000
Inventory
96,000
110,000
Prepaid expenses
91,000
80,000
Total current assets
603,000
530,000
Plant and equipment, net
810,000
840,000
Total assets
$1,413,000
$1,370,000
Liabilities and Stockholders’ Equity
Current liabilities:
Accounts payable
$226,000
$190,000
Accrued liabilities
66,000
70,000
Notes payable, short term
54,000
50,000
Total current liabilities
346,000
310,000
Bonds payable
170,000
170,000
Total liabilities
516,000
480,000
Stockholders’ equity:
Common stock, $5 par value
250,000
250,000
Additional paid-in capital-common stock
70,000
70,000
Retained earnings
577,000
570,000
Total stockholders’ equity
897,000
890,000
Total liabilities & stockholders’ equity
$1,413,000
$1,370,000
Income Statement—Year 2
For the Year Ended December 31, Year 2
Sales (all on account)
$1,260,000
Cost of goods sold
760,000
Gross margin
500,000
Operating expenses
473,429
Net operating income
26,571
Interest expense
13,000
Net income before taxes
13,571
Income taxes (30%)
4,071
Net income
$9,500
Dividends on common stock during Year 2 totaled $2,500. The market price of common
stock at the end of Year 2 was $2.01 per share.
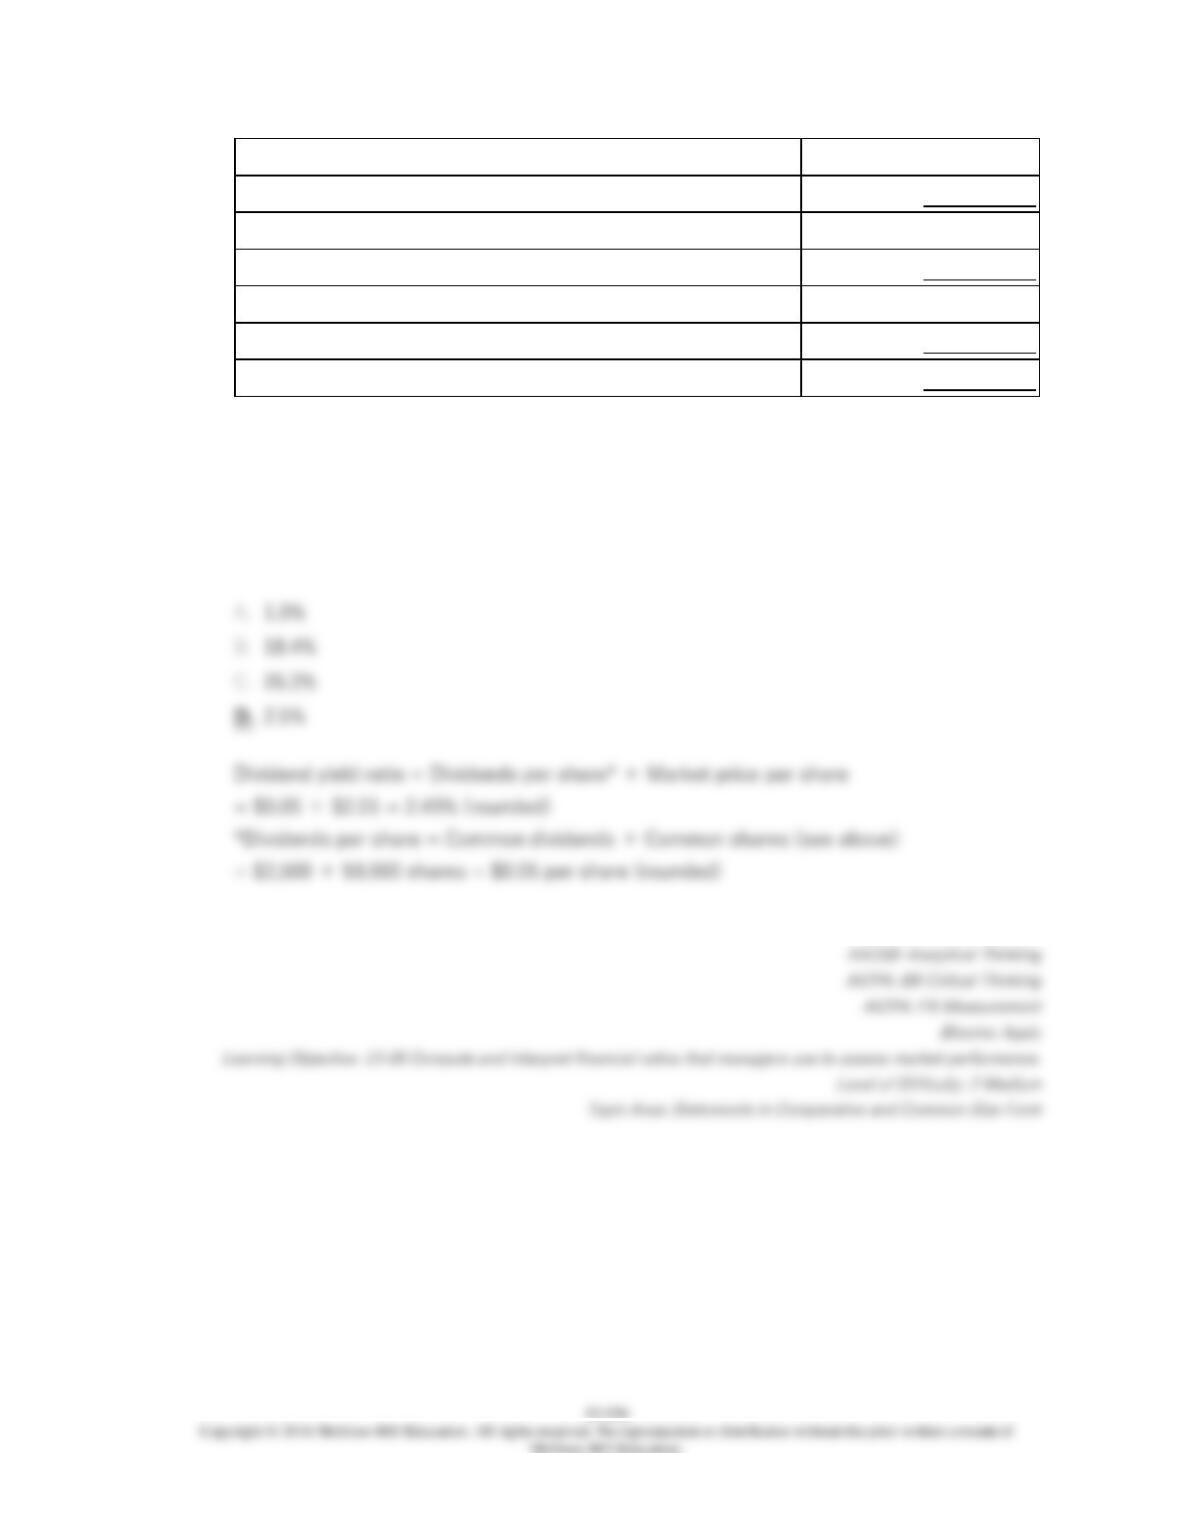
The company’s dividend yield ratio for Year 2 is closest to:
13–557
242.
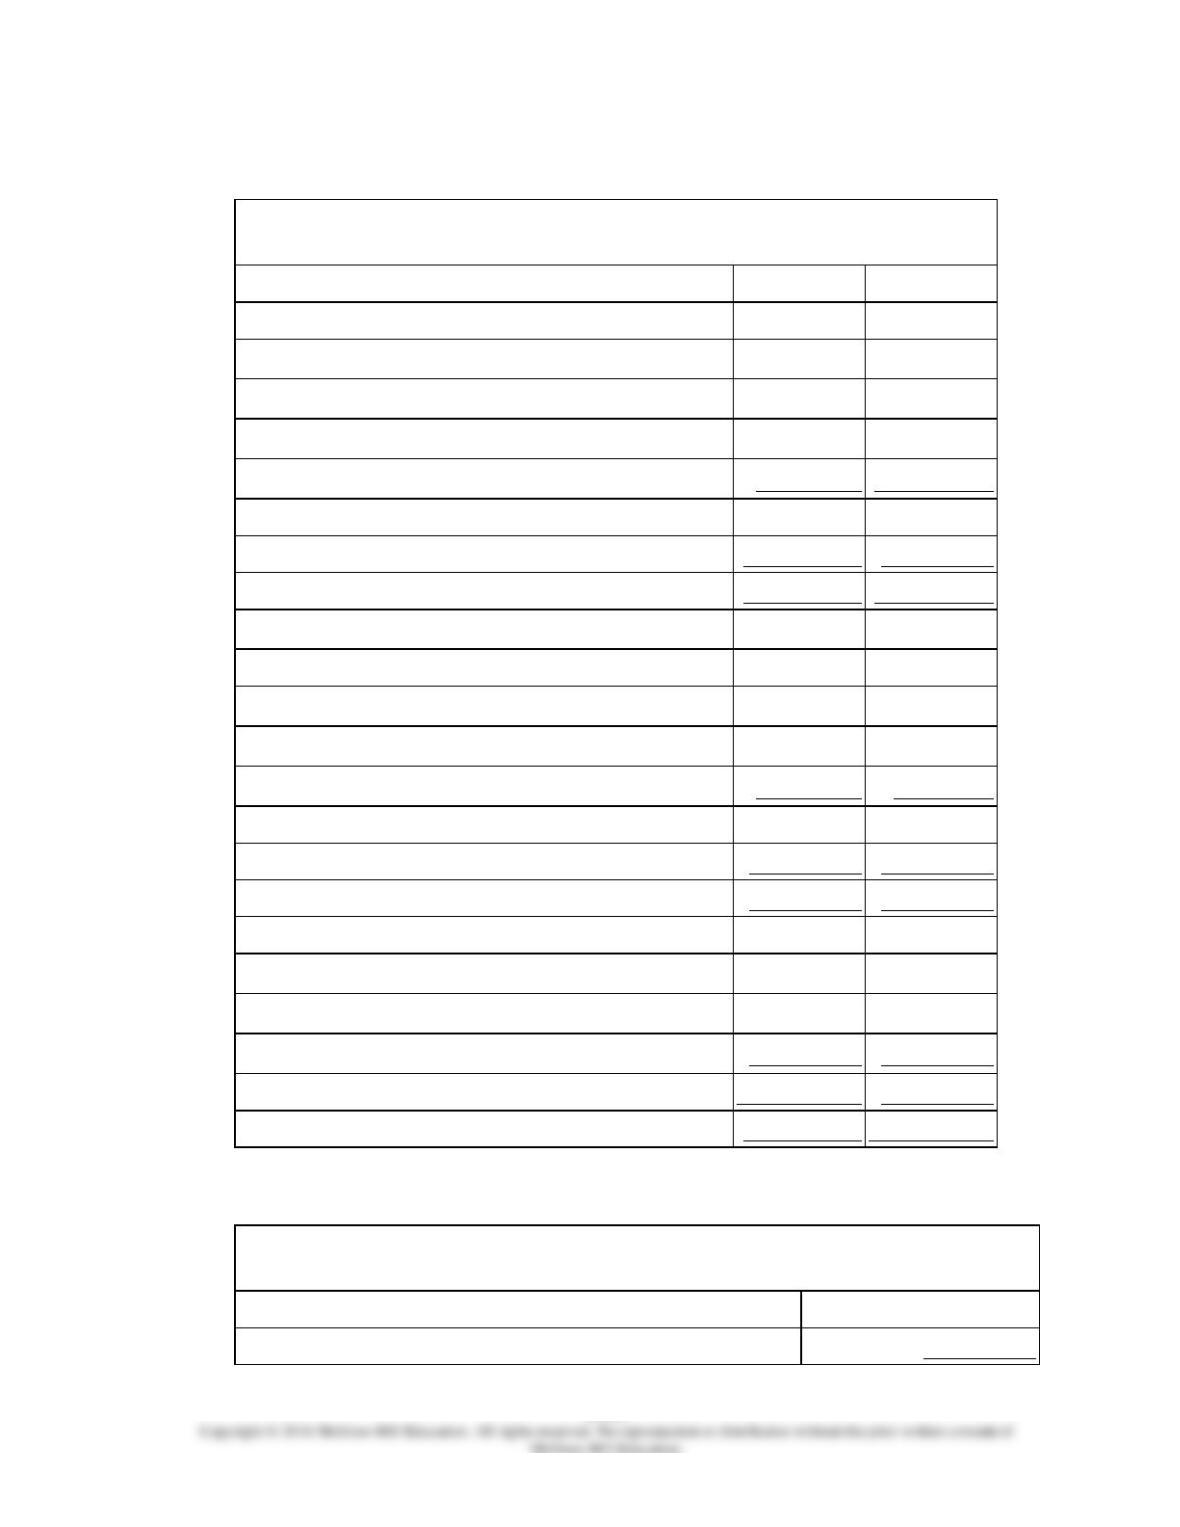
Symons Corporation has provided the following financial data:
Balance Sheet
December 31, Year 2 and Year 1
Assets
Year 2
Year 1
Current assets:
Cash
$225,000
$160,000
Accounts receivable
191,000
180,000
Inventory
96,000
110,000
Prepaid expenses
91,000
80,000
Total current assets
603,000
530,000
Plant and equipment, net
810,000
840,000
Total assets
$1,413,000
$1,370,000
Liabilities and Stockholders’ Equity
Current liabilities:
Accounts payable
$226,000
$190,000
Accrued liabilities
66,000
70,000
Notes payable, short term
54,000
50,000
Total current liabilities
346,000
310,000
Bonds payable
170,000
170,000
Total liabilities
516,000
480,000
Stockholders’ equity:
Common stock, $5 par value
250,000
250,000
Additional paid-in capital-common stock
70,000
70,000
Retained earnings
577,000
570,000
Total stockholders’ equity
897,000
890,000
Total liabilities & stockholders’ equity
$1,413,000
$1,370,000
Income Statement—Year 2
For the Year Ended December 31, Year 2
Sales (all on account)
$1,260,000
Cost of goods sold
760,000
Gross margin
500,000
Operating expenses
473,429
Net operating income
26,571
Interest expense
13,000
Net income before taxes
13,571
Income taxes (30%)
4,071
Net income
$9,500
Dividends on common stock during Year 2 totaled $2,500. The market price of common
stock at the end of Year 2 was $2.01 per share.
The company’s book value per share at the end of Year 2 is closest to:
13–559
243.
Rubendall Corporation’s total current assets are $310,000, its noncurrent assets are
$630,000, its total current liabilities are $250,000, its long-term liabilities are $300,000, and
its stockholders’ equity is $390,000.
Required:
Compute the company’s current ratio. Show your work!
13–560
244.
Gremel Corporation has provided the following financial data:
Current assets:
Cash
$241,000
Accounts receivable
$234,000
Inventory
$119,000
Prepaid expenses
$45,000
Total current assets
$639,000
Current liabilities:
Accounts payable
$163,000
Accrued liabilities
$87,000
Notes payable, short
term
$57,000
Total current liabilities
$307,000
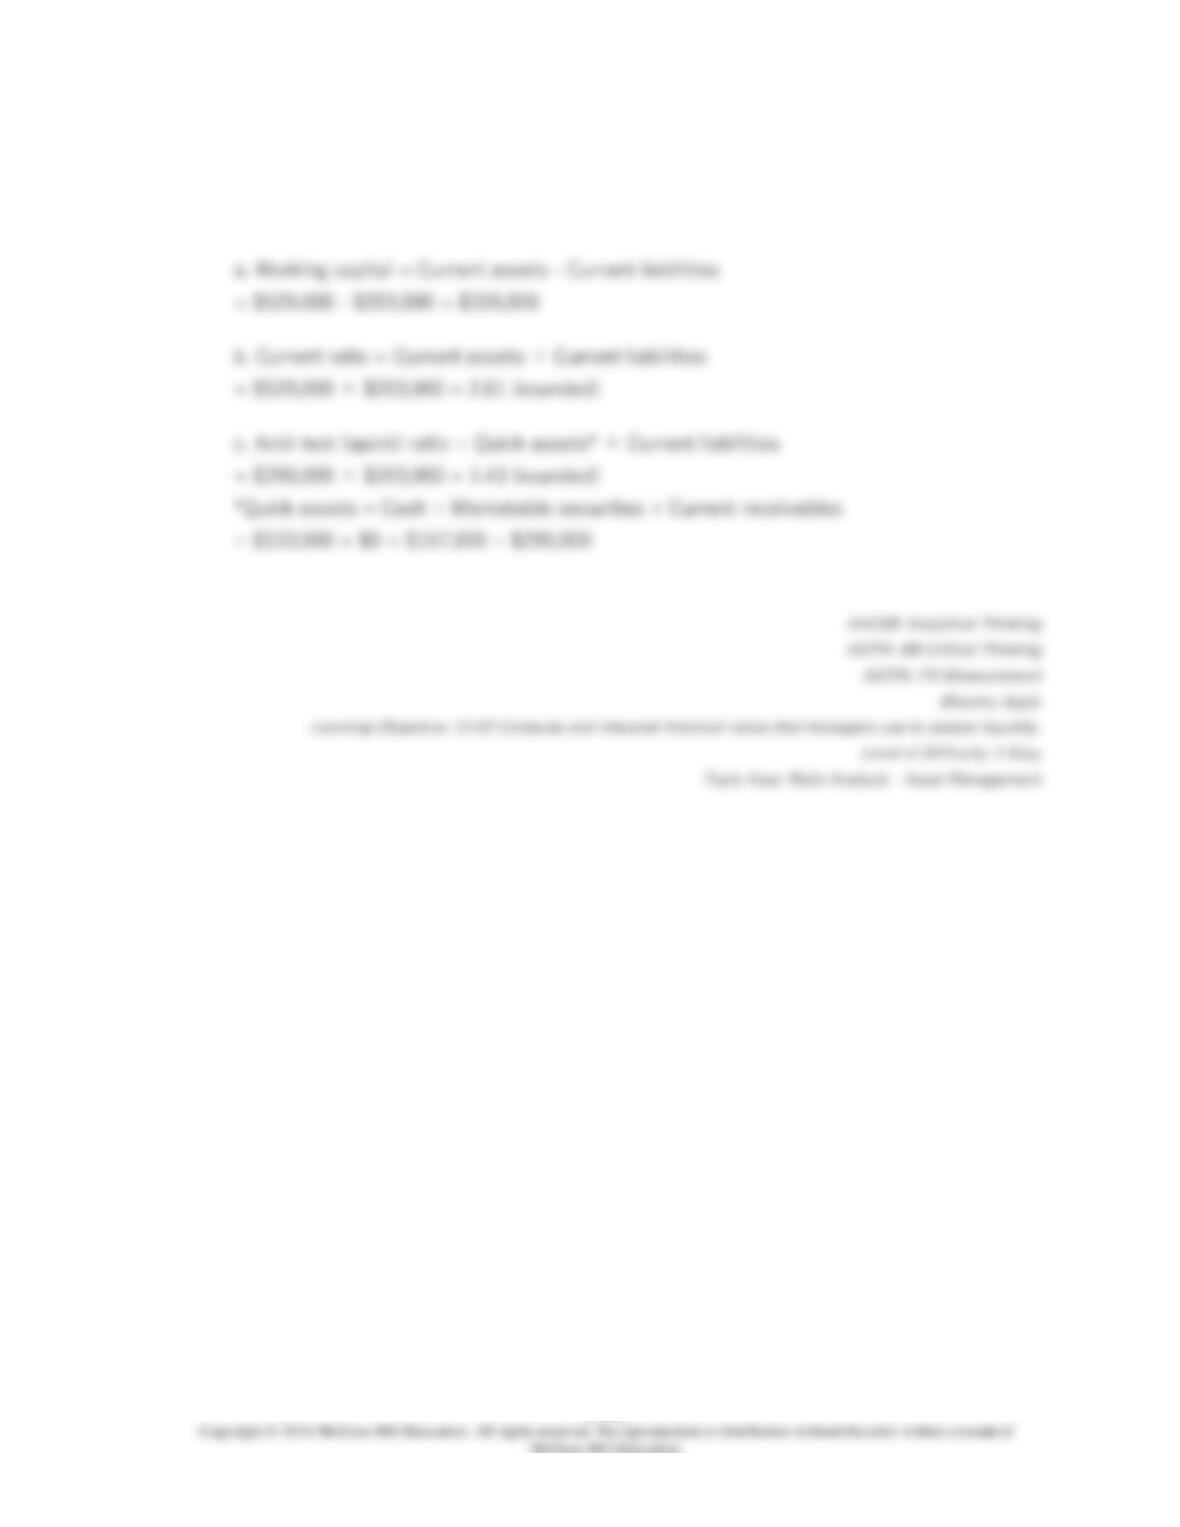
Required:
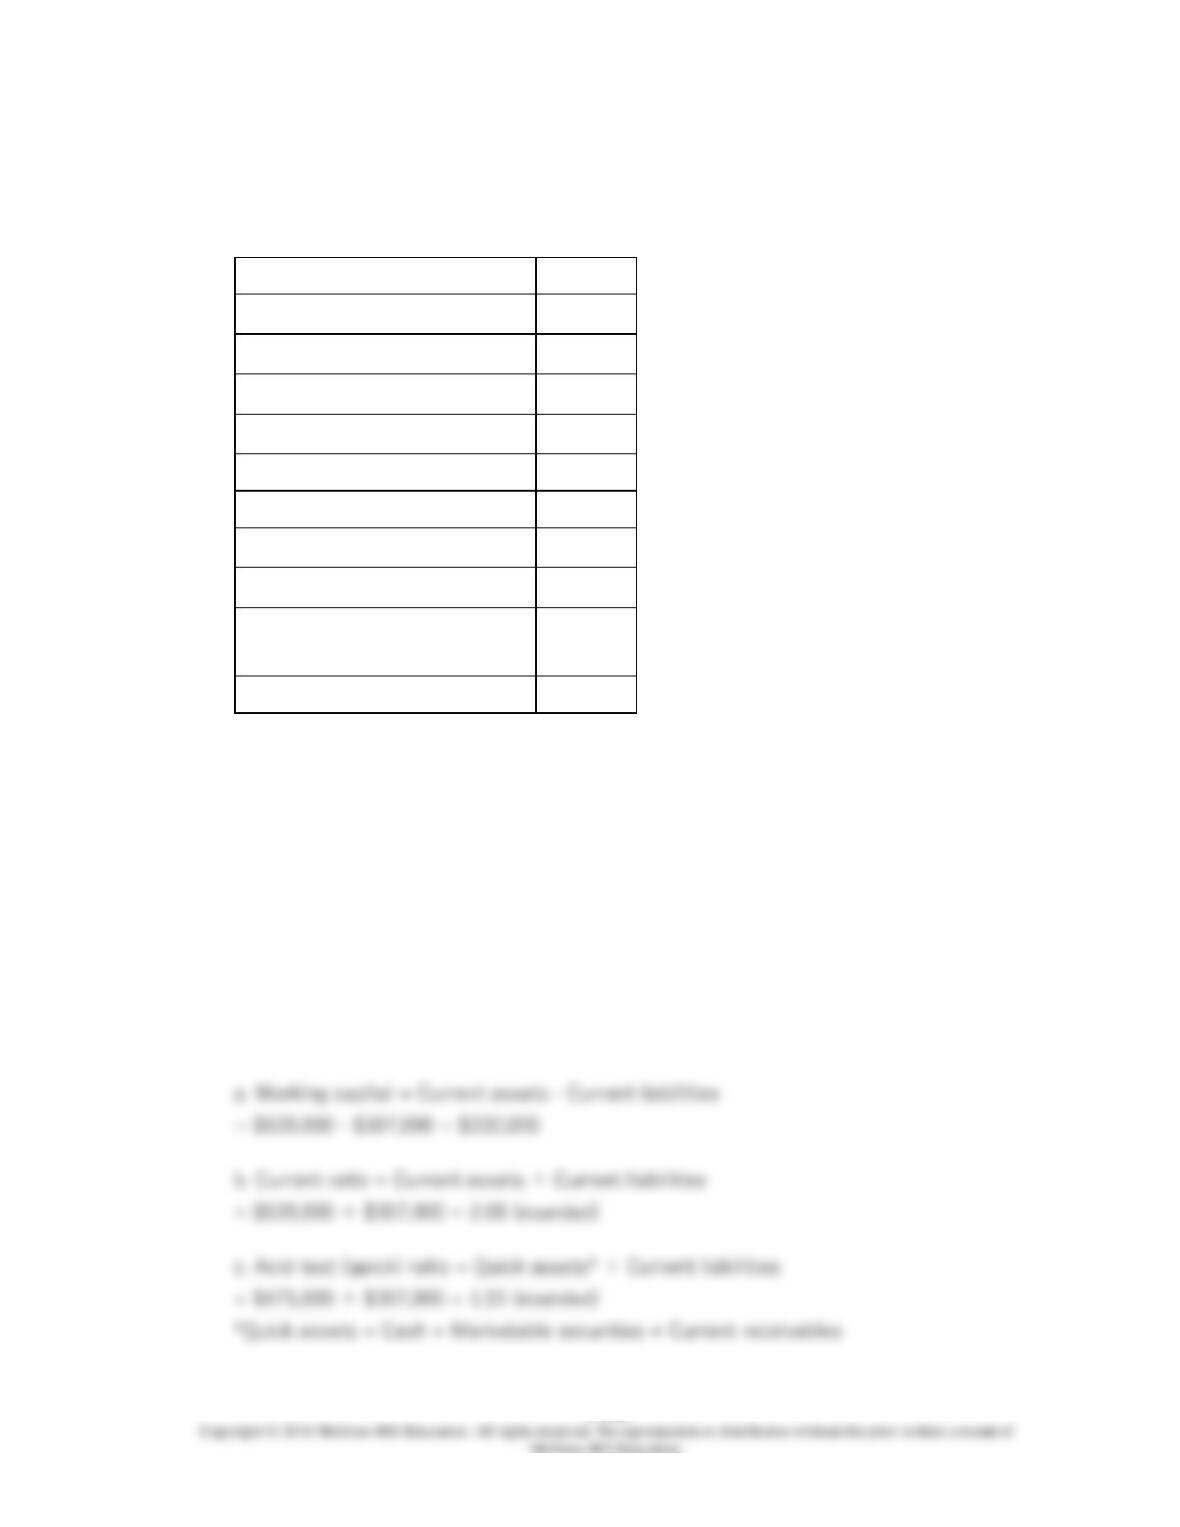
a. What is the company’s working capital?
b. What is the company’s current ratio?
c. What is the company’s acid-test (quick) ratio?
13–561
245.
Steinkraus Corporation has provided the following data:
13–562
246.
Arkin Corporation’s total current assets are $290,000, its noncurrent assets are $520,000,
its total current liabilities are $210,000, its long-term liabilities are $420,000, and its
13–563
247.
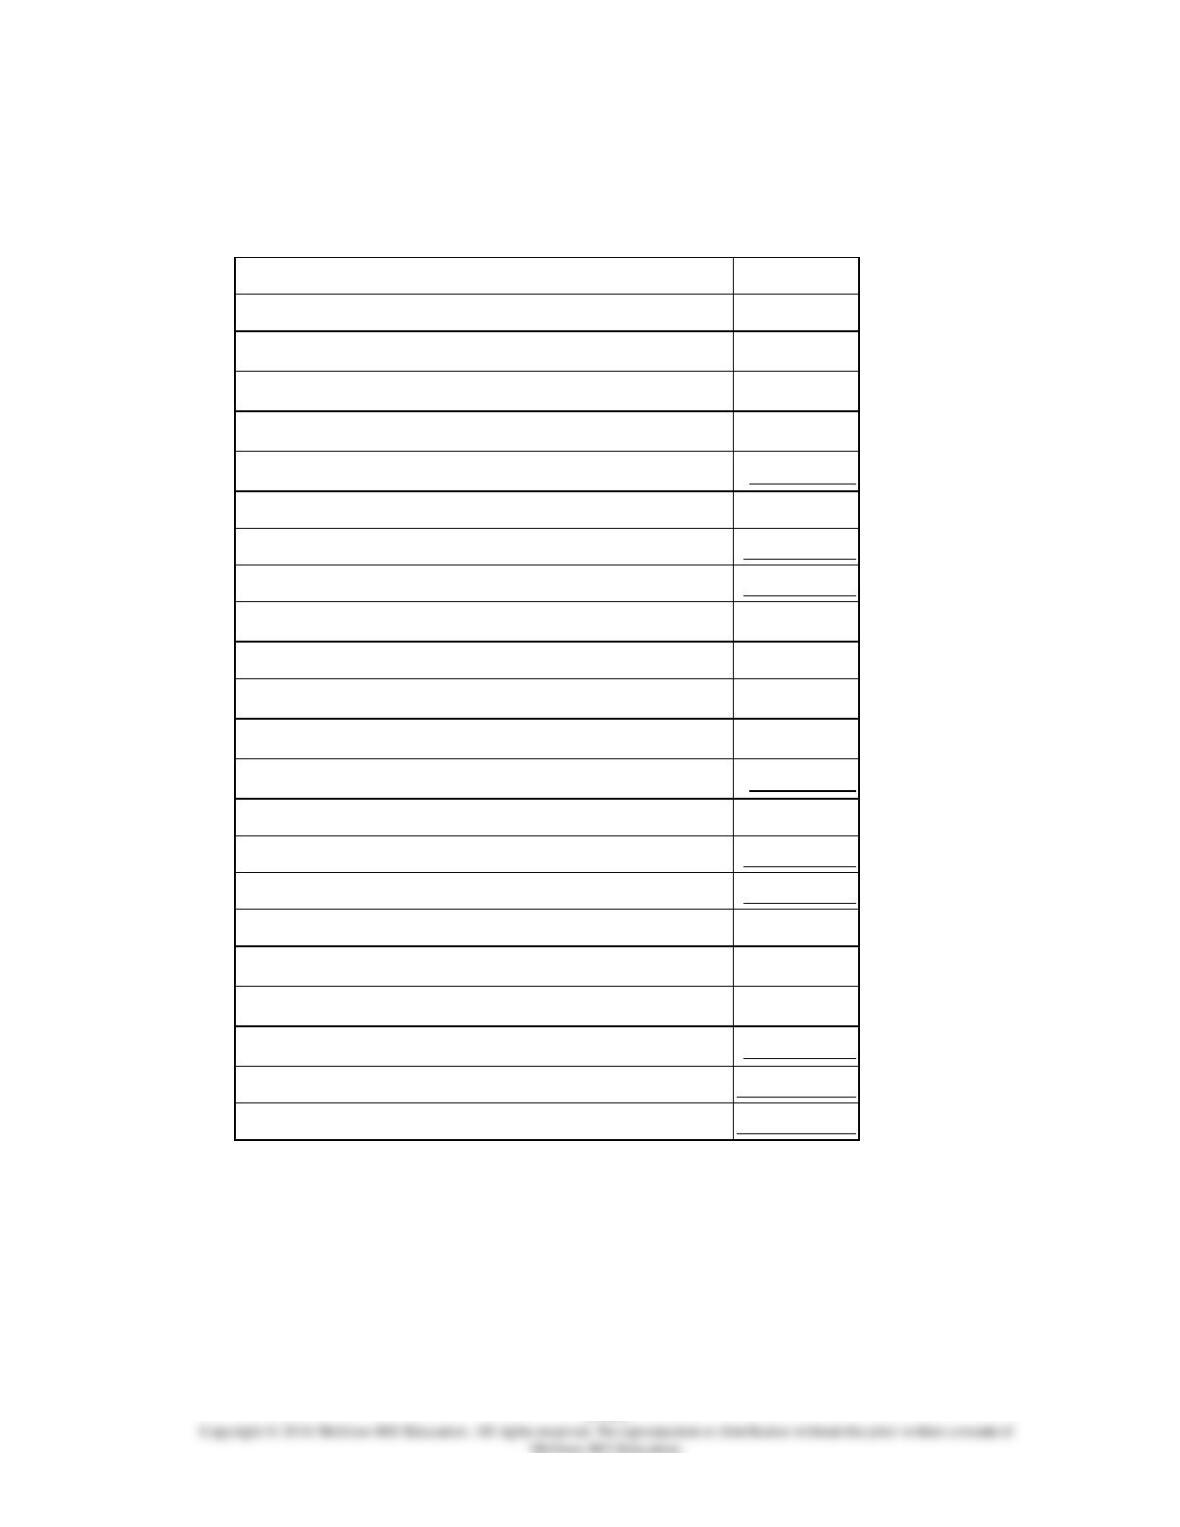
Wowk Corporation has provided the following financial data:
Assets
Current assets:
Cash
$133,000
Accounts receivable
157,000
Inventory
215,000
Prepaid expenses
24,000
Total current assets
529,000
Plant and equipment, net
768,000
Total assets
$1,297,000
Liabilities and Stockholders’ Equity
Current liabilities:
Accounts payable
$95,000
Accrued liabilities
18,000
Notes payable, short term
90,000
Total current liabilities
203,000
Bonds payable
110,000
Total liabilities
313,000
Stockholders’ equity:
Common stock, $4 par value
200,000
Additional paid-in capital-common stock
80,000
Retained earnings
704,000
Total stockholders’ equity
984,000
Total liabilities & stockholders’ equity
$1,297,000
Required:
a. What is the company’s working capital?
b. What is the company’s current ratio?
c. What is the company’s acid-test (quick) ratio?
13–564