245. Steinkraus Corporation has provided the following data:
This Year Last Year
Accounts receivable $104,000 $115,000
Inventory $195,000 $174,000
Sales on account $886,000
Cost of goods sold $622,000
Required:
Compute the accounts receivable turnover for this year. Show your work!
246. Arkin Corporation’s total current assets are $290,000, its noncurrent assets are $520,000,
its total current liabilities are $210,000, its long-term liabilities are $420,000, and its stockholders’
equity is $180,000.
Required:
Compute the company’s working capital. Show your work!

13-263
247. Wowk Corporation has provided the following financial data:
Assets
Current assets:
Cash $133,000
Accounts receivable 157,000
Inventory 215,000
Prepaid expenses 24,000
Total current assets 529,000
Plant and equipment, net 768,000
Total assets $1,297,000
Liabilities and Stockholders’ Equity
Current liabilities:
Accounts payable $95,000
Accrued liabilities 18,000
Notes payable, short term 90,000
Total current liabilities 203,000
Bonds payable 110,000
Total liabilities 313,000
Stockholders’ equity:
Common stock, $4 par value 200,000
Additional paid-in capital-common stock 80,000
Retained earnings 704,000
Total stockholders’ equity 984,000
Total liabilities & stockholders’ equity $1,297,000
Required:
a. What is the company’s working capital?
b. What is the company’s current ratio?
c. What is the company’s acid-test (quick) ratio?
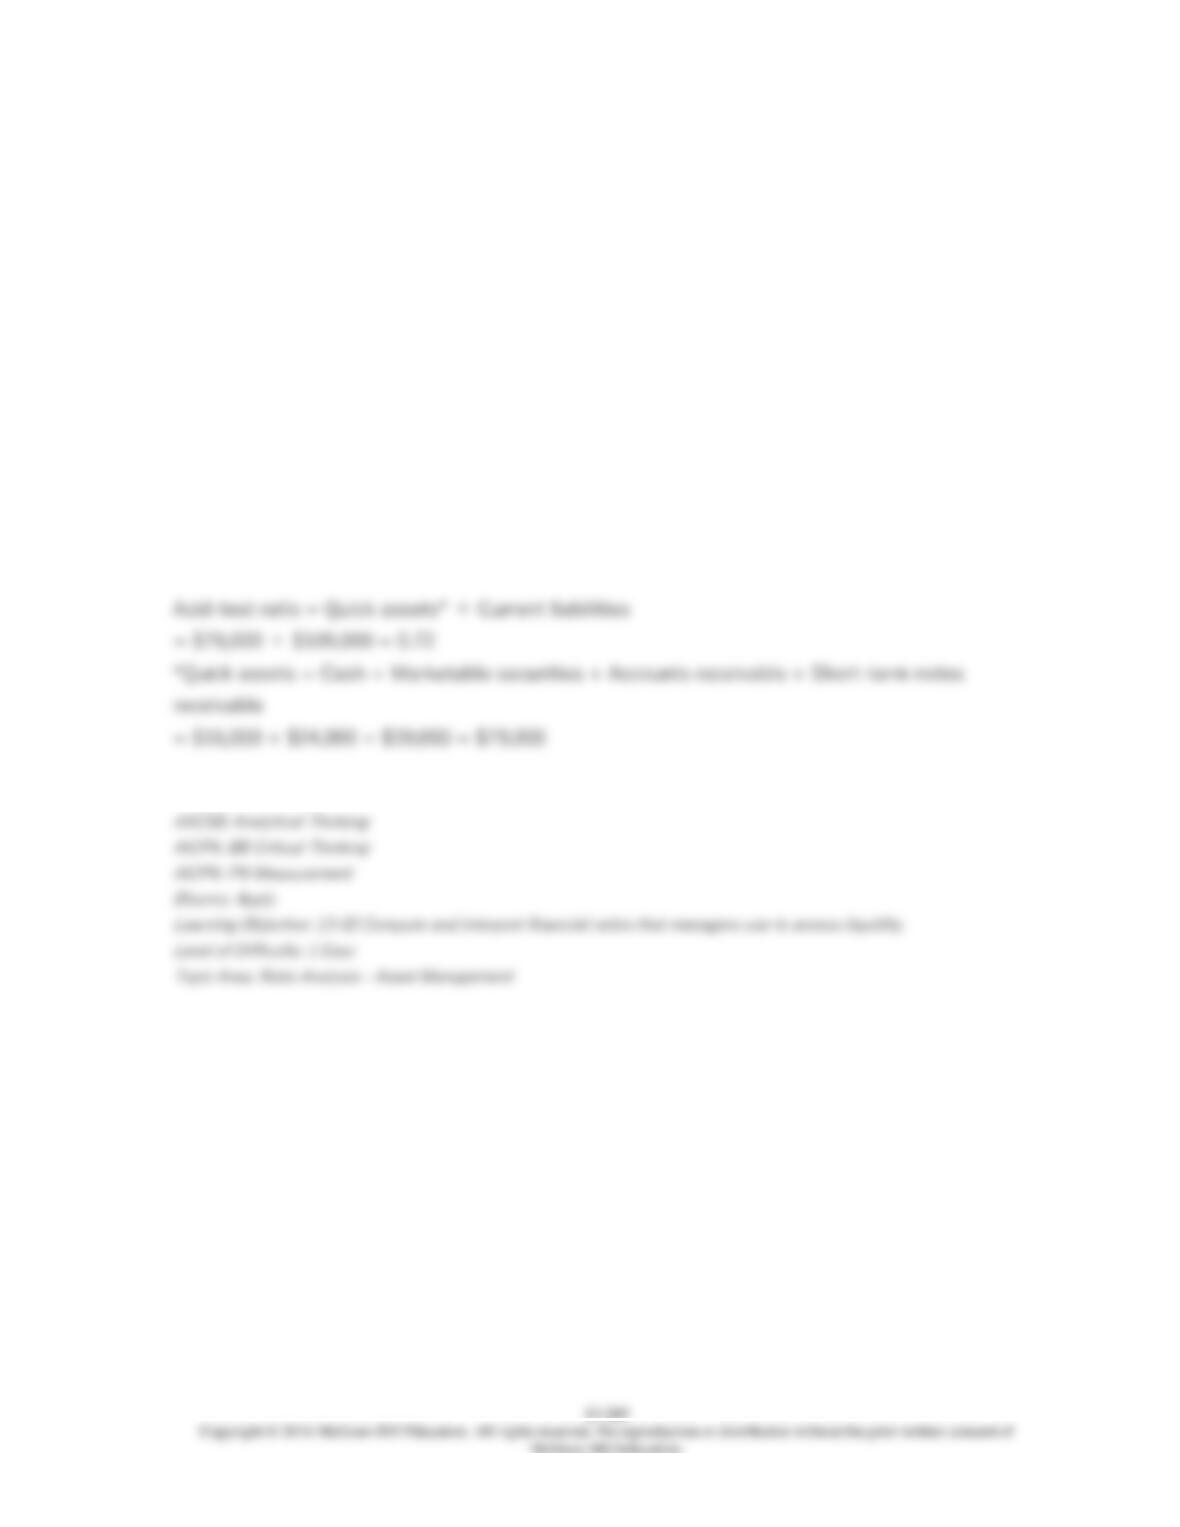
248. Data from Yochem Corporation’s most recent balance sheet appear below:
Cash $16,000
Marketable securities $24,000
Accounts receivables $39,000
Inventory $53,000
Prepaid expenses $11,000
Current liabilities $109,000
Required:
Compute the company’s acid-test ratio. Show your work!

13-266
249. Excerpts from Candle Corporation’s most recent balance sheet (in thousands of dollars)
appear below:
Year 2 Year 1
Current assets:
Cash $160 $100
Accounts receivable 190 190
Inventory 140 130
Prepaid expenses 90 90
Total current assets $580 $510
Current liabilities:
Accounts payable $200 $180
Accrued liabilities 30 30
Notes payable, short term 90 80
Total current liabilities $320 $290
Sales on account during the year totaled $1,200 thousand. Cost of goods sold was $800
thousand.
Required:
Compute the following for Year 2:
a. Working capital.
b. Current ratio.
c. Acid-test ratio.
d. Accounts receivable turnover.
e. Average collection period.
f. Inventory turnover.
g. Average sale period.
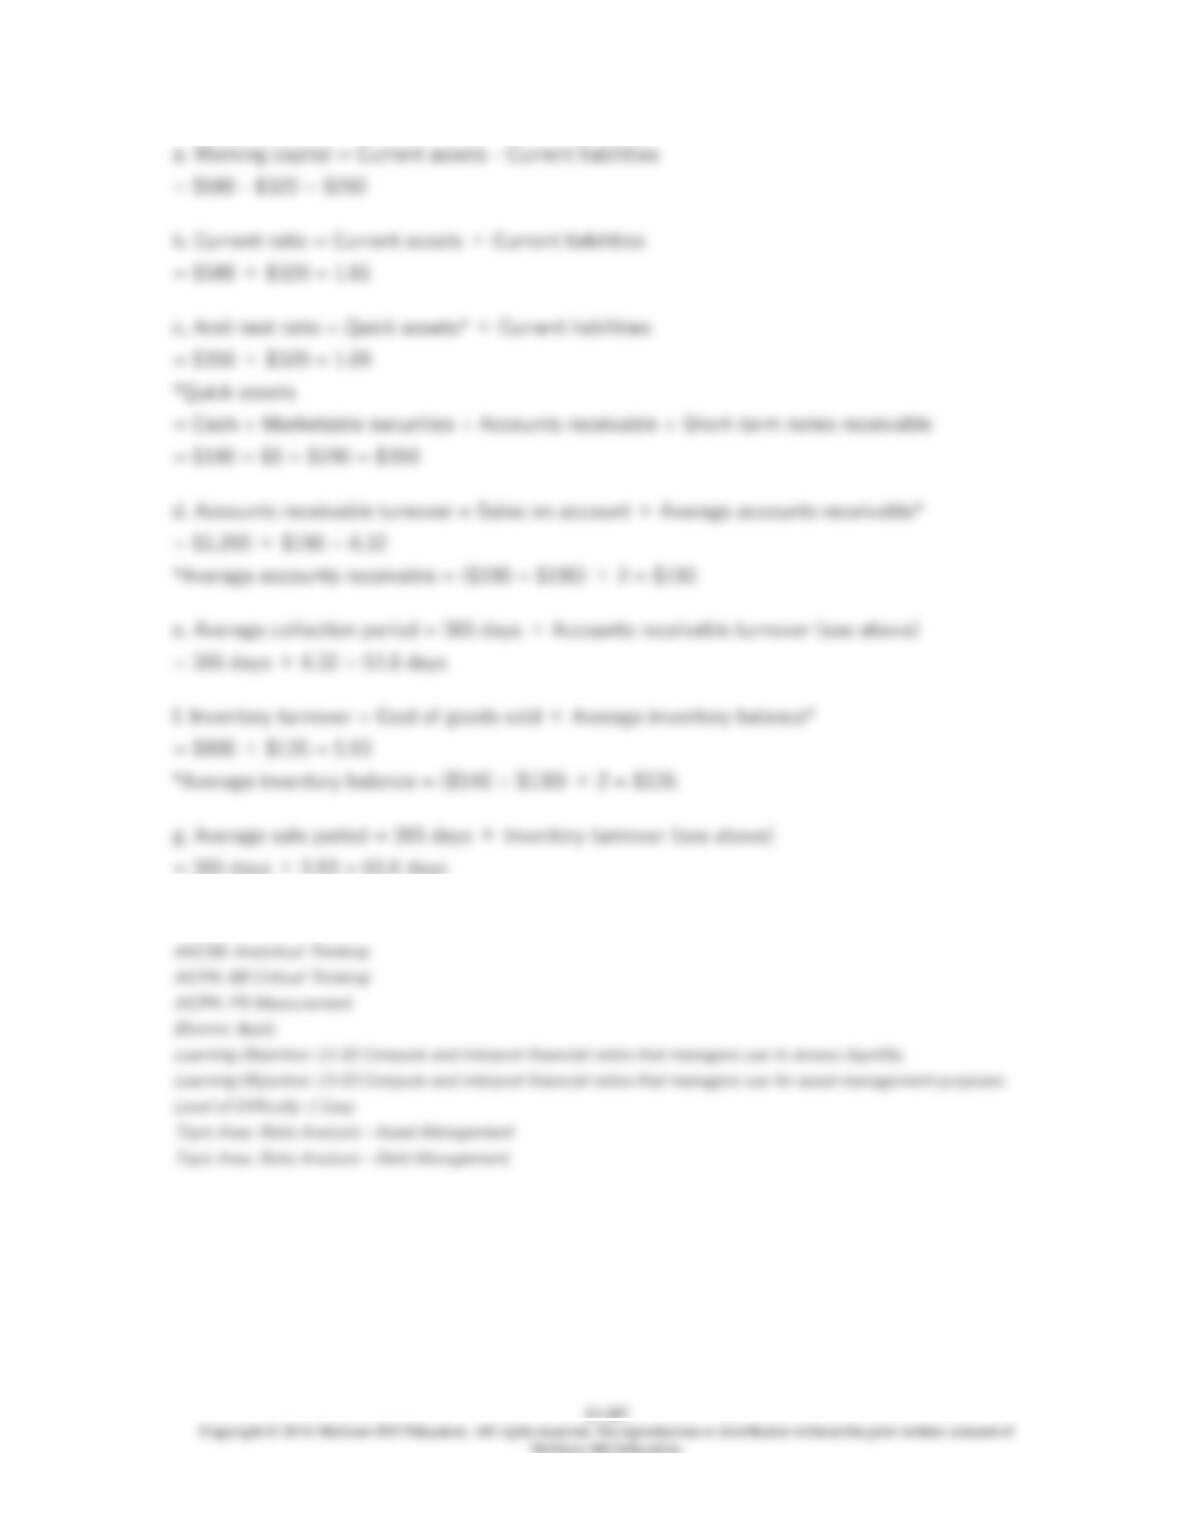

13-268
250. Wegener Corporation’s most recent balance sheet and income statement appear below:
Balance Sheet
December 31, Year 2 and Year 1
(in thousands of dollars)
Assets Year 2 Year 1
Current assets:
Cash $90 $110
Accounts receivable 220 270
Inventory 130 150
Prepaid expenses 70 80
Total current assets 510 610
Plant and equipment, net 1,000 920
Total assets $1,510 $1,530
Liabilities and Stockholders’ Equity
Current liabilities:
Accounts payable $90 $110
Accrued liabilities 60 60
Notes payable, short term 50 60
Total current liabilities 200 230
Bonds payable 130 140
Total liabilities 330 370
Stockholders’ equity:
Common stock, $1 par value 400 400
Additional paid-in capital-common stock 240 240
Retained earnings 540 520
Total stockholders’ equity 1,180 1,160
Total liabilities & stockholders’ equity $1,510 $1,530
Income Statement
For the Year Ended December 31, Year 2
(in thousands of dollars)
Sales (all on account) $1,400
Cost of goods sold 860
Gross margin 540
Selling and administrative expense 450
Net operating income 90

13-269
Interest expense 19
Net income before taxes 71
Income taxes (30%) 21
Net income $50
Required:
Compute the following for Year 2:
a. Working capital.
b. Current ratio.
c. Acid-test ratio.
d. Accounts receivable turnover.
e. Average collection period.
f. Inventory turnover.
g. Average sale period.
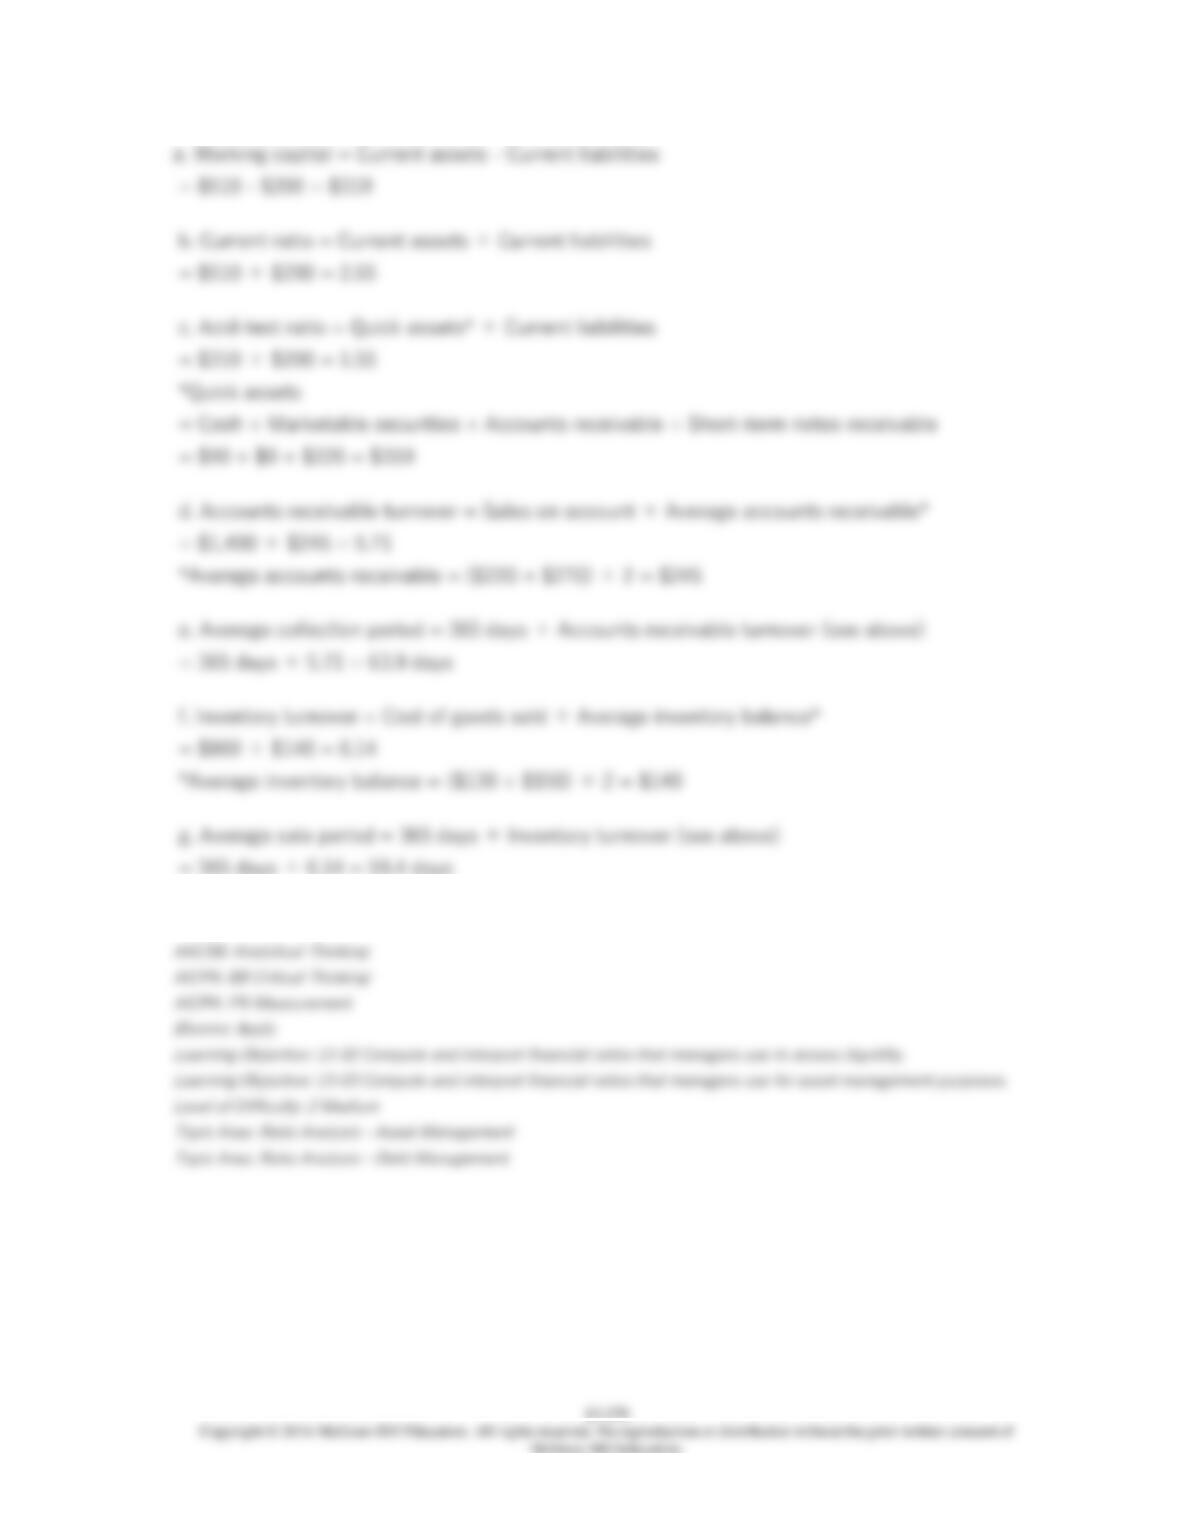

13-271
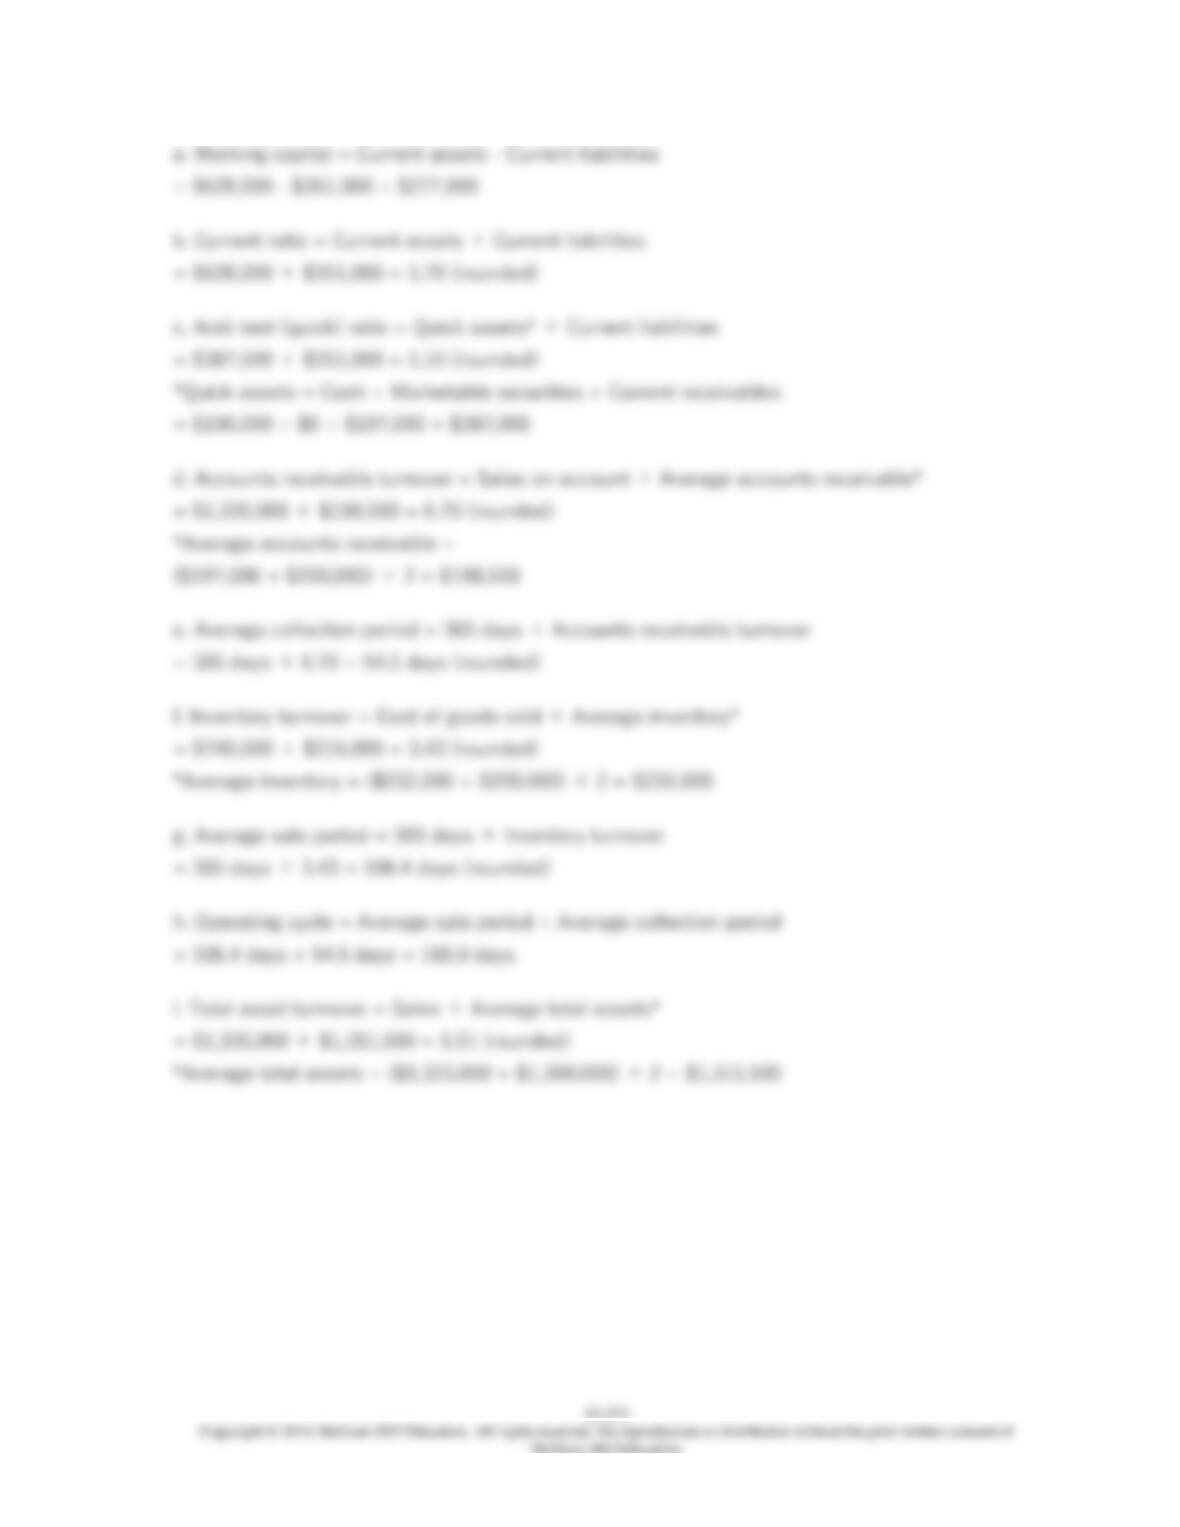
251. Abdool Corporation has provided the following financial data:
Balance Sheet
December 31, Year 2 and Year 1
Assets Year 2 Year 1
Current assets:
Cash $190,000 $190,000
Accounts receivable 197,000 200,000
Inventory 232,000 200,000
Prepaid expenses 9,000 10,000
Total current assets 628,000 600,000
Plant and equipment, net 695,000 700,000
Total assets $1,323,000 $1,300,000
Liabilities and Stockholders’ Equity
Current liabilities:
Accounts payable $206,000 $200,000
Accrued liabilities 104,000 90,000
Notes payable, short term 41,000 50,000
Total current liabilities 351,000 340,000
Bonds payable 130,000 130,000
Total liabilities 481,000 470,000
Stockholders’ equity:
Common stock, $2 par value 160,000 160,000
Additional paid-in capital-common stock 70,000 70,000
Retained earnings 612,000 600,000
Total stockholders’ equity 842,000 830,000
Total liabilities & stockholders’ equity $1,323,000 $1,300,000
Income Statement
For the Year Ended December 31, Year 2
Sales (all on account) $1,330,000
Cost of goods sold 740,000
Gross margin 590,000
Operating expenses 555,000
Net operating income 35,000

13-272
Interest expense 11,000
Net income before taxes 24,000
Income taxes (30%) 7,200
Net income $16,800
Required:
a. What is the company’s working capital at the end of Year 2?
b. What is the company’s current ratio at the end of Year 2?
c. What is the company’s acid-test (quick) ratio at the end of Year 2?
d. What is the company’s accounts receivable turnover for Year 2?
e. What is the company’s average collection period (age of receivables) for Year 2?
f. What is the company’s inventory turnover for Year 2?
g. What is the company’s average sale period (turnover in days) for Year 2?
h. What is the company’s operating cycle for Year 2?
i. What is the company’s total asset turnover for Year 2?

13-275
252. Financial statements for Rardin Corporation appear below:
Rardin Corporation
Balance Sheet
December 31, Year 2 and Year 1
(dollars in thousands)
Year 2 Year 1
Current assets:
Cash and marketable securities $160 $160
Accounts receivable, net 180 160
Inventory 160 180
Prepaid expenses 80 70
Total current assets 580 570
Noncurrent assets:
Plant & equipment, net 1,180 1,110
Total assets $1,760 $1,680
Current liabilities:
Accounts payable $130 $140
Accrued liabilities 40 60
Notes payable, short term 290 280
Total current liabilities 460 480
Noncurrent liabilities:
Bonds payable 260 300
Total liabilities 720 780
Stockholders’ equity:
Common stock, $5 par 160 160
Additional paid-in capital-common stock 250 250
Retained earnings 630 490
Total stockholders’ equity 1,040 900
Total liabilities & stockholders’ equity $1,760 $1,680
Rardin Corporation
Income Statement
For the Year Ended December 31, Year 2
(dollars in thousands)
Sales (all on account) $1,900
Cost of goods sold 1,330

13-276
Gross margin 570
Selling and administrative expense 220
Net operating income 350
Interest expense 30
Net income before taxes 320
Income taxes (30%) 96
Net income $224
Required:
Compute the following for Year 2:
a. Current ratio.
b. Acid-test ratio.
c. Average collection period.
d. Inventory turnover.
e. Times interest earned.
f. Debt-to-equity ratio.

13-278
253. Mondok Corporation has provided the following financial data:
Balance Sheet
December 31, Year 2 and Year 1
Assets Year 2 Year 1
Current assets:
Cash $139,000 $140,000
Accounts receivable 222,000 230,000
Inventory 109,000 120,000
Prepaid expenses 68,000 70,000
Total current assets 538,000 560,000
Plant and equipment, net 857,000 800,000
Total assets $1,395,000 $1,360,000
Liabilities and Stockholders’ Equity
Current liabilities:
Accounts payable $186,000 $180,000
Accrued liabilities 34,000 30,000
Notes payable, short term 64,000 60,000
Total current liabilities 284,000 270,000
Bonds payable 130,000 130,000
Total liabilities 414,000 400,000
Stockholders’ equity:
Common stock, $2 par value 100,000 100,000
Additional paid-in capital-common stock 90,000 90,000
Retained earnings 791,000 770,000
Total stockholders’ equity 981,000 960,000
Total liabilities & stockholders’ equity $1,395,000 $1,360,000
Income Statement
For the Year Ended December 31, Year 2
Sales (all on account) $1,280,000
Cost of goods sold 840,000
Gross margin 440,000
Operating expenses 387,231
Net operating income 52,769
Interest expense 12,000
Net income before taxes 40,769
Income taxes (35%) 14,269

13-279
Net income $26,500
Required:
a. What is the company’s working capital at the end of Year 2?
b. What is the company’s current ratio at the end of Year 2?
c. What is the company’s acid-test (quick) ratio at the end of Year 2?
d. What is the company’s accounts receivable turnover for Year 2?
e. What is the company’s average collection period (age of receivables) for Year 2?
f. What is the company’s inventory turnover for Year 2?
g. What is the company’s average sale period (turnover in days) for Year 2?
h. What is the company’s operating cycle for Year 2?
i. What is the company’s total asset turnover for Year 2?
j. What is the company’s times interest earned for Year 2?
k. What is the company’s debt–to-equity ratio at the end of Year 2?
l. What is the company’s equity multiplier at the end of Year 2?