Net operating income
51,308
Interest expense
19,000
Net income before taxes
32,308
Income taxes (35%)
11,308
Net income
$21,000
Dividends on common stock during Year 2 totaled $8,000. The market price of common
stock at the end of Year 2 was $2.02 per share.
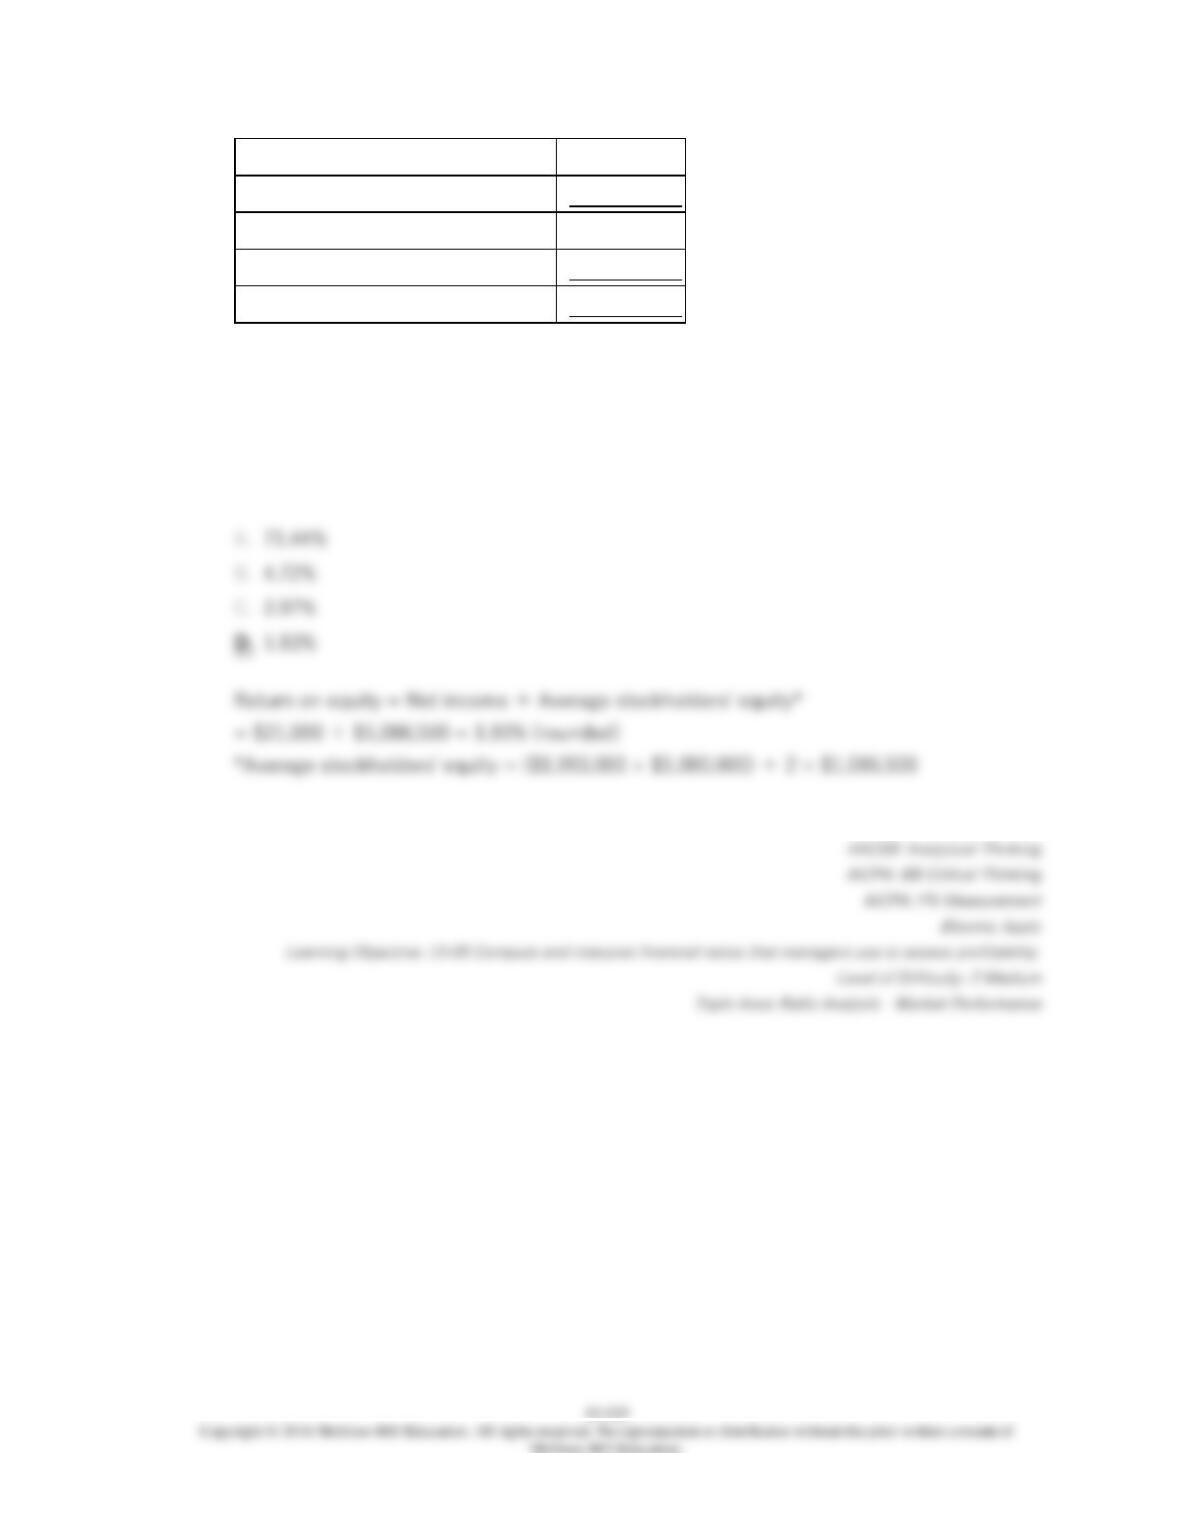
The company’s return on equity for Year 2 is closest to:
220.
Doonan Corporation has provided the following financial data from its balance sheet and
income statement:
Year 2
Year 1
Total assets
$1,489,000
$1,440,000
Stockholders’ equity:
Common stock, $4 par value
$360,000
$360,000
Additional paid-in capital-common stock
$70,000
$70,000
Retained earnings
$570,000
$550,000
Total stockholders’ equity
$1,000,000
$980,000
Interest expense
$15,000
Income taxes (35%)
$14,162
Net income
$26,300
The market price of common stock at the end of Year 2 was $4.79 per share.
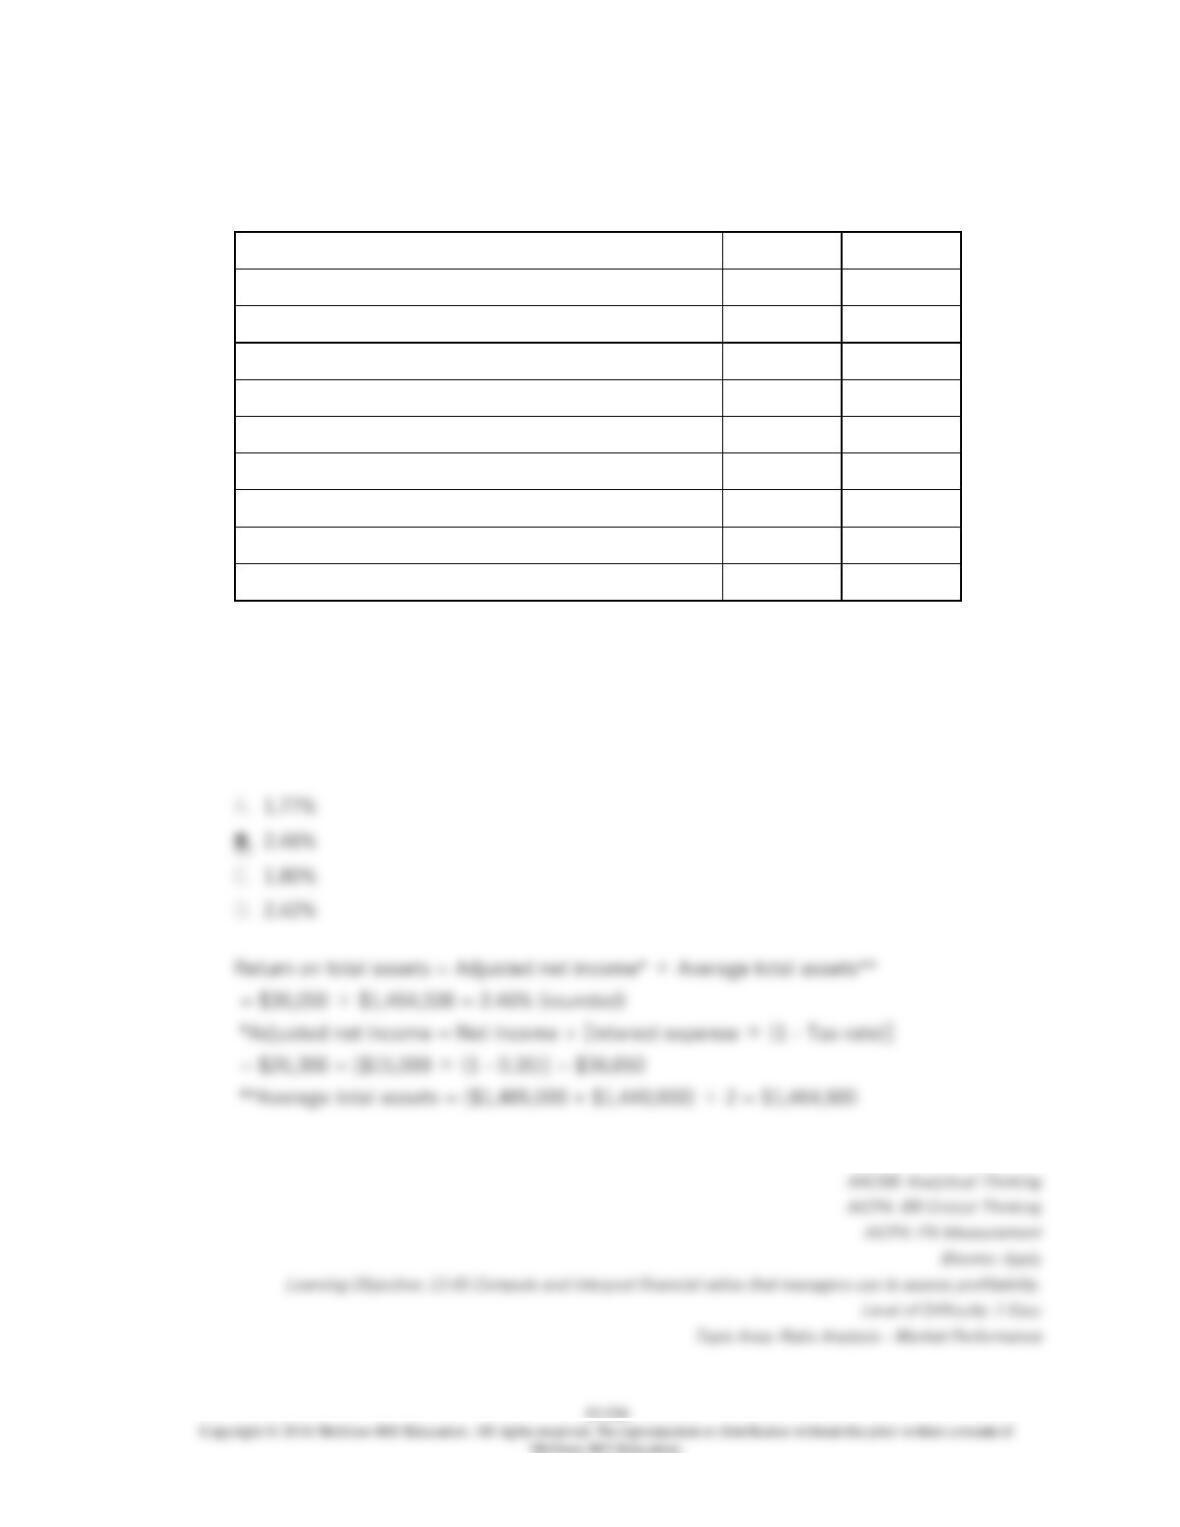
The company’s return on total assets for Year 2 is closest to:
221.
Doonan Corporation has provided the following financial data from its balance sheet and
income statement:
Year 2
Year 1
Total assets
$1,489,000
$1,440,000
Stockholders’ equity:
Common stock, $4 par value
$360,000
$360,000
Additional paid-in capital-common stock
$70,000
$70,000
Retained earnings
$570,000
$550,000
Total stockholders’ equity
$1,000,000
$980,000
Interest expense
$15,000
Income taxes (35%)
$14,162
Net income
$26,300
The market price of common stock at the end of Year 2 was $4.79 per share.
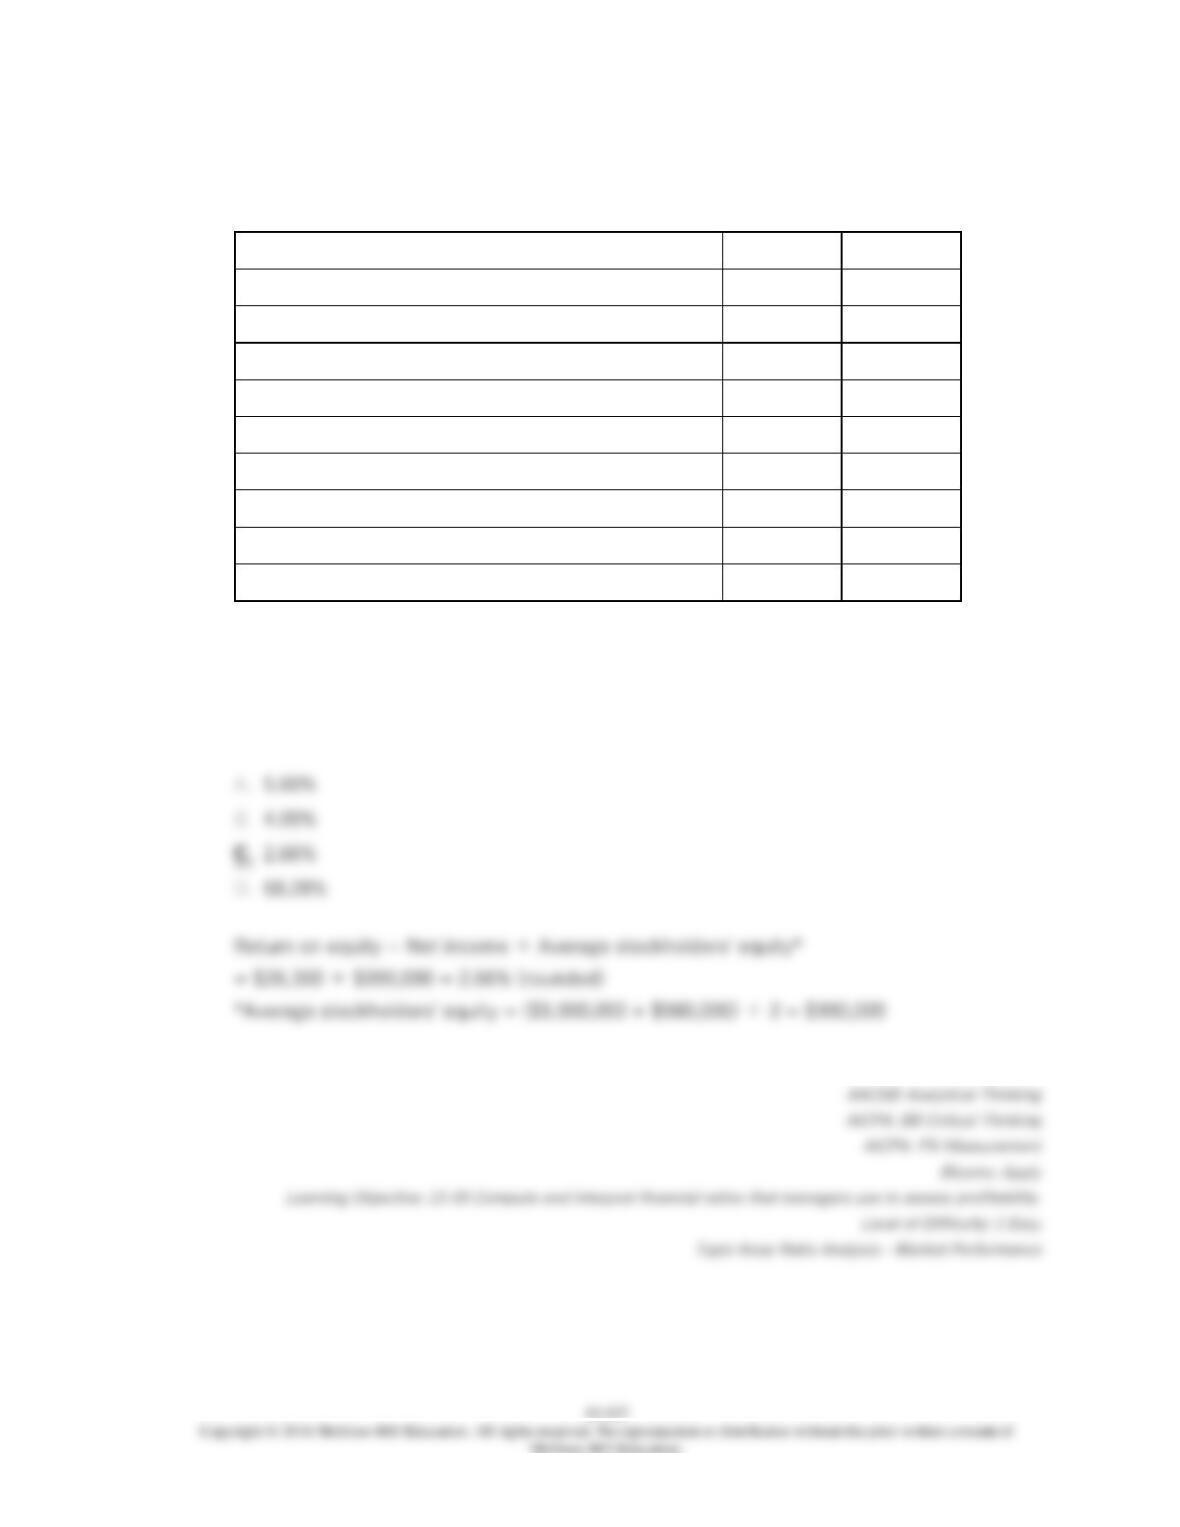
The company’s return on equity for Year 2 is closest to:
222.
Doonan Corporation has provided the following financial data from its balance sheet and
income statement:
Year 2
Year 1
223.
Doonan Corporation has provided the following financial data from its balance sheet and
income statement:
Year 2
Year 1
Total assets
$1,489,000
$1,440,000
Stockholders’ equity:
Common stock, $4 par value
$360,000
$360,000
Additional paid-in capital-common stock
$70,000
$70,000
Retained earnings
$570,000
$550,000
Total stockholders’ equity
$1,000,000
$980,000
Interest expense
$15,000
Income taxes (35%)
$14,162
Net income
$26,300
The market price of common stock at the end of Year 2 was $4.79 per share.
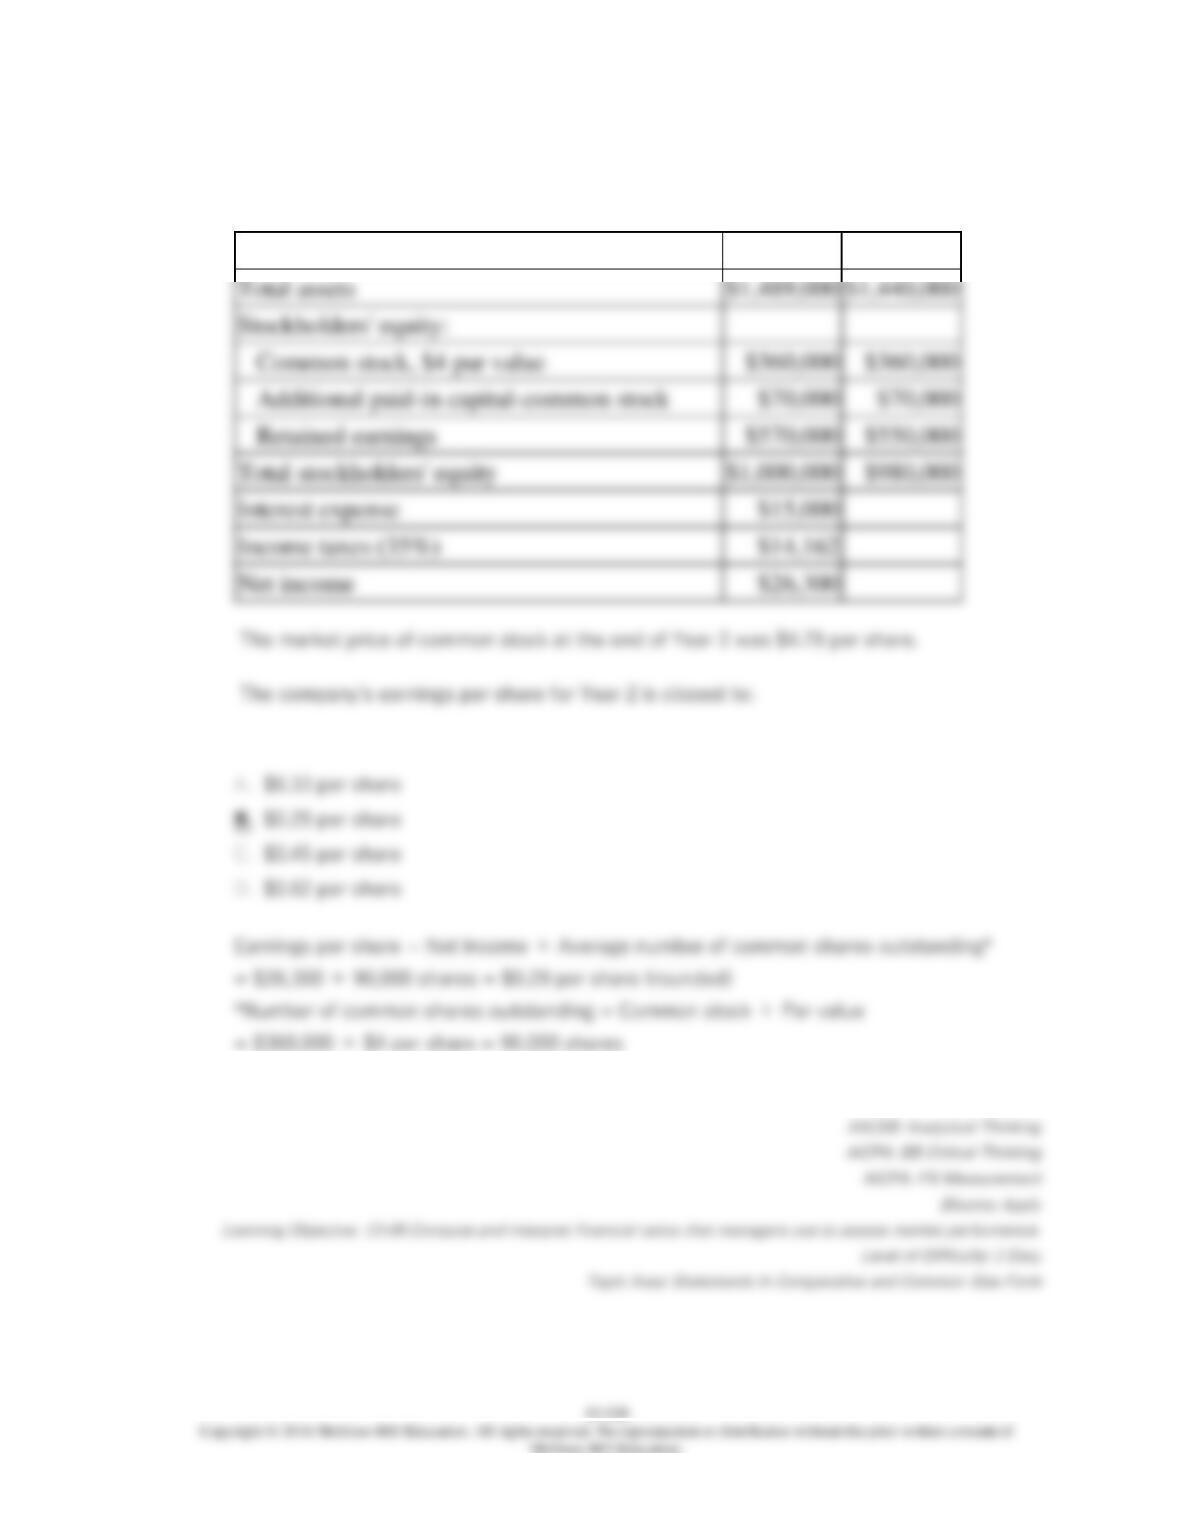
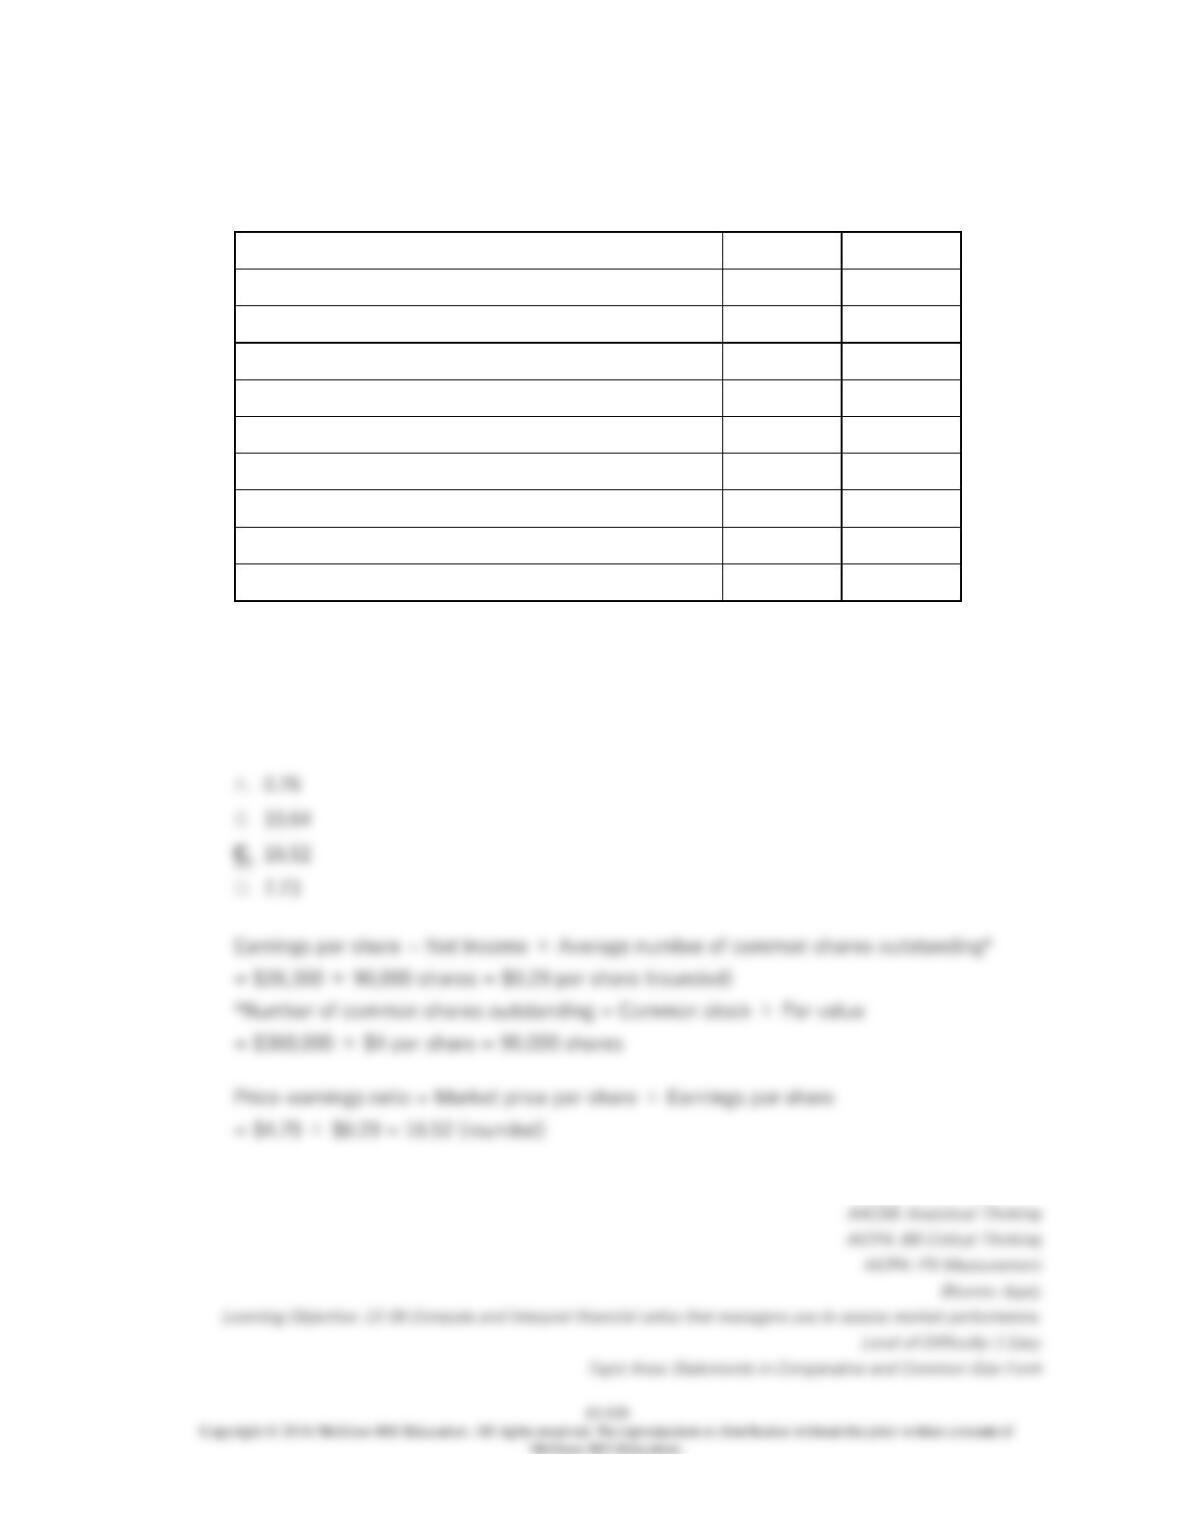
The company’s price-earnings ratio for Year 2 is closest to:

13–531
224.
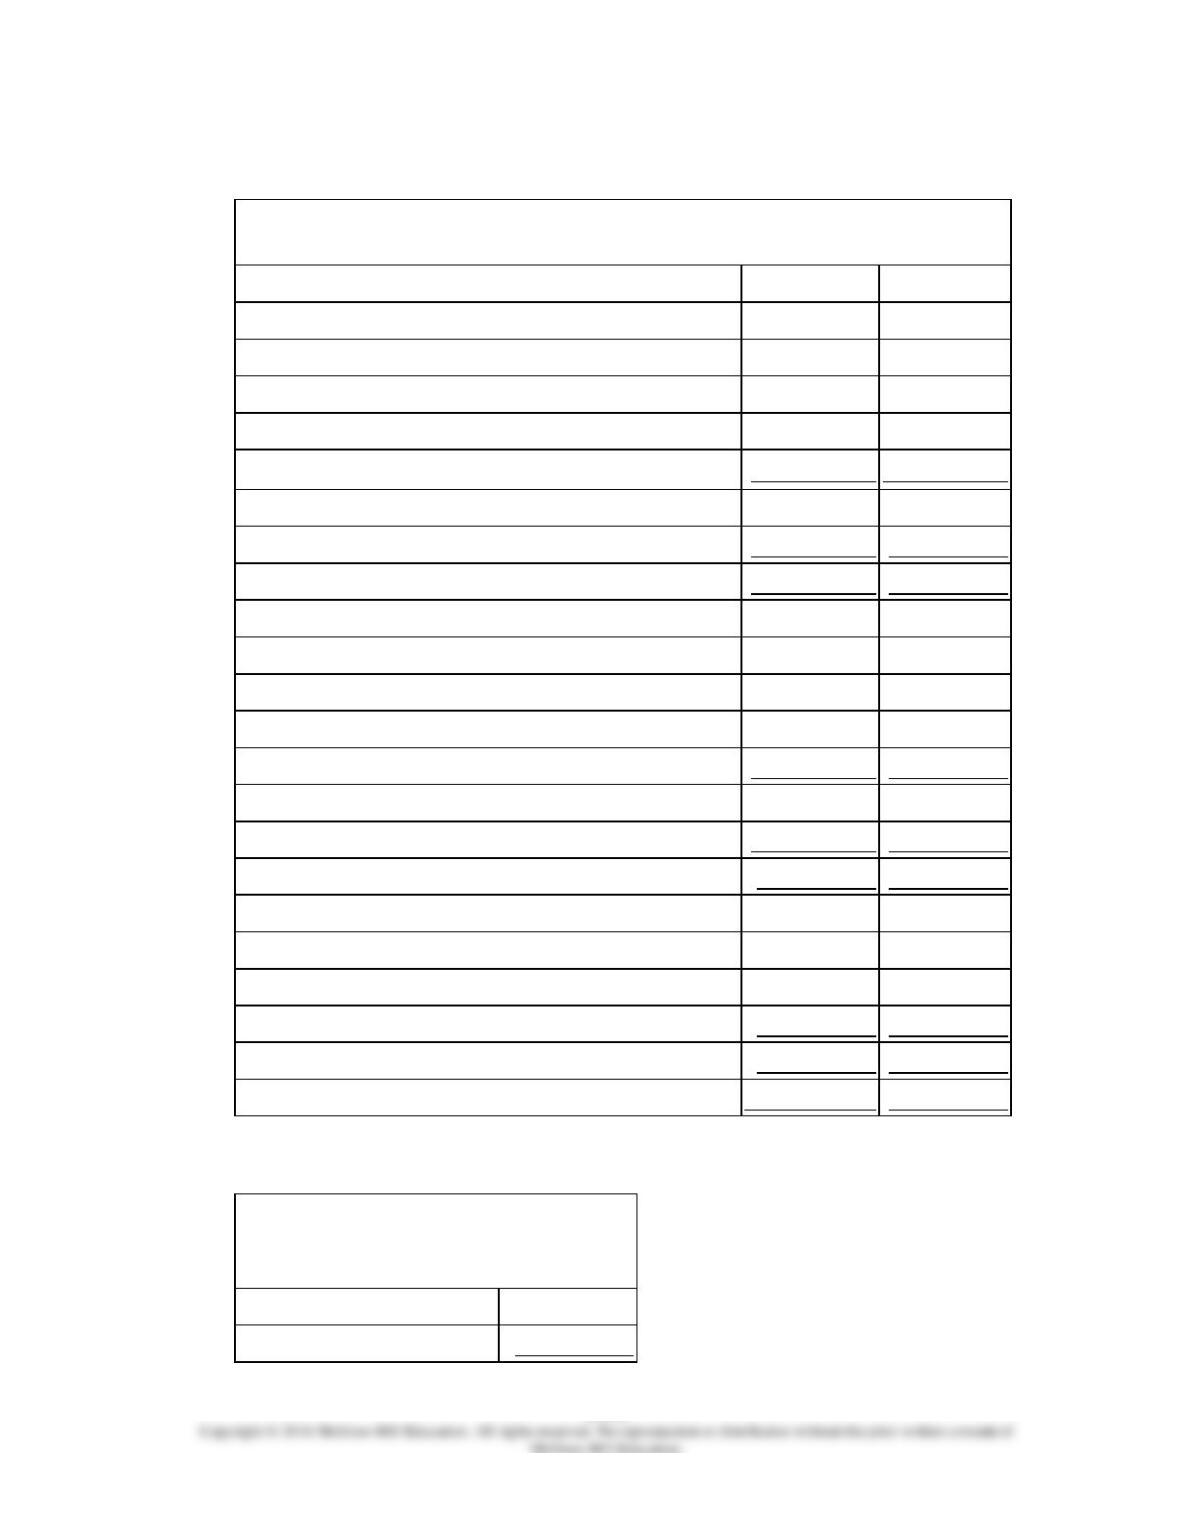
Settles Corporation has provided the following financial data:
Balance Sheet
December 31, Year 2 and Year 1
Assets
Year 2
Year 1
Current assets:
Cash
$142,000
$110,000
Accounts receivable
104,000
120,000
Inventory
119,000
120,000
Prepaid expenses
37,000
40,000
Total current assets
402,000
390,000
Plant and equipment, net
717,000
720,000
Total assets
$1,119,000
$1,110,000
Liabilities and Stockholders’ Equity
Current liabilities:
Accounts payable
$156,000
$180,000
Accrued liabilities
84,000
70,000
Notes payable, short term
66,000
60,000
Total current liabilities
306,000
310,000
Bonds payable
250,000
250,000
Total liabilities
556,000
560,000
Stockholders’ equity:
Common stock, $4 par value
240,000
240,000
Additional paid-in capital-common stock
90,000
90,000
Retained earnings
233,000
220,000
Total stockholders’ equity
563,000
550,000
Total liabilities & stockholders’ equity
$1,119,000
$1,110,000
Income Statement—Year 2
For the Year Ended December 31,
Year 2
Sales (all on account)
$1,360,000
Cost of goods sold
850,000
Gross margin
510,000
Operating expenses
462,692
Net operating income
47,308
Interest expense
19,000
Net income before
taxes
28,308
Income taxes (35%)
9,908
Net income
$18,400
Dividends on common stock during Year 2 totaled $5,400. The market price of common
stock at the end of Year 2 was $5.89 per share.
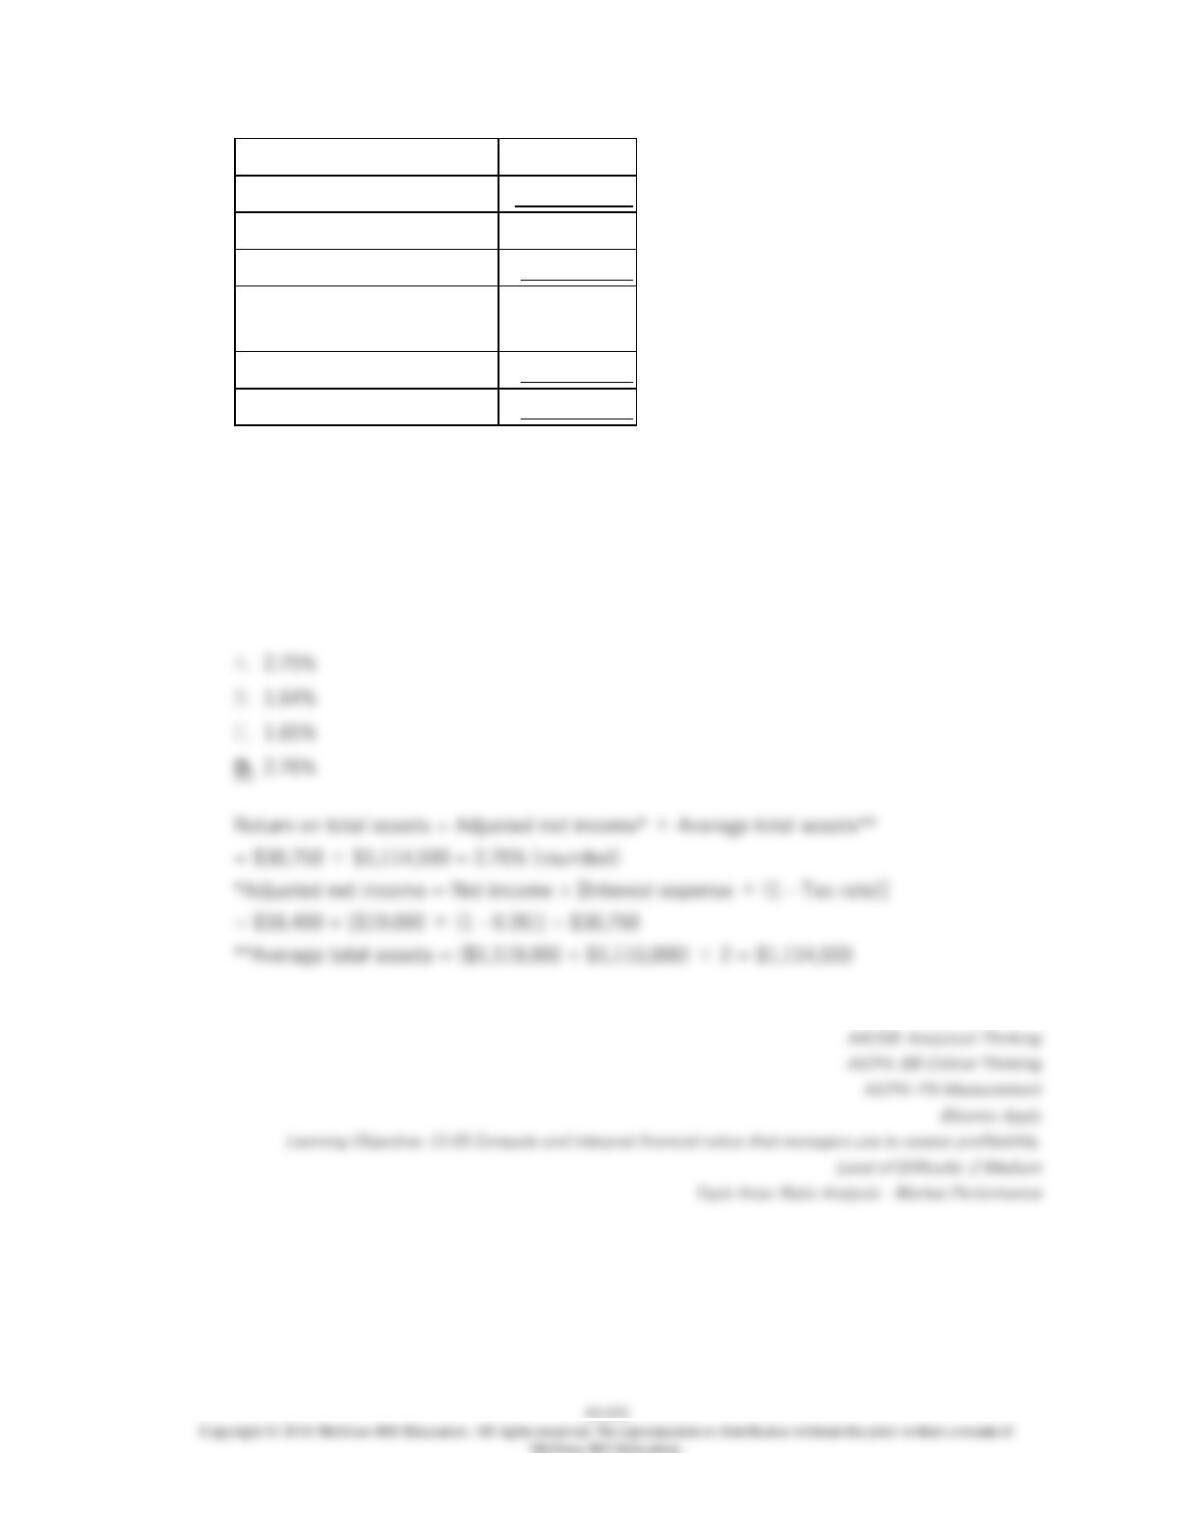
The company’s return on total assets for Year 2 is closest to:

13–533
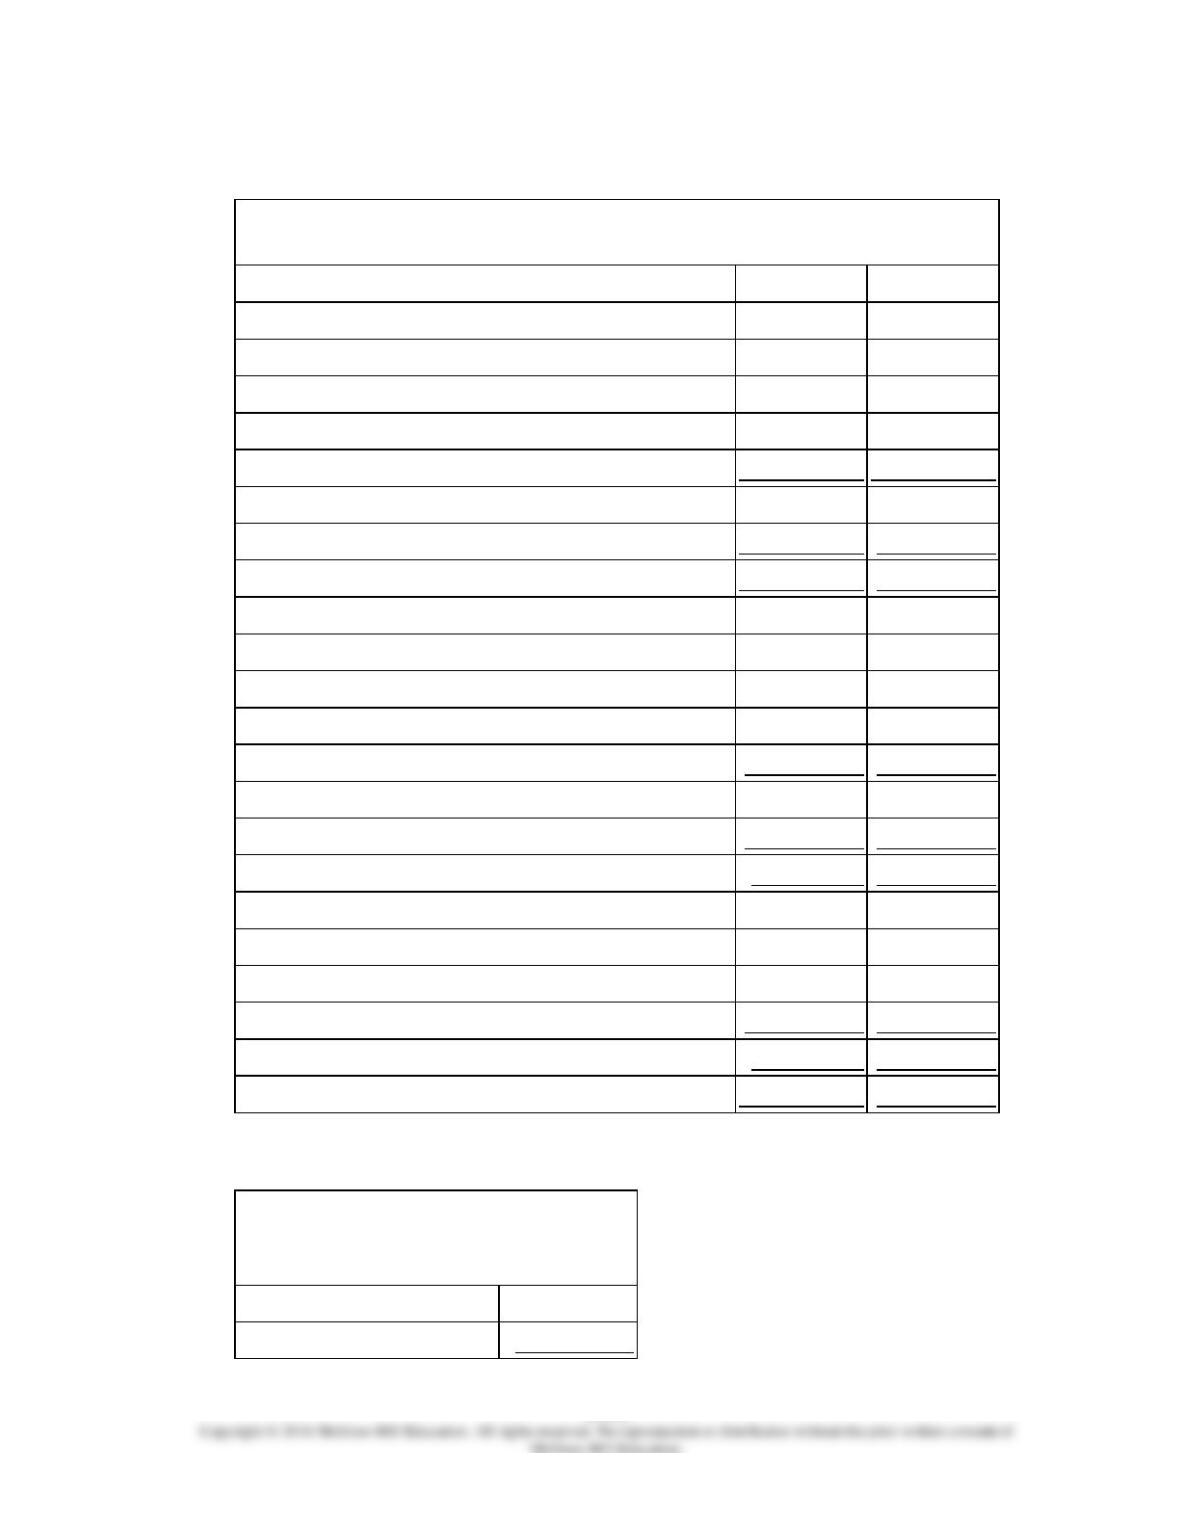
225.
Settles Corporation has provided the following financial data:
Balance Sheet
December 31, Year 2 and Year 1
Assets
Year 2
Year 1
Current assets:
Cash
$142,000
$110,000
Accounts receivable
104,000
120,000
Inventory
119,000
120,000
Prepaid expenses
37,000
40,000
Total current assets
402,000
390,000
Plant and equipment, net
717,000
720,000
Total assets
$1,119,000
$1,110,000
Liabilities and Stockholders’ Equity
Current liabilities:
Accounts payable
$156,000
$180,000
Accrued liabilities
84,000
70,000
Notes payable, short term
66,000
60,000
Total current liabilities
306,000
310,000
Bonds payable
250,000
250,000
Total liabilities
556,000
560,000
Stockholders’ equity:
Common stock, $4 par value
240,000
240,000
Additional paid-in capital-common stock
90,000
90,000
Retained earnings
233,000
220,000
Total stockholders’ equity
563,000
550,000
Total liabilities & stockholders’ equity
$1,119,000
$1,110,000
Income Statement—Year 2
For the Year Ended December 31,
Year 2
Sales (all on account)
$1,360,000
Cost of goods sold
850,000
Gross margin
510,000
Operating expenses
462,692
Net operating income
47,308
Interest expense
19,000
Net income before
taxes
28,308
Income taxes (35%)
9,908
Net income
$18,400
Dividends on common stock during Year 2 totaled $5,400. The market price of common
stock at the end of Year 2 was $5.89 per share.
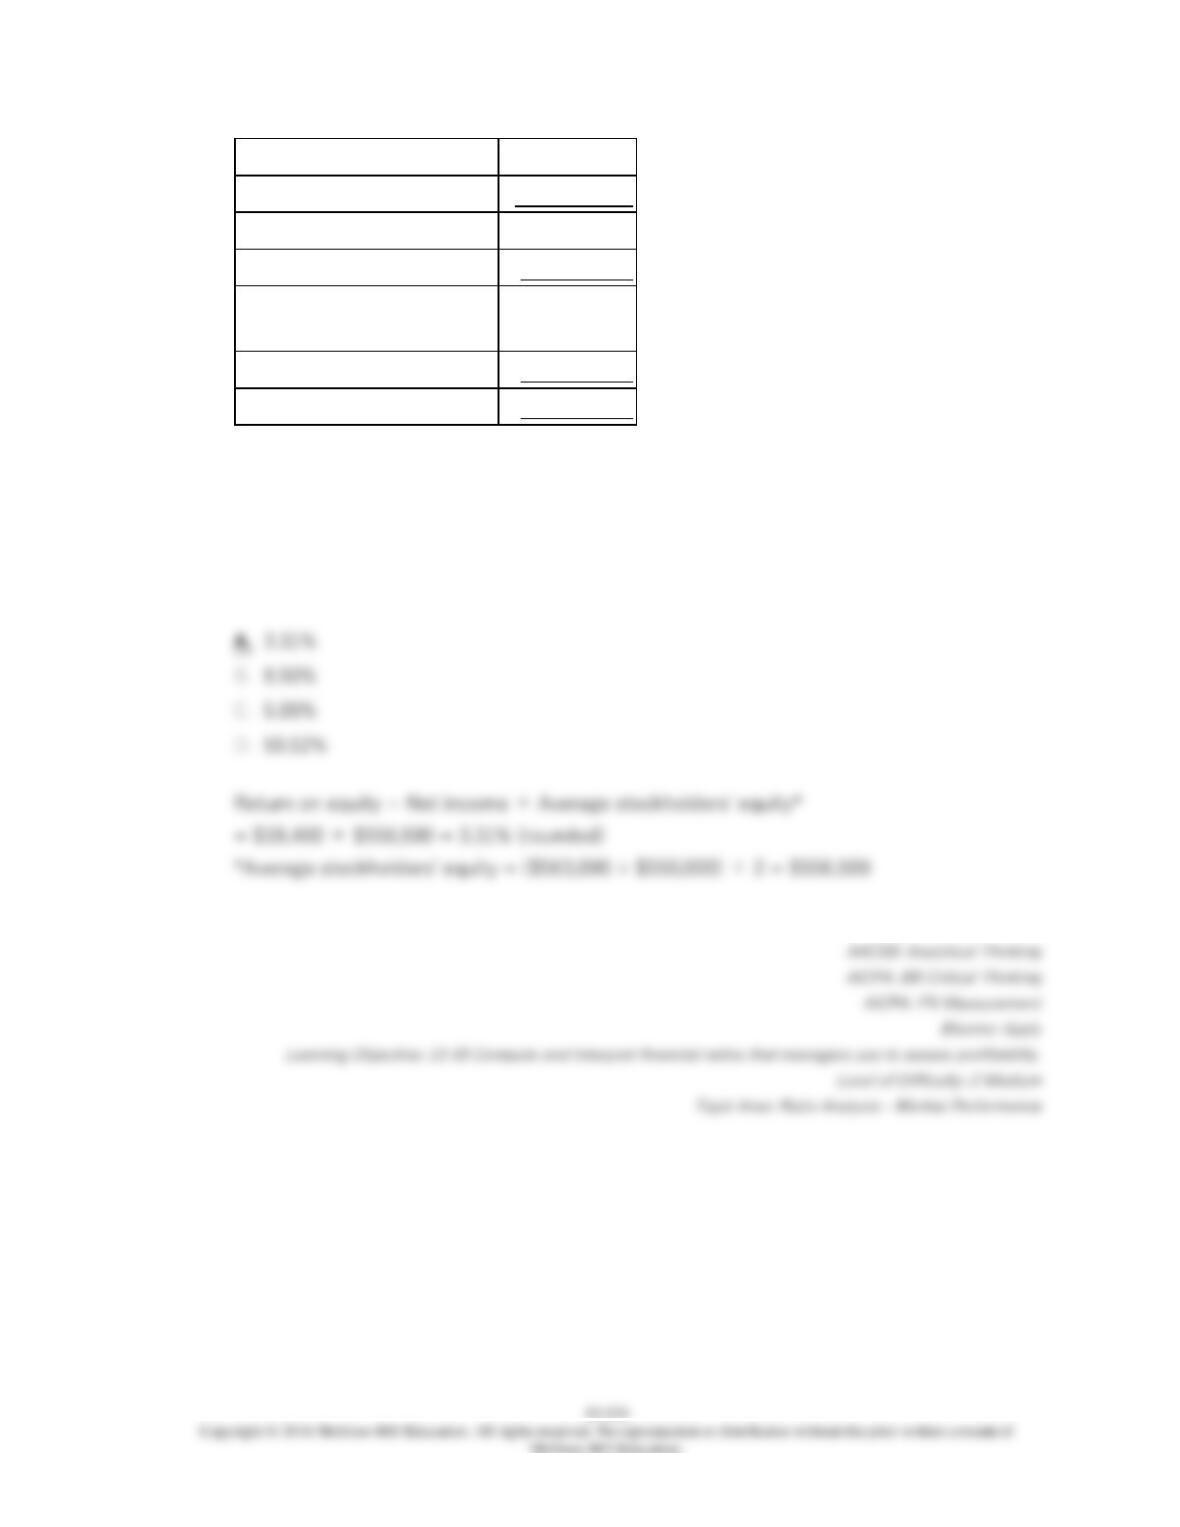
The company’s return on equity for Year 2 is closest to:
13–535
226.
Settles Corporation has provided the following financial data:
Balance Sheet
December 31, Year 2 and Year 1
Assets
Year 2
Year 1
Current assets:
Cash
$142,000
$110,000
Accounts receivable
104,000
120,000
Inventory
119,000
120,000
Prepaid expenses
37,000
40,000
Total current assets
402,000
390,000
Plant and equipment, net
717,000
720,000
Total assets
$1,119,000
$1,110,000
Liabilities and Stockholders’ Equity
Current liabilities:
Accounts payable
$156,000
$180,000
Accrued liabilities
84,000
70,000
Notes payable, short term
66,000
60,000
Total current liabilities
306,000
310,000
Bonds payable
250,000
250,000
Total liabilities
556,000
560,000
Stockholders’ equity:
Common stock, $4 par value
240,000
240,000
Additional paid-in capital-common stock
90,000
90,000
Retained earnings
233,000
220,000
Total stockholders’ equity
563,000
550,000
Total liabilities & stockholders’ equity
$1,119,000
$1,110,000
Income Statement—Year 2
For the Year Ended December 31,
Year 2
Sales (all on account)
$1,360,000
Cost of goods sold
850,000
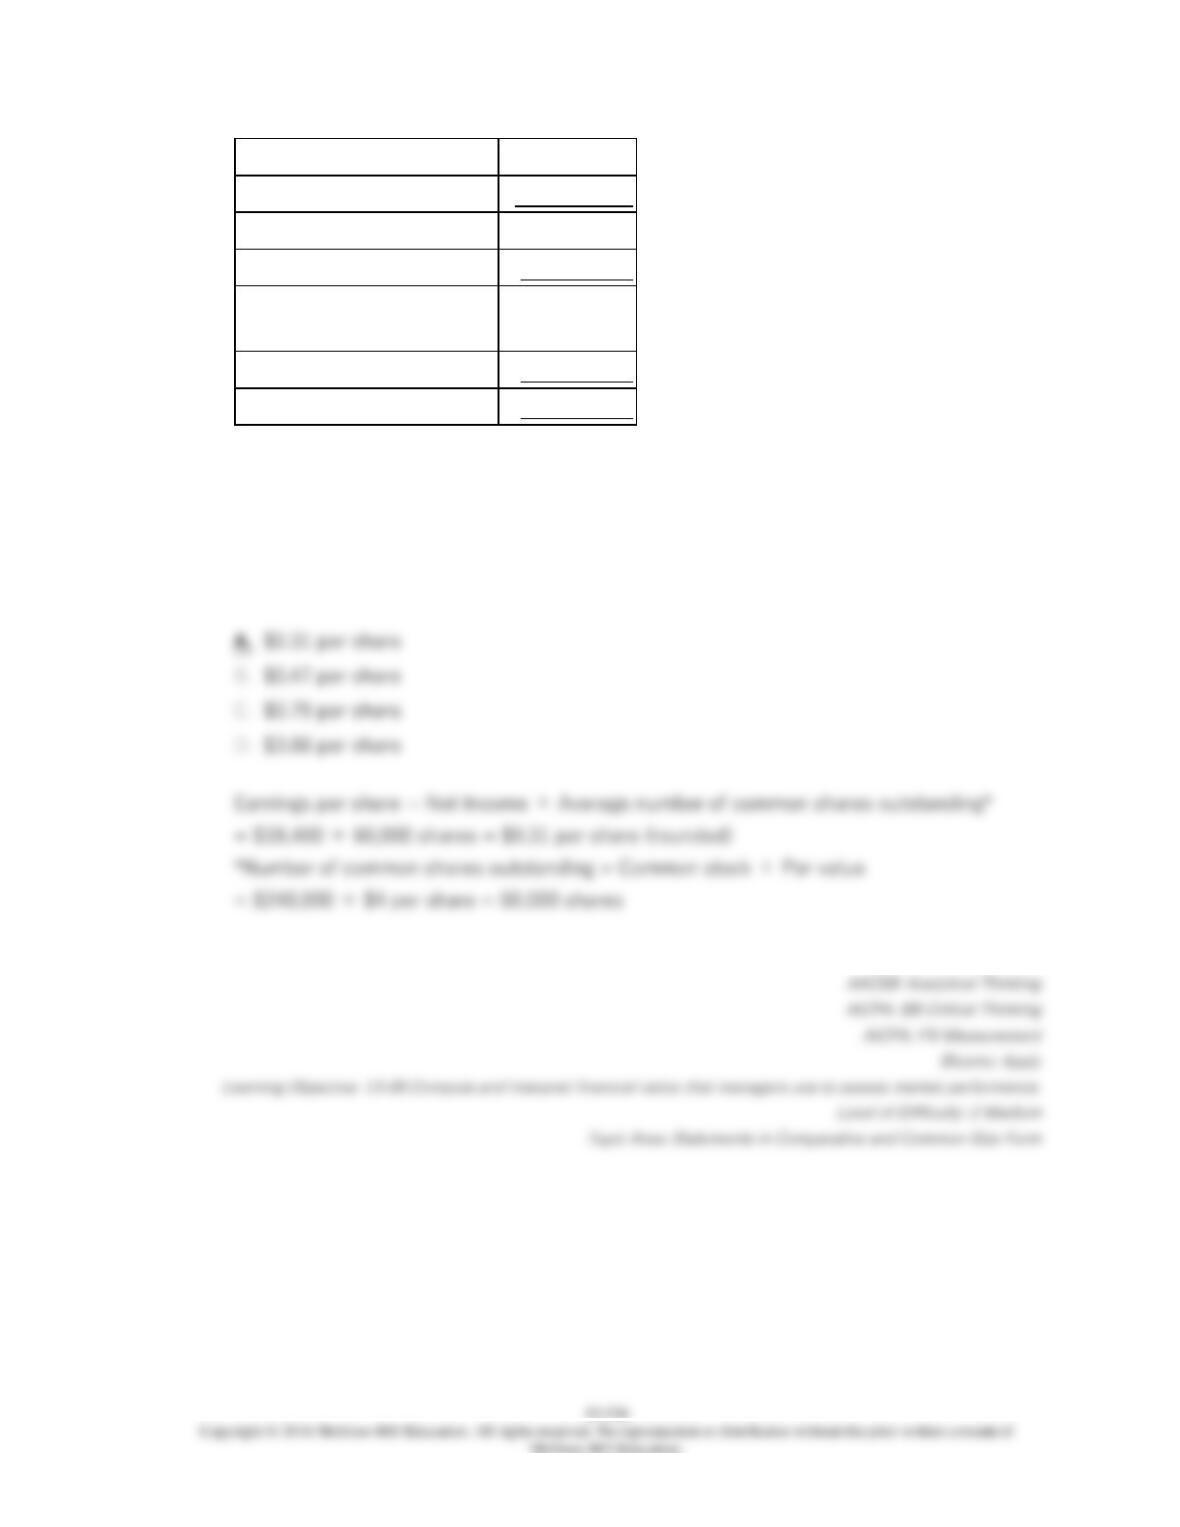
Gross margin
510,000
Operating expenses
462,692
Net operating income
47,308
Interest expense
19,000
Net income before
taxes
28,308
Income taxes (35%)
9,908
Net income
$18,400
Dividends on common stock during Year 2 totaled $5,400. The market price of common
stock at the end of Year 2 was $5.89 per share.
The company’s earnings per share for Year 2 is closest to:
13–537
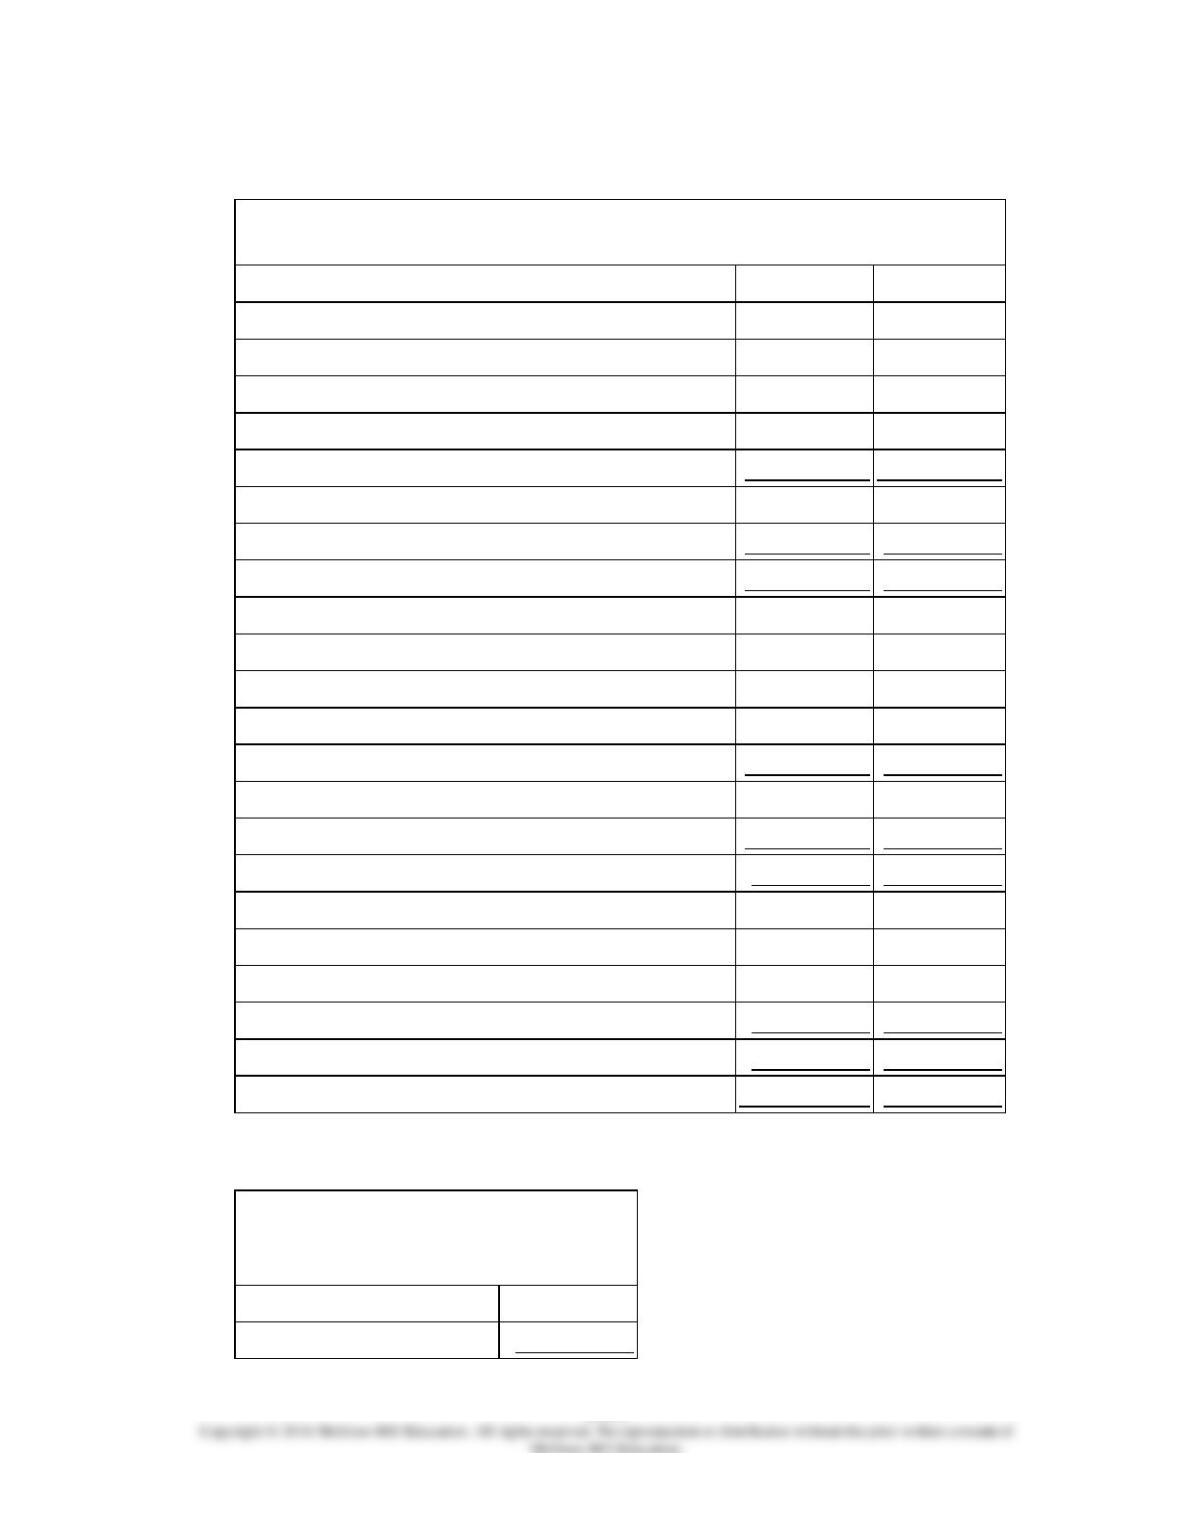
227.
Settles Corporation has provided the following financial data:
Balance Sheet
December 31, Year 2 and Year 1
Assets
Year 2
Year 1
Current assets:
Cash
$142,000
$110,000
Accounts receivable
104,000
120,000
Inventory
119,000
120,000
Prepaid expenses
37,000
40,000
Total current assets
402,000
390,000
Plant and equipment, net
717,000
720,000
Total assets
$1,119,000
$1,110,000
Liabilities and Stockholders’ Equity
Current liabilities:
Accounts payable
$156,000
$180,000
Accrued liabilities
84,000
70,000
Notes payable, short term
66,000
60,000
Total current liabilities
306,000
310,000
Bonds payable
250,000
250,000
Total liabilities
556,000
560,000
Stockholders’ equity:
Common stock, $4 par value
240,000
240,000
Additional paid-in capital-common stock
90,000
90,000
Retained earnings
233,000
220,000
Total stockholders’ equity
563,000
550,000
Total liabilities & stockholders’ equity
$1,119,000
$1,110,000
Income Statement—Year 2
For the Year Ended December 31,
Year 2
Sales (all on account)
$1,360,000
Cost of goods sold
850,000
Gross margin
510,000
Operating expenses
462,692
Net operating income
47,308
Interest expense
19,000
Net income before
taxes
28,308
Income taxes (35%)
9,908
Net income
$18,400
Dividends on common stock during Year 2 totaled $5,400. The market price of common
stock at the end of Year 2 was $5.89 per share.
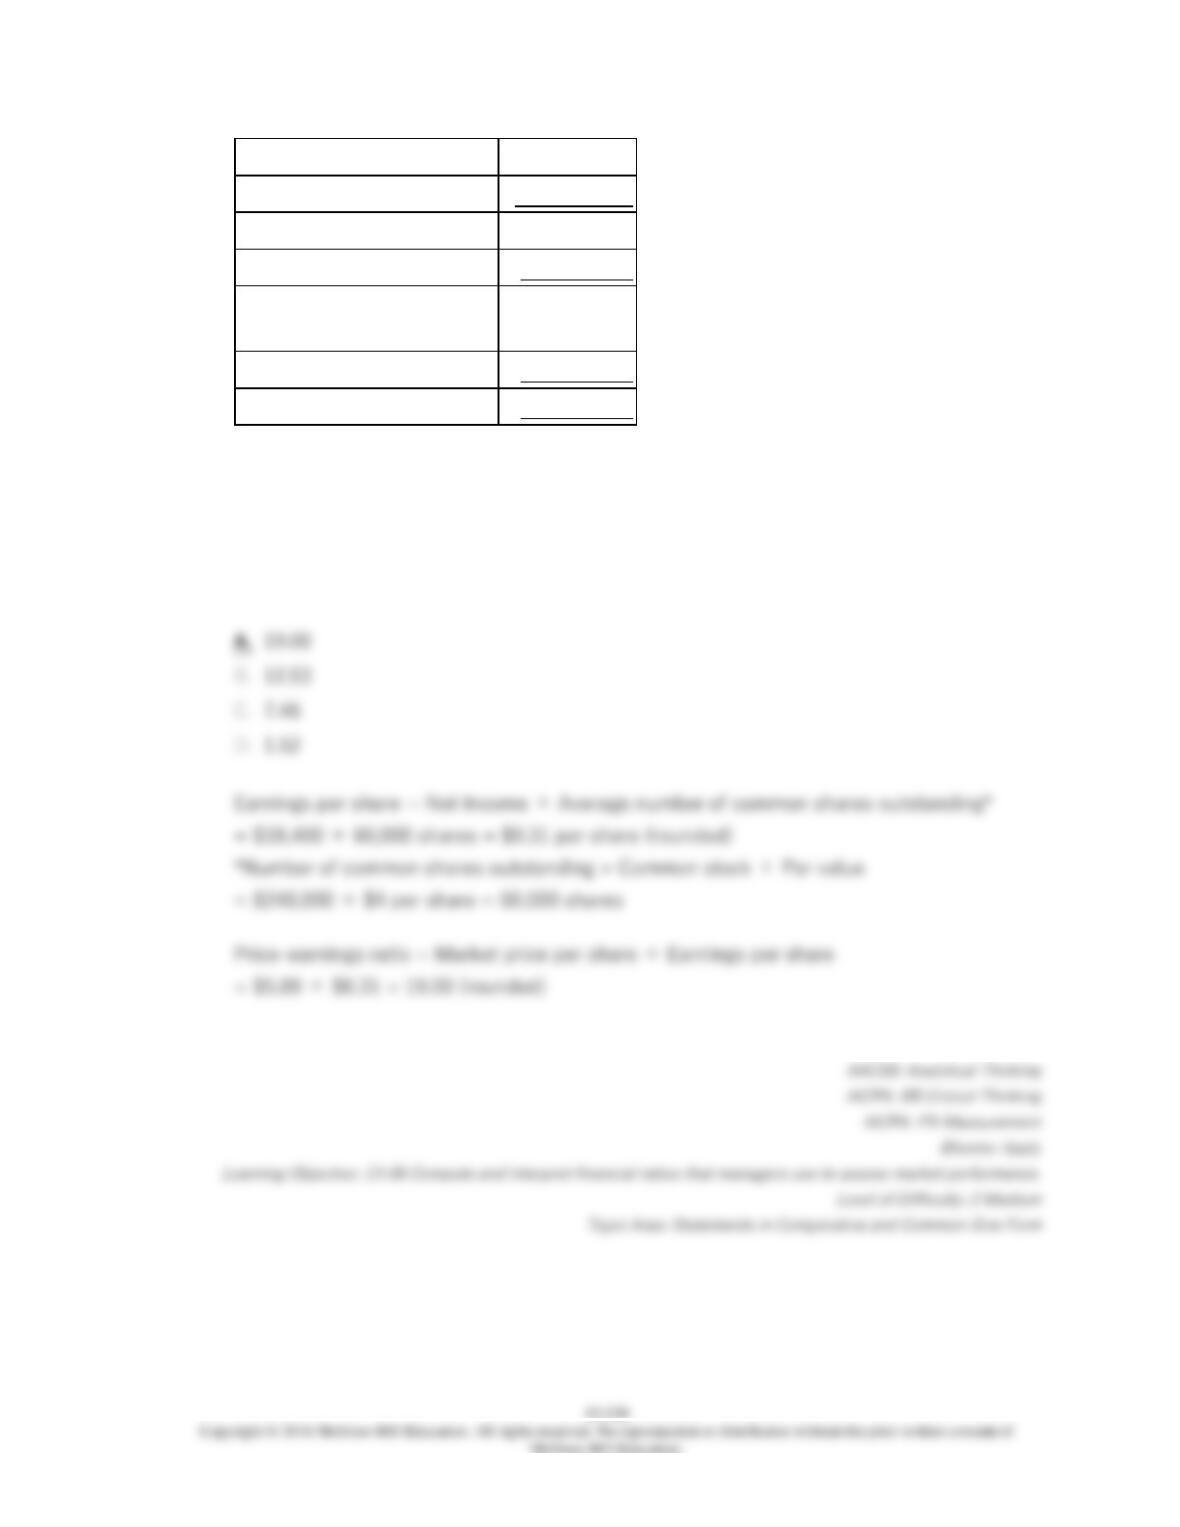
The company’s price-earnings ratio for Year 2 is closest to:
228.
Recher Corporation’s common stock has a par value of $3 per share and has been stable
at a total value of $270,000 on the company’s balance sheet for several years. The total
stockholders’ equity at the end of this year was $1,023,000 and at the beginning of the
year was $1,010,000. Net income for the year was $17,500. Dividends on common stock
during the year totaled $4,500. The market price of common stock at the end of the year
was $3.76 per share.
The company’s earnings per share is closest to:
229.
Recher Corporation’s common stock has a par value of $3 per share and has been stable
at a total value of $270,000 on the company’s balance sheet for several years. The total
stockholders’ equity at the end of this year was $1,023,000 and at the beginning of the
year was $1,010,000. Net income for the year was $17,500. Dividends on common stock
during the year totaled $4,500. The market price of common stock at the end of the year
was $3.76 per share.
13–541
230.
Recher Corporation’s common stock has a par value of $3 per share and has been stable
at a total value of $270,000 on the company’s balance sheet for several years. The total
stockholders’ equity at the end of this year was $1,023,000 and at the beginning of the
year was $1,010,000. Net income for the year was $17,500. Dividends on common stock
during the year totaled $4,500. The market price of common stock at the end of the year
was $3.76 per share.
The company’s dividend payout ratio is closest to:

13–542
231.
Recher Corporation’s common stock has a par value of $3 per share and has been stable
at a total value of $270,000 on the company’s balance sheet for several years. The total
stockholders’ equity at the end of this year was $1,023,000 and at the beginning of the
year was $1,010,000. Net income for the year was $17,500. Dividends on common stock
during the year totaled $4,500. The market price of common stock at the end of the year
was $3.76 per share.
The company’s dividend yield ratio is closest to:
13–543
232.
Recher Corporation’s common stock has a par value of $3 per share and has been stable
at a total value of $270,000 on the company’s balance sheet for several years. The total
stockholders’ equity at the end of this year was $1,023,000 and at the beginning of the
year was $1,010,000. Net income for the year was $17,500. Dividends on common stock
during the year totaled $4,500. The market price of common stock at the end of the year
was $3.76 per share.
The company’s book value per share at the end of the year is closest to:
233.
Sperle Corporation has provided the following data concerning its stockholders’ equity
accounts:
Year 2
Year 1
Stockholders’ equity:
Common stock, $5 par value
$400,000
$400,000
Additional paid-in capital-common stock
60,000
60,000
Retained earnings
654,000
630,000
Total stockholders’ equity
$1,114,000
$1,090,000
Net income for Year 2 was $30,400. Dividends on common stock during Year 2 totaled
$6,400. The market price of common stock at the end of Year 2 was $3.08 per share.
The company’s earnings per share for Year 2 is closest to: