Net income $36,500
Dividends on common stock during Year 2 totaled $4,500. The market price of common stock at
the end of Year 2 was $10.88 per share.
The company’s debt-to–equity ratio at the end of Year 2 is closest to:

13-202
203. Fayer Corporation has provided the following financial data:
Balance Sheet
December 31, Year 2 and Year 1
Assets Year 2 Year 1
Current assets:
Cash $161,000 $180,000
Accounts receivable 110,000 130,000
Inventory 181,000 160,000
Prepaid expenses 57,000 70,000
Total current assets 509,000 540,000
Plant and equipment, net 1,044,000 960,000
Total assets $1,553,000 $1,500,000
Liabilities and Stockholders’ Equity
Current liabilities:
Accounts payable $188,000 $160,000
Accrued liabilities 57,000 60,000
Notes payable, short term 36,000 40,000
Total current liabilities 281,000 260,000
Bonds payable 200,000 200,000
Total liabilities 481,000 460,000
Stockholders’ equity:
Common stock, $4 par value 200,000 200,000
Additional paid-in capital-common stock 80,000 80,000
Retained earnings 792,000 760,000
Total stockholders’ equity 1,072,000 1,040,000
Total liabilities & stockholders’ equity $1,553,000 $1,500,000
Income Statement—Year 2
For the Year Ended December 31, Year 2
Sales (all on account) $1,220,000
Cost of goods sold 760,000
Gross margin 460,000
Operating expenses 389,846
Net operating income 70,154
Interest expense 14,000
Net income before taxes 56,154
Income taxes (35%) 19,654
Net income $36,500
Dividends on common stock during Year 2 totaled $4,500. The market price of common stock at
the end of Year 2 was $10.88 per share.
The company’s equity multiplier at the end of Year 2 is closest to:

13-204
204. Tweedle Corporation’s most recent balance sheet and income statement appear below:
Balance Sheet
December 31, Year 2 and Year 1
(in thousands of dollars)
Year 2 Year 1
Assets
Current assets:
Cash $140 $130
Accounts receivable 200 210
Inventory 150 180
Prepaid expenses 20 20
Total current assets 510 540
Plant and equipment, net 950 910
Total assets $1,460 $1,450
Liabilities and Stockholders’ Equity
Current liabilities:
Accounts payable $130 $150
Accrued liabilities 70 70
Notes payable, short term 70 60
Total current liabilities 270 280
Bonds payable 170 190
Total liabilities 440 470
Stockholders’ equity:
Common stock, $1 par value 200 200
Additional paid-in capital-common stock 320 320
Retained earnings 500 460
Total stockholders’ equity 1,020 980
Total liabilities & stockholders’ equity $1,460 $1,450
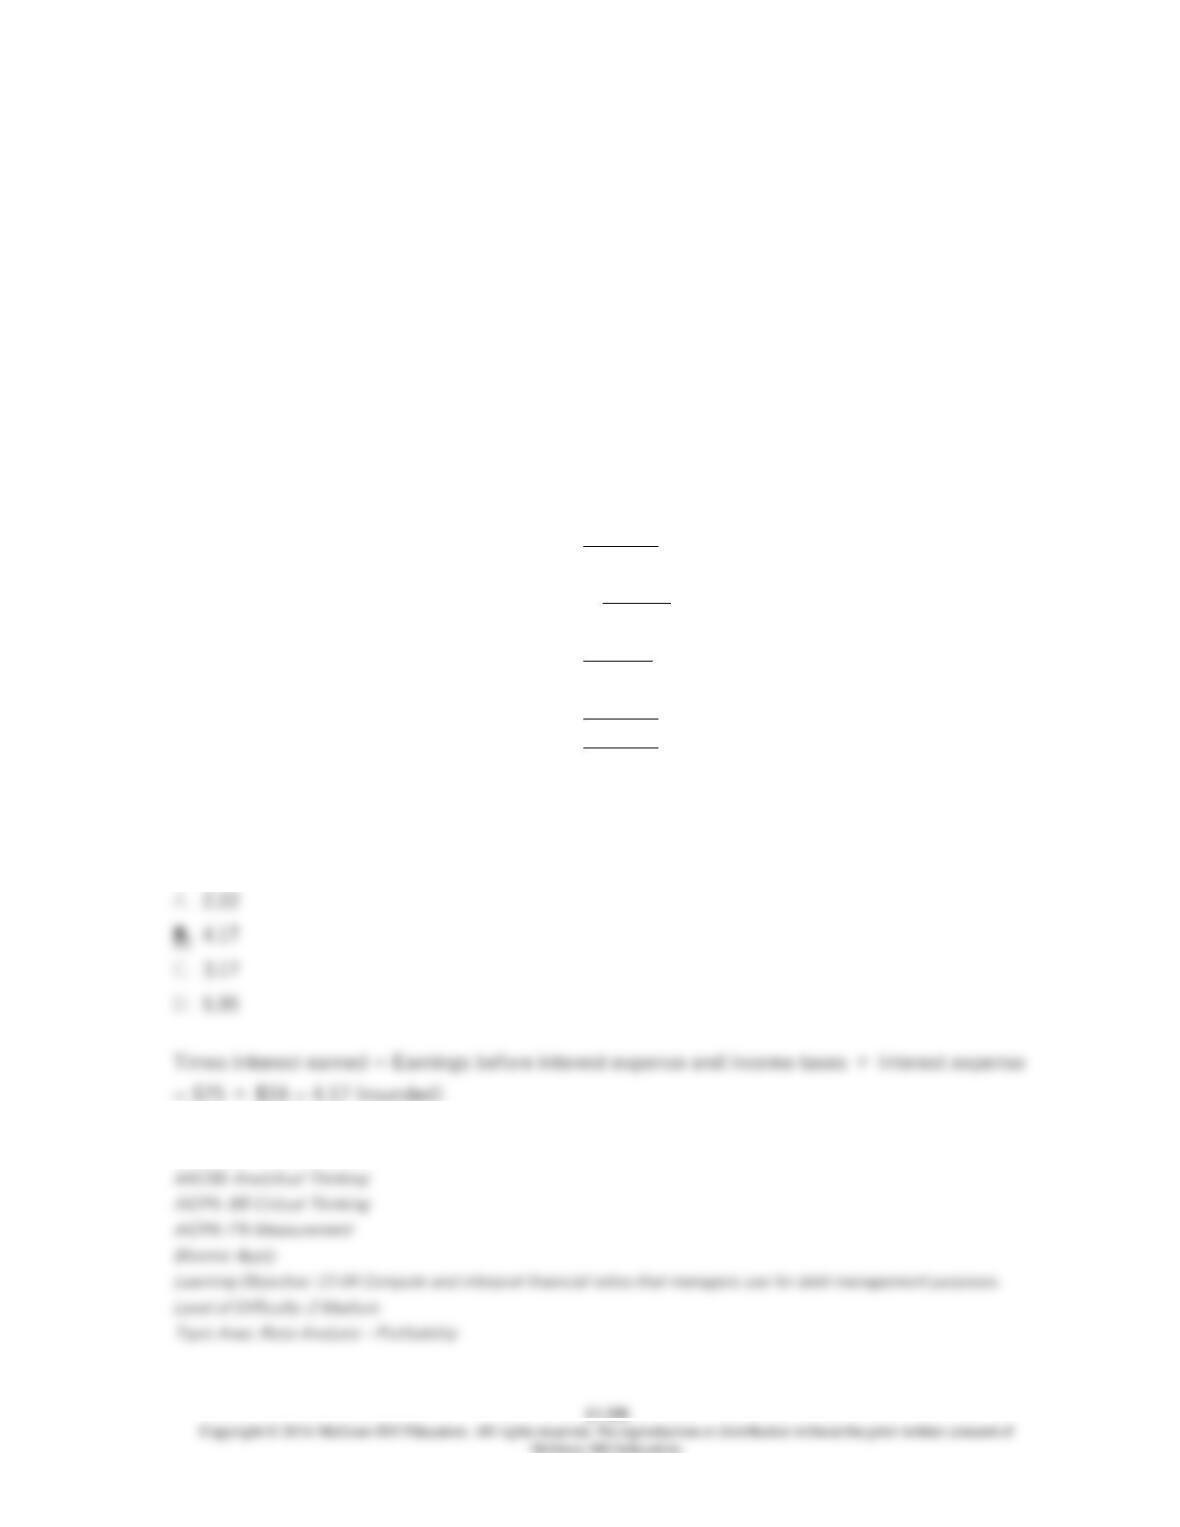
Income Statement
For the Year Ended December 31, Year 2
(in thousands of dollars)
Sales (all on account) $1,190
Cost of goods sold 710
Gross margin 480
Selling and administrative expense 226
Net operating income 254
Interest expense 25
Net income before taxes 229
Income taxes (30%) 69
Net income $160
The times interest earned for Year 2 is closest to:

13-206
205. Tweedle Corporation’s most recent balance sheet and income statement appear below:
Balance Sheet
December 31, Year 2 and Year 1
(in thousands of dollars)
Year 2 Year 1
Assets
Current assets:
Cash $140 $130
Accounts receivable 200 210
Inventory 150 180
Prepaid expenses 20 20
Total current assets 510 540
Plant and equipment, net 950 910
Total assets $1,460 $1,450
Liabilities and Stockholders’ Equity
Current liabilities:
Accounts payable $130 $150
Accrued liabilities 70 70
Notes payable, short term 70 60
Total current liabilities 270 280
Bonds payable 170 190
Total liabilities 440 470
Stockholders’ equity:
Common stock, $1 par value 200 200
Additional paid-in capital-common stock 320 320
Retained earnings 500 460
Total stockholders’ equity 1,020 980
Total liabilities & stockholders’ equity $1,460 $1,450
Income Statement
For the Year Ended December 31, Year 2
(in thousands of dollars)
Sales (all on account) $1,190
Cost of goods sold 710
Gross margin 480
Selling and administrative expense 226
Net operating income 254
Interest expense 25
Net income before taxes 229
Income taxes (30%) 69
Net income $160
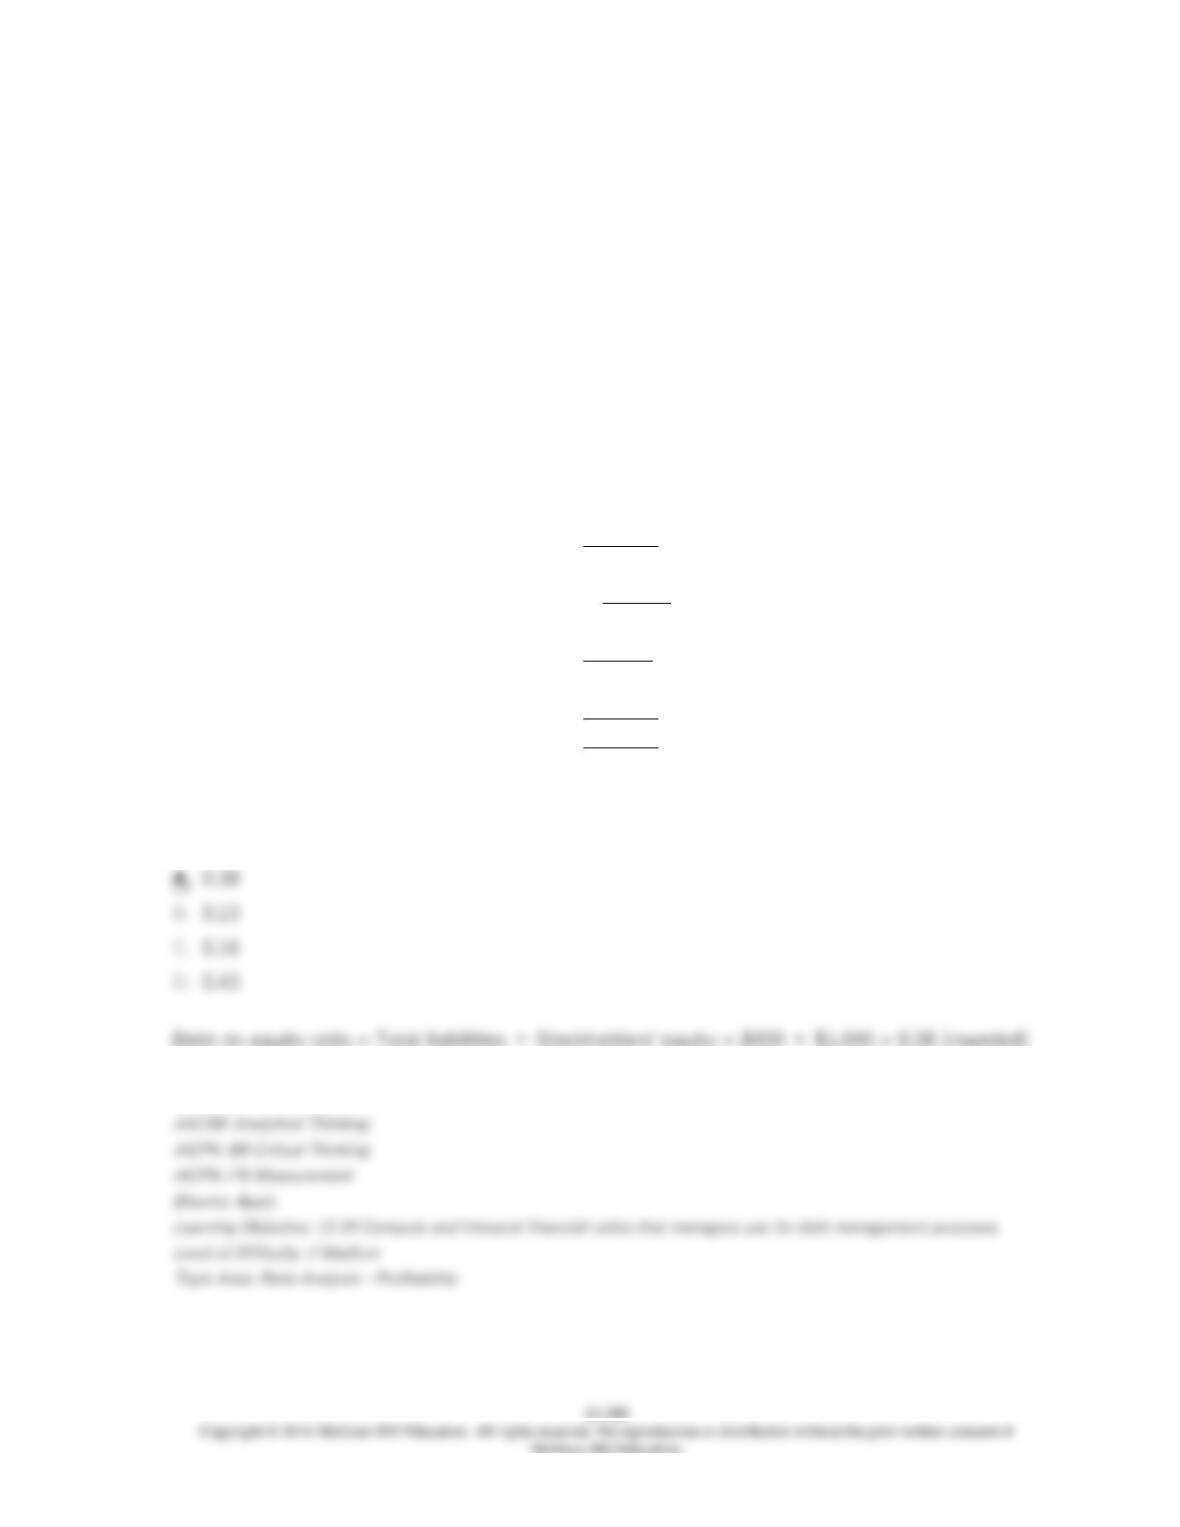
The debt-to-equity ratio at the end of Year 2 is closest to:
206. Data from Lheureux Corporation’s most recent balance sheet and the company’s income
statement appear below:
Year 2 Year 1
Total assets $1,440 $1,480
Total liabilities $400 $450
Total stockholders’ equity $1,040 $1,030
Income Statement
For the Year Ended December 31, Year 2
(in thousands of dollars)
Sales (all on account) $1,280
Cost of goods sold 850
Gross margin 430
Selling and administrative expense 355
Net operating income 75
Interest expense 18
Net income before taxes 57
Income taxes (30%) 17
Net income $40
The times interest earned for Year 2 is closest to:
207. Data from Lheureux Corporation’s most recent balance sheet and the company’s income
statement appear below:
Year 2 Year 1
Total assets $1,440 $1,480
Total liabilities $400 $450
Total stockholders’ equity $1,040 $1,030
Income Statement
For the Year Ended December 31, Year 2
(in thousands of dollars)
Sales (all on account) $1,280
Cost of goods sold 850
Gross margin 430
Selling and administrative expense 355
Net operating income 75
Interest expense 18
Net income before taxes 57
Income taxes (30%) 17
Net income $40
The debt-to-equity ratio at the end of Year 2 is closest to:
208. Neef Corporation has provided the following financial data from its balance sheet and
income statement:
Year 2 Year 1
Total assets $1,302,000 $1,330,000
Total stockholders’ equity $885,000 $880,000
Income Statement—Year 2
For the Year Ended December 31, Year 2
Sales (all on account) $1,420,000
Cost of goods sold 890,000
Gross margin 530,000
Operating expenses 493,000
Net operating income 37,000
Interest expense 17,000
Net income before taxes 20,000
Income taxes (35%) 7,000
Net income $13,000
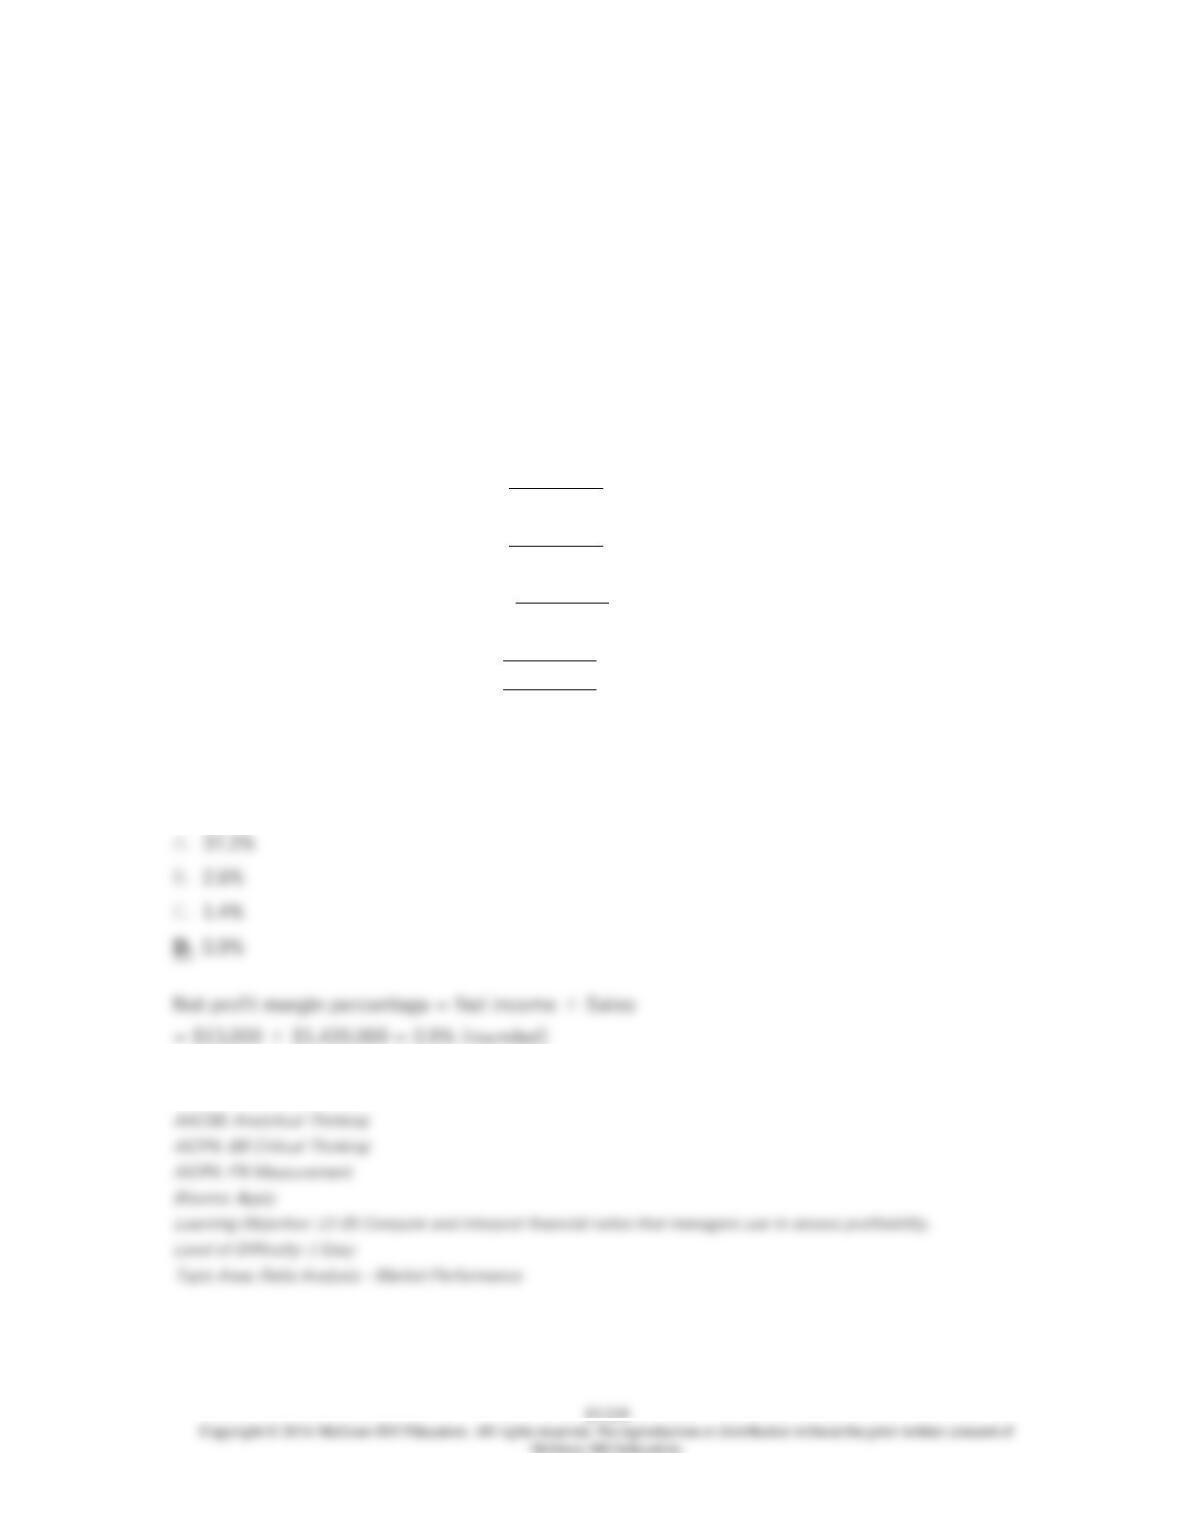
The company’s net profit margin percentage for Year 2 is closest to:
209. Neef Corporation has provided the following financial data from its balance sheet and
income statement:
Year 2 Year 1
Total assets $1,302,000 $1,330,000
Total stockholders’ equity $885,000 $880,000
Income Statement—Year 2
For the Year Ended December 31, Year 2
Sales (all on account) $1,420,000
Cost of goods sold 890,000
Gross margin 530,000
Operating expenses 493,000
Net operating income 37,000
Interest expense 17,000
Net income before taxes 20,000
Income taxes (35%) 7,000
Net income $13,000
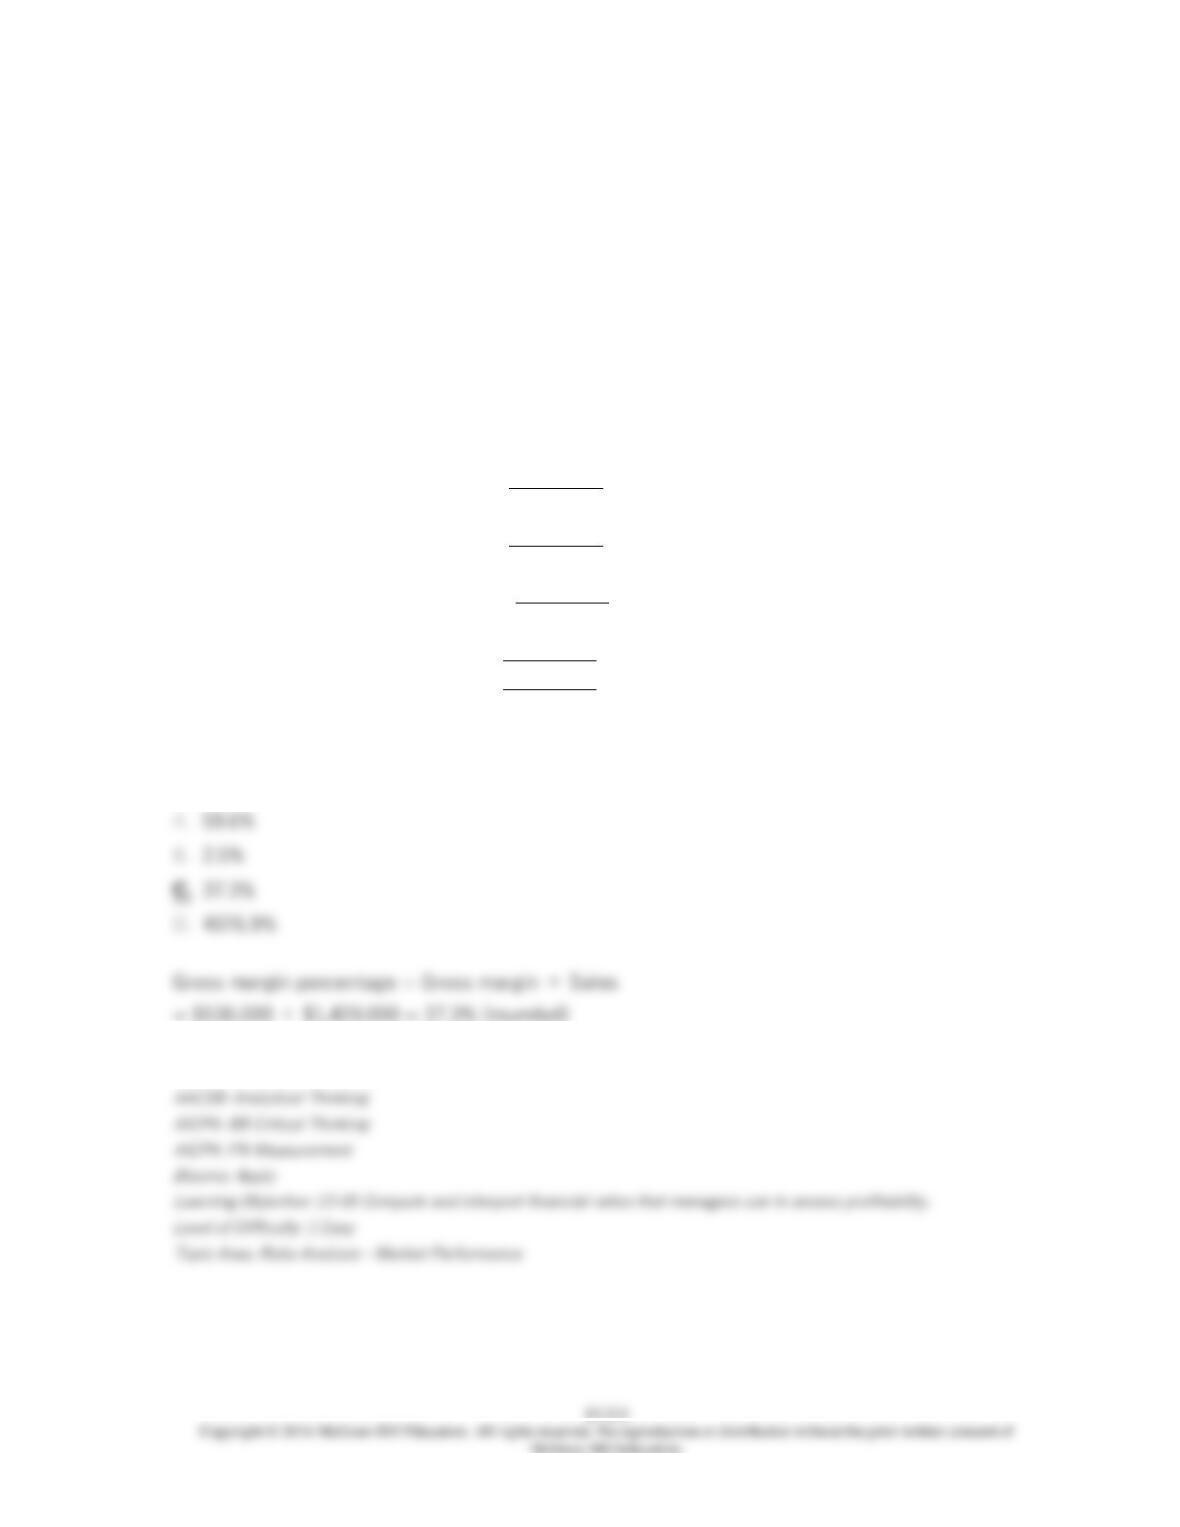
The company’s gross margin percentage for Year 2 is closest to:
210. Neef Corporation has provided the following financial data from its balance sheet and
income statement:
Year 2 Year 1
Total assets $1,302,000 $1,330,000
Total stockholders’ equity $885,000 $880,000
Income Statement—Year 2
For the Year Ended December 31, Year 2
Sales (all on account) $1,420,000
Cost of goods sold 890,000
Gross margin 530,000
Operating expenses 493,000
Net operating income 37,000
Interest expense 17,000
Net income before taxes 20,000
Income taxes (35%) 7,000
Net income $13,000
The company’s return on total assets for Year 2 is closest to:
211. Neef Corporation has provided the following financial data from its balance sheet and
income statement:
Year 2 Year 1
Total assets $1,302,000 $1,330,000
Total stockholders’ equity $885,000 $880,000
Income Statement—Year 2
For the Year Ended December 31, Year 2
Sales (all on account) $1,420,000
Cost of goods sold 890,000
Gross margin 530,000
Operating expenses 493,000
Net operating income 37,000
Interest expense 17,000
Net income before taxes 20,000
Income taxes (35%) 7,000
Net income $13,000
The company’s return on equity for Year 2 is closest to:
212. Garrott Corporation’s total assets were $1,505,000 at the end of Year 2 and $1,520,000 at
the end of Year 1. Its total stockholders’ equity was $1,197,000 at the end of Year 2 and
$1,180,000 at the end of Year 1.
Income Statement—Year 2
For the Year Ended December 31, Year 2
Sales (all on account) $1,340,000
Cost of goods sold 830,000
Gross margin 510,000
Operating expenses 465,143
Net operating income 44,857
Interest expense 9,000
Net income before taxes 35,857
Income taxes (30%) 10,757
Net income $25,100
The company’s net profit margin percentage for Year 2 is closest to:
213. Garrott Corporation’s total assets were $1,505,000 at the end of Year 2 and $1,520,000 at
the end of Year 1. Its total stockholders’ equity was $1,197,000 at the end of Year 2 and
$1,180,000 at the end of Year 1.
Income Statement—Year 2
For the Year Ended December 31, Year 2
Sales (all on account) $1,340,000
Cost of goods sold 830,000
Gross margin 510,000
Operating expenses 465,143
Net operating income 44,857
Interest expense 9,000
Net income before taxes 35,857
Income taxes (30%) 10,757
Net income $25,100
The company’s gross margin percentage for Year 2 is closest to:
214. Garrott Corporation’s total assets were $1,505,000 at the end of Year 2 and $1,520,000 at
the end of Year 1. Its total stockholders’ equity was $1,197,000 at the end of Year 2 and
$1,180,000 at the end of Year 1.
Income Statement—Year 2
For the Year Ended December 31, Year 2
Sales (all on account) $1,340,000
Cost of goods sold 830,000
Gross margin 510,000
Operating expenses 465,143
Net operating income 44,857
Interest expense 9,000
Net income before taxes 35,857
Income taxes (30%) 10,757
Net income $25,100
The company’s return on total assets for Year 2 is closest to:
215. Garrott Corporation’s total assets were $1,505,000 at the end of Year 2 and $1,520,000 at
the end of Year 1. Its total stockholders’ equity was $1,197,000 at the end of Year 2 and
$1,180,000 at the end of Year 1.
Income Statement—Year 2
For the Year Ended December 31, Year 2
Sales (all on account) $1,340,000
Cost of goods sold 830,000
Gross margin 510,000
Operating expenses 465,143
Net operating income 44,857
Interest expense 9,000
Net income before taxes 35,857
Income taxes (30%) 10,757
Net income $25,100
The company’s return on equity for Year 2 is closest to:

13-219
216. Kearin Corporation has provided the following financial data:
Balance Sheet
December 31, Year 2 and Year 1
Assets Year 2 Year 1
Current assets:
Cash $33,000 $100,000
Accounts receivable 281,000 250,000
Inventory 122,000 130,000
Prepaid expenses 68,000 80,000
Total current assets 504,000 560,000
Plant and equipment, net 1,016,000 980,000
Total assets $1,520,000 $1,540,000
Liabilities and Stockholders’ Equity
Current liabilities:
Accounts payable $80,000 $100,000
Accrued liabilities 31,000 30,000
Notes payable, short term 56,000 70,000
Total current liabilities 167,000 200,000
Bonds payable 260,000 260,000
Total liabilities 427,000 460,000
Stockholders’ equity:
Common stock, $5 par value 500,000 500,000
Additional paid-in capital-common stock 70,000 70,000
Retained earnings 523,000 510,000
Total stockholders’ equity 1,093,000 1,080,000
Total liabilities & stockholders’ equity $1,520,000 $1,540,000
Income Statement—Year 2
For the Year Ended December 31, Year 2
Sales (all on account) $1,300,000
Cost of goods sold 800,000
Gross margin 500,000
Operating expenses 448,692
Net operating income 51,308
Interest expense 19,000
Net income before taxes 32,308
Income taxes (35%) 11,308
Net income $21,000
Dividends on common stock during Year 2 totaled $8,000. The market price of common stock at
the end of Year 2 was $2.02 per share.
The company’s net profit margin percentage for Year 2 is closest to: