(dollars in thousands)
Sales (all on account)
$1,770
Cost of goods sold
1,230
Gross margin
540
Selling and administrative
expense
210
Net operating income
330
Interest expense
30
Net income before taxes
300
Income taxes (30%)
90
Net income
$210
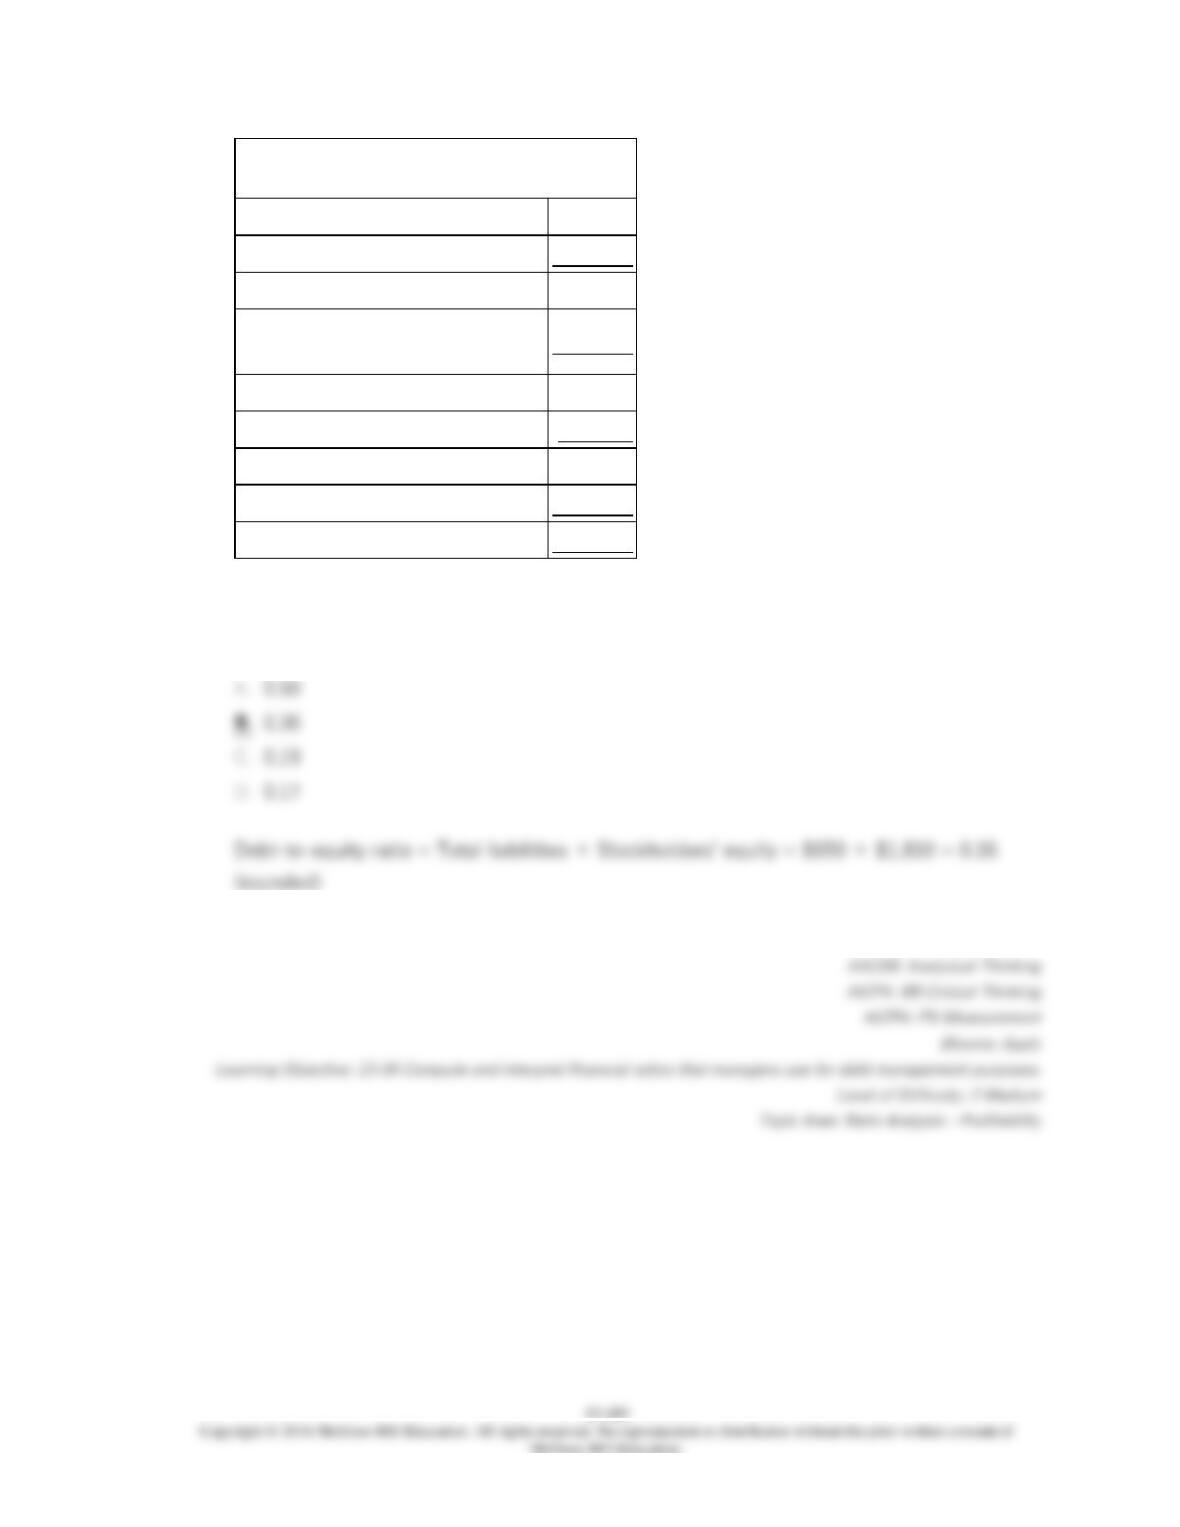
Narstad Corporation’s debt-to-equity ratio at the end of Year 2 was closest to:
13–486
195.
Lasch Corporation has provided the following financial data from its balance sheet and
income statement:
Year 2
Year 1
Total assets
$1,333,000
$1,320,000
Accounts payable
$158,000
$160,000
Accrued liabilities
$43,000
$40,000
Notes payable, short term
$47,000
$50,000
Bonds payable
$250,000
$250,000
Total liabilities
$498,000
$500,000
Total stockholders’ equity
$835,000
$820,000
Income Statement—Year 2
For the Year Ended December 31,
Year 2
Sales (all on account)
$1,250,000
Cost of goods sold
840,000
Gross margin
410,000
Operating expenses
366,286
Net operating income
43,714
Interest expense
18,000
Net income before taxes
25,714
Income taxes (30%)
7,714
Net income
$18,000
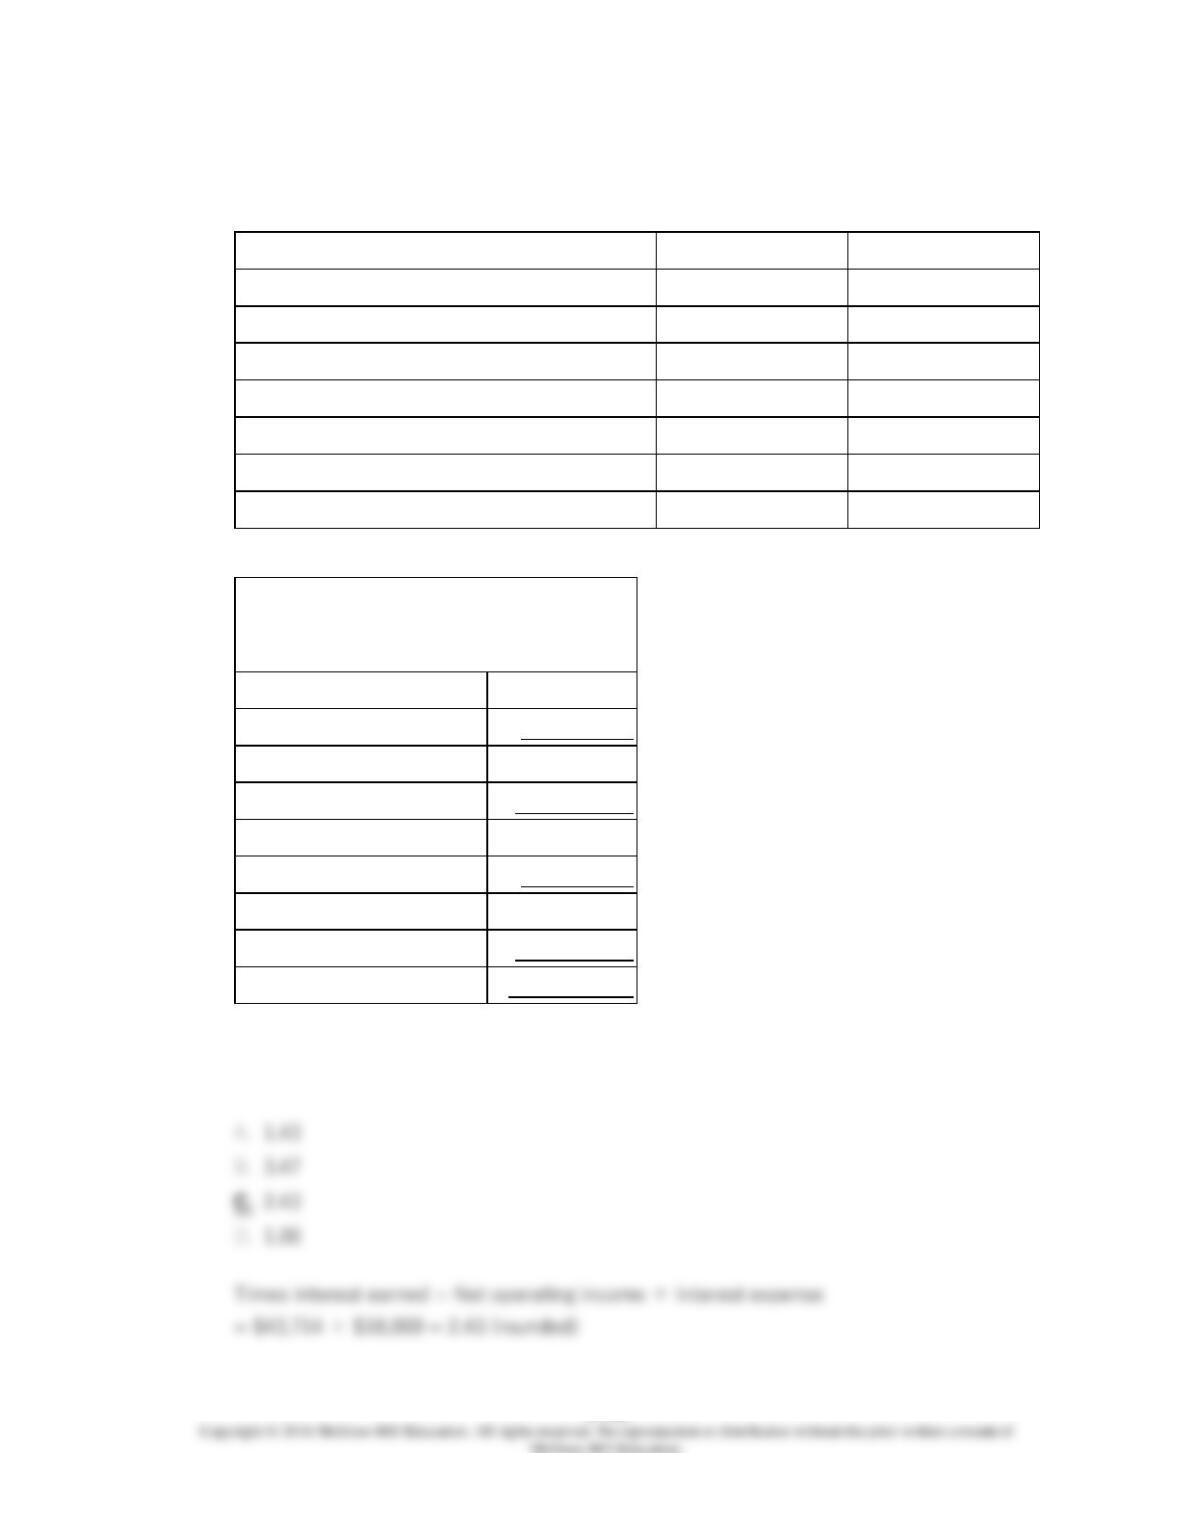
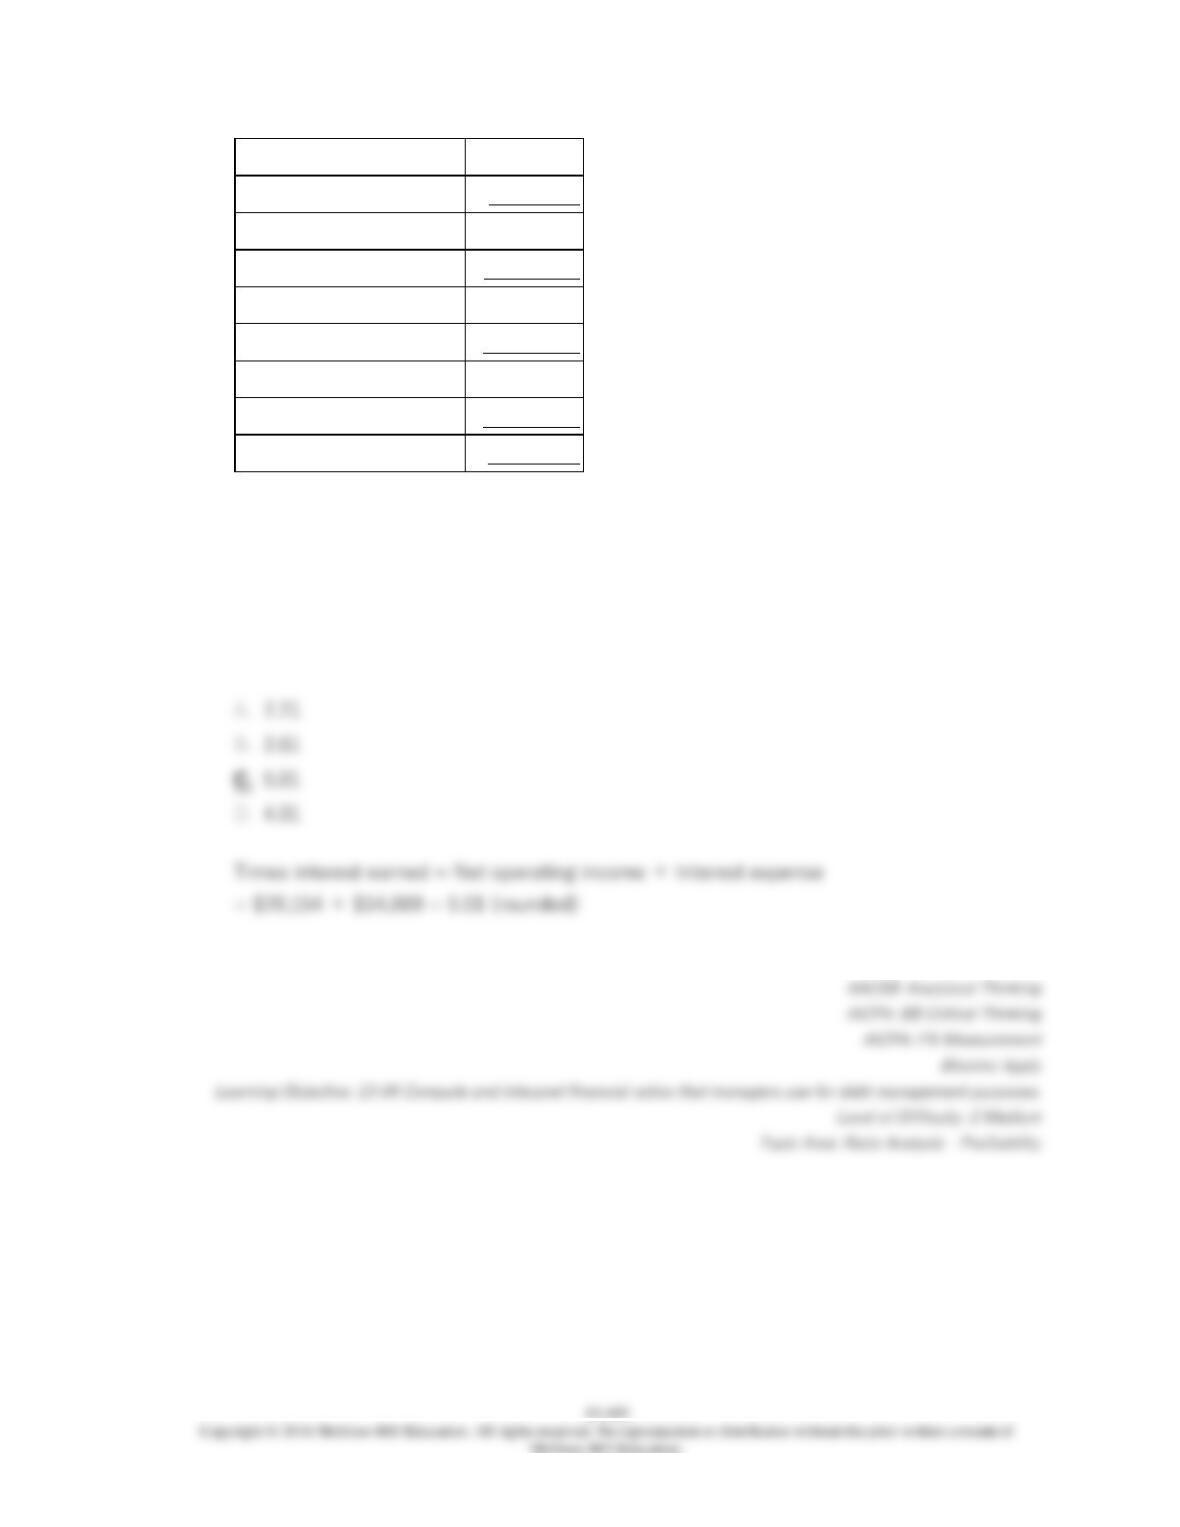
The company’s times interest earned for Year 2 is closest to:
13–487
13–488
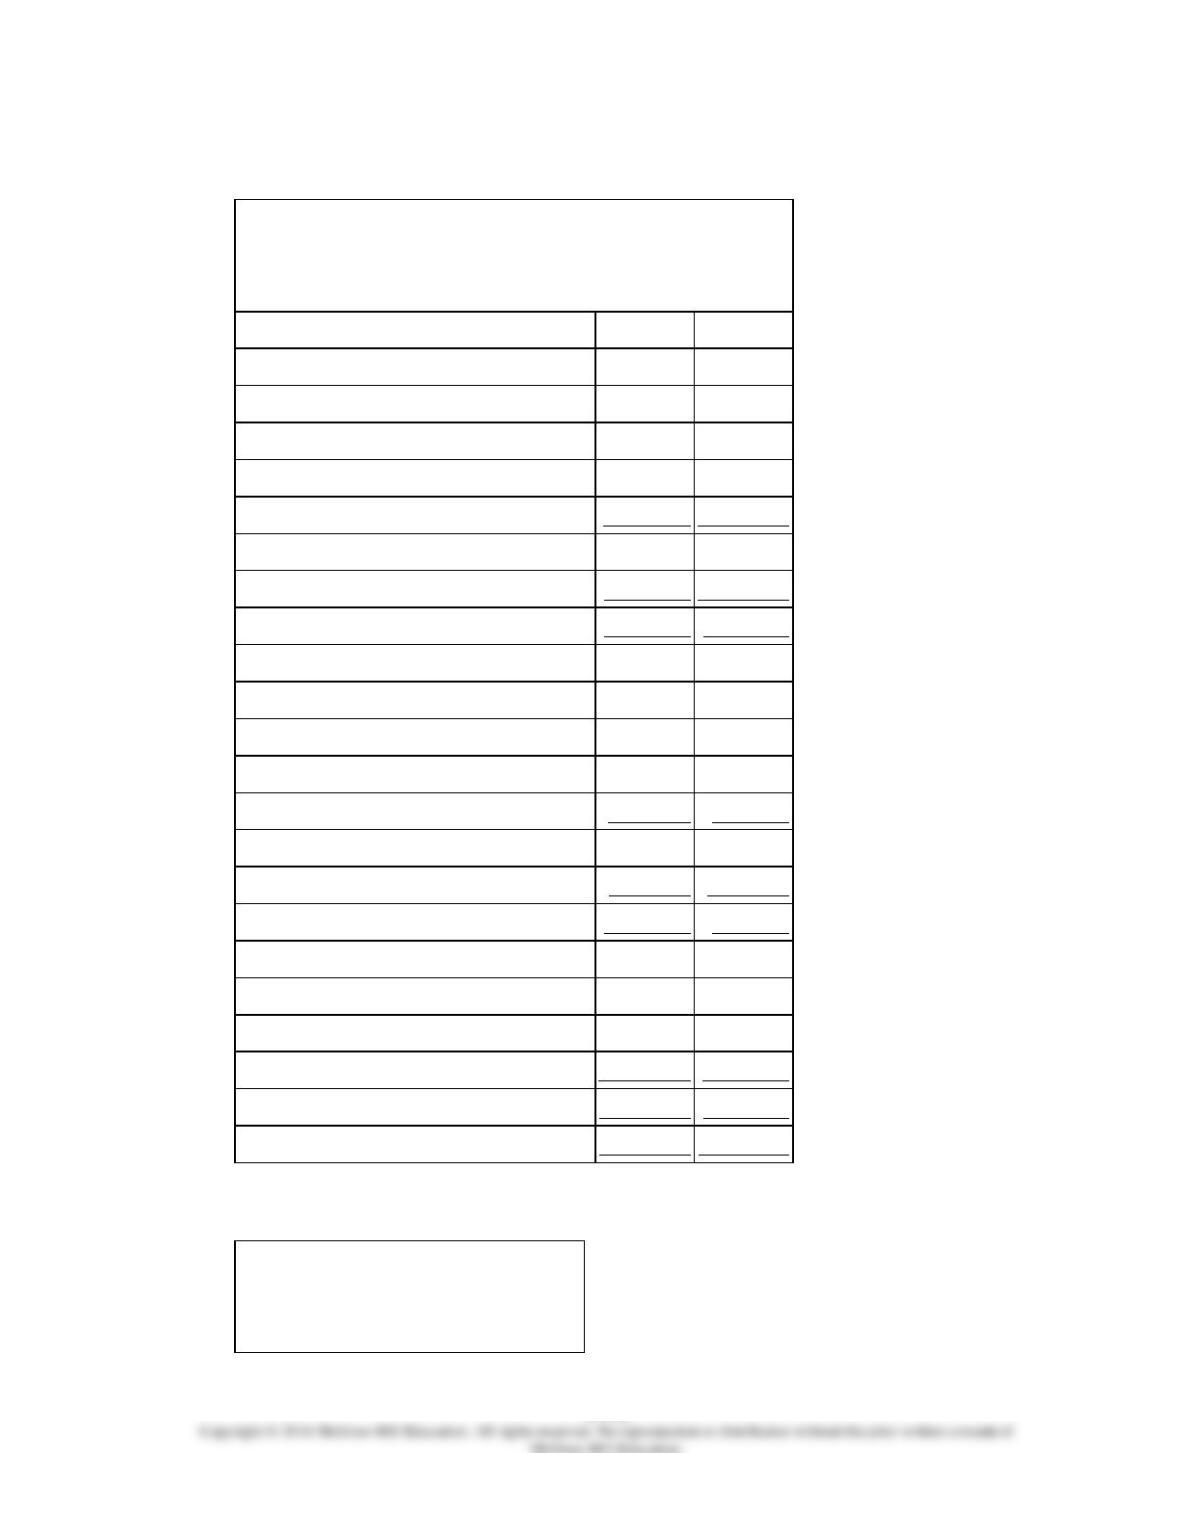
196.
Lasch Corporation has provided the following financial data from its balance sheet and
income statement:
Year 2
Year 1
Total assets
$1,333,000
$1,320,000
Accounts payable
$158,000
$160,000
Accrued liabilities
$43,000
$40,000
Notes payable, short term
$47,000
$50,000
Bonds payable
$250,000
$250,000
Total liabilities
$498,000
$500,000
Total stockholders’ equity
$835,000
$820,000
Income Statement—Year 2
For the Year Ended December 31,
Year 2
Sales (all on account)
$1,250,000
Cost of goods sold
840,000
Gross margin
410,000
Operating expenses
366,286
Net operating income
43,714
Interest expense
18,000
Net income before taxes
25,714
Income taxes (30%)
7,714
Net income
$18,000
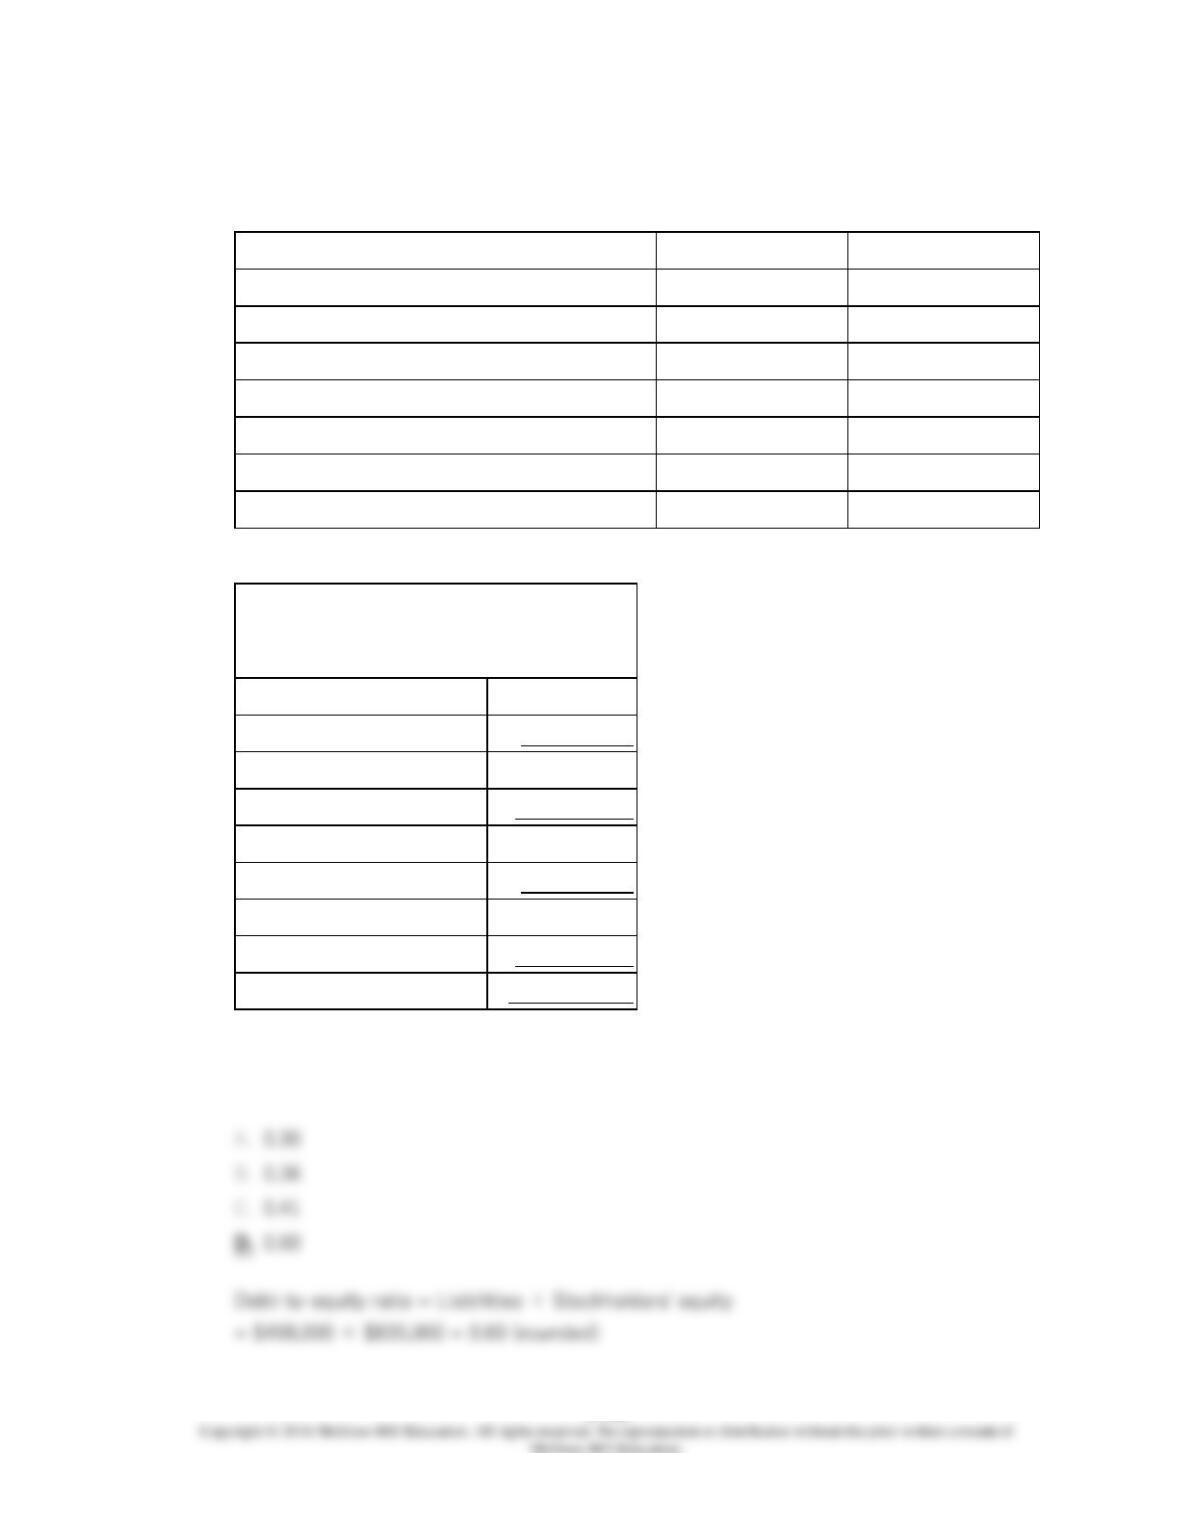
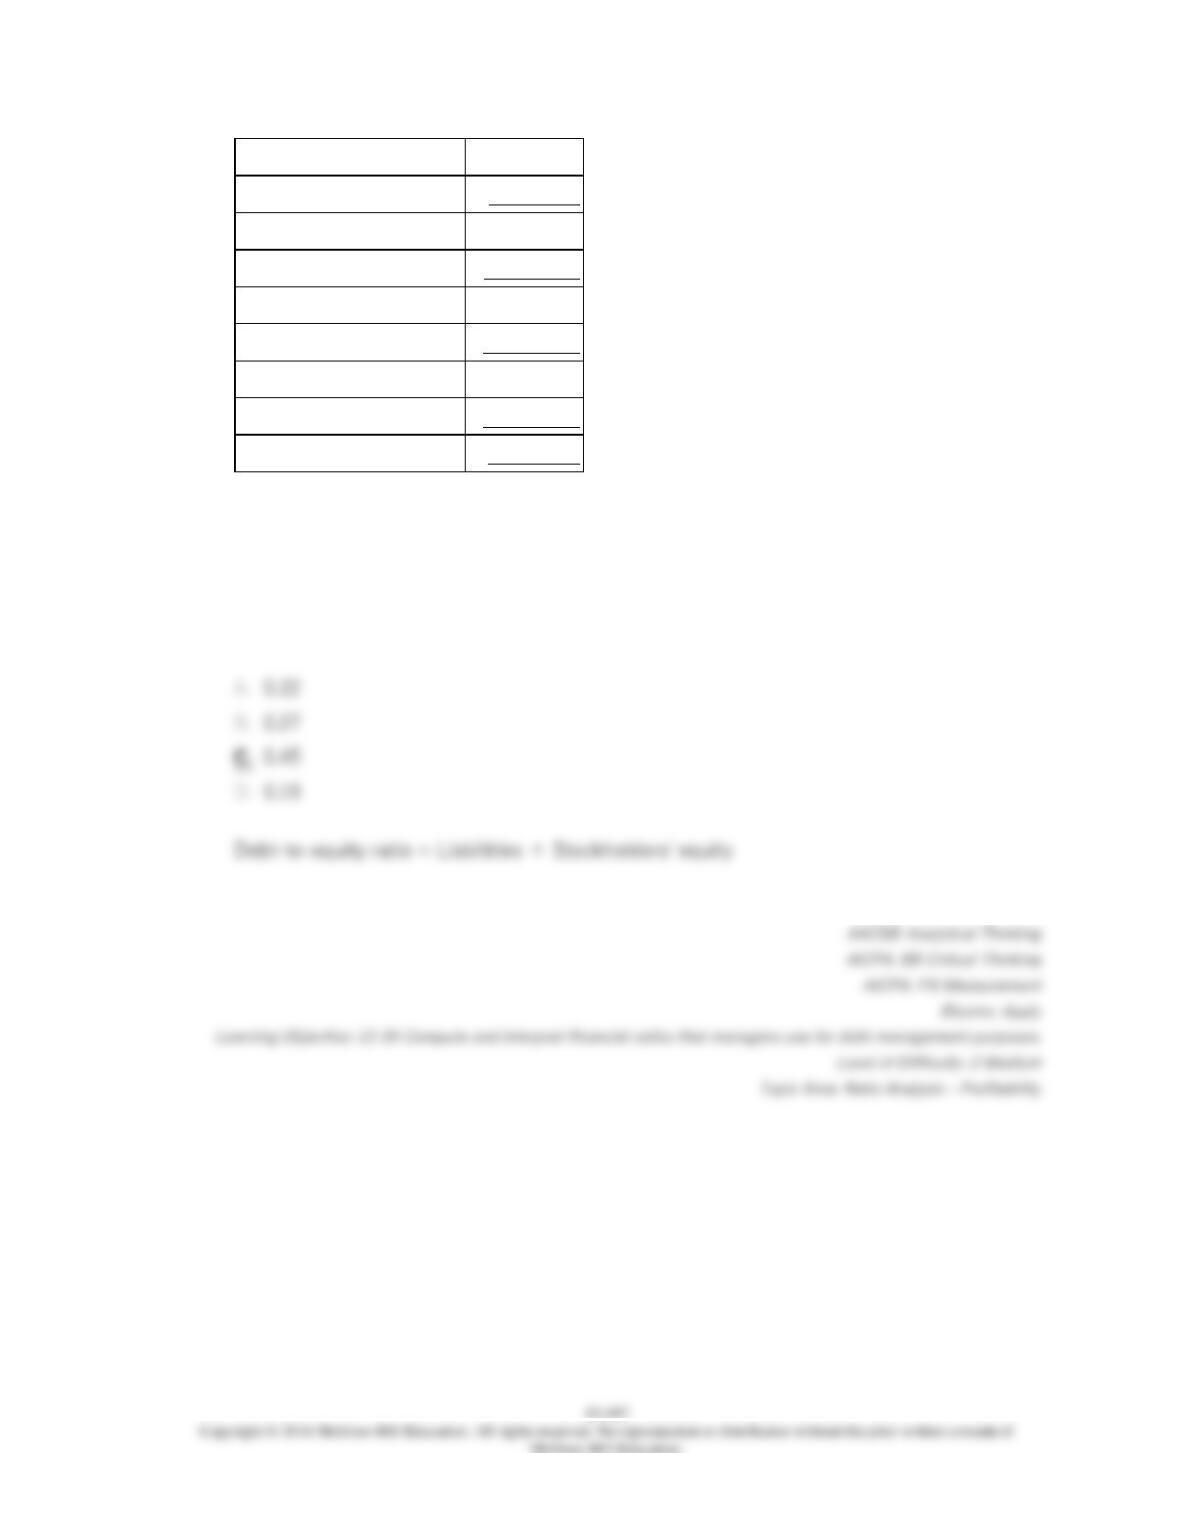
The company’s debt-to-equity ratio at the end of Year 2 is closest to:

13–489
13–490
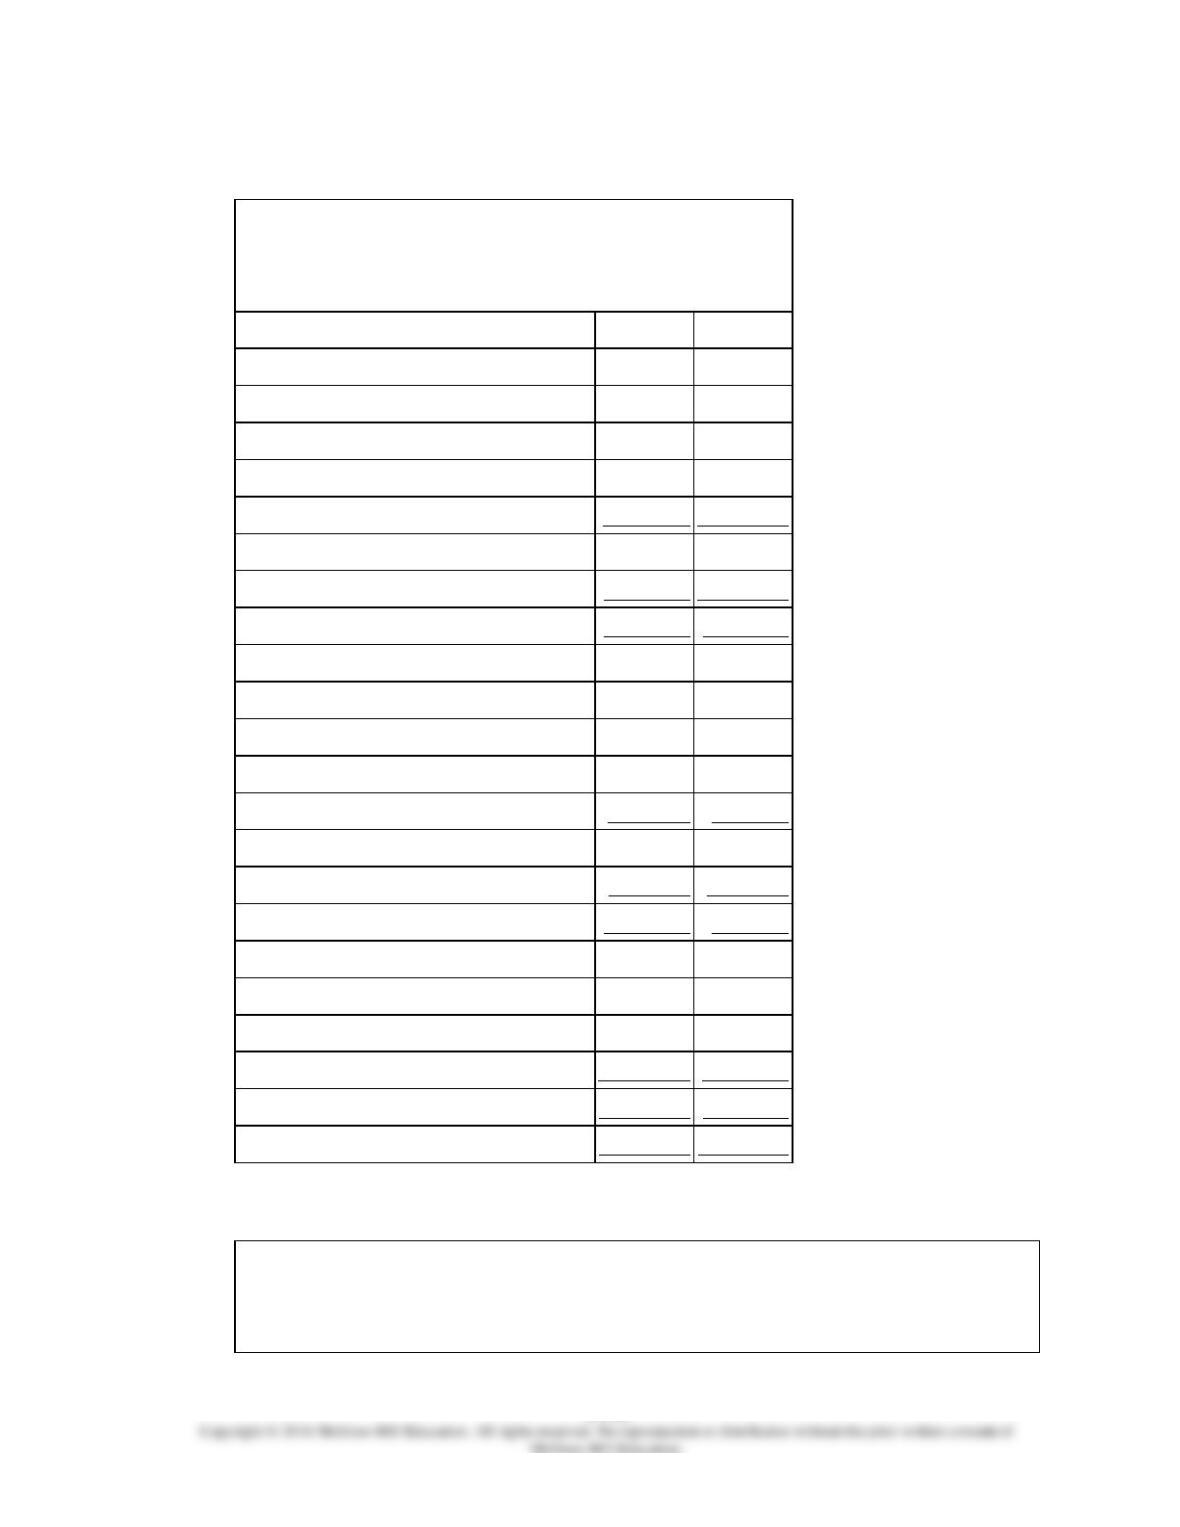
197.
Lasch Corporation has provided the following financial data from its balance sheet and
income statement:
Year 2
Year 1
Total assets
$1,333,000
$1,320,000
Accounts payable
$158,000
$160,000
Accrued liabilities
$43,000
$40,000
Notes payable, short term
$47,000
$50,000
Bonds payable
$250,000
$250,000
Total liabilities
$498,000
$500,000
Total stockholders’ equity
$835,000
$820,000
Income Statement—Year 2
For the Year Ended December 31,
Year 2
Sales (all on account)
$1,250,000
Cost of goods sold
840,000
Gross margin
410,000
Operating expenses
366,286
Net operating income
43,714
Interest expense
18,000
Net income before taxes
25,714
Income taxes (30%)
7,714
Net income
$18,000
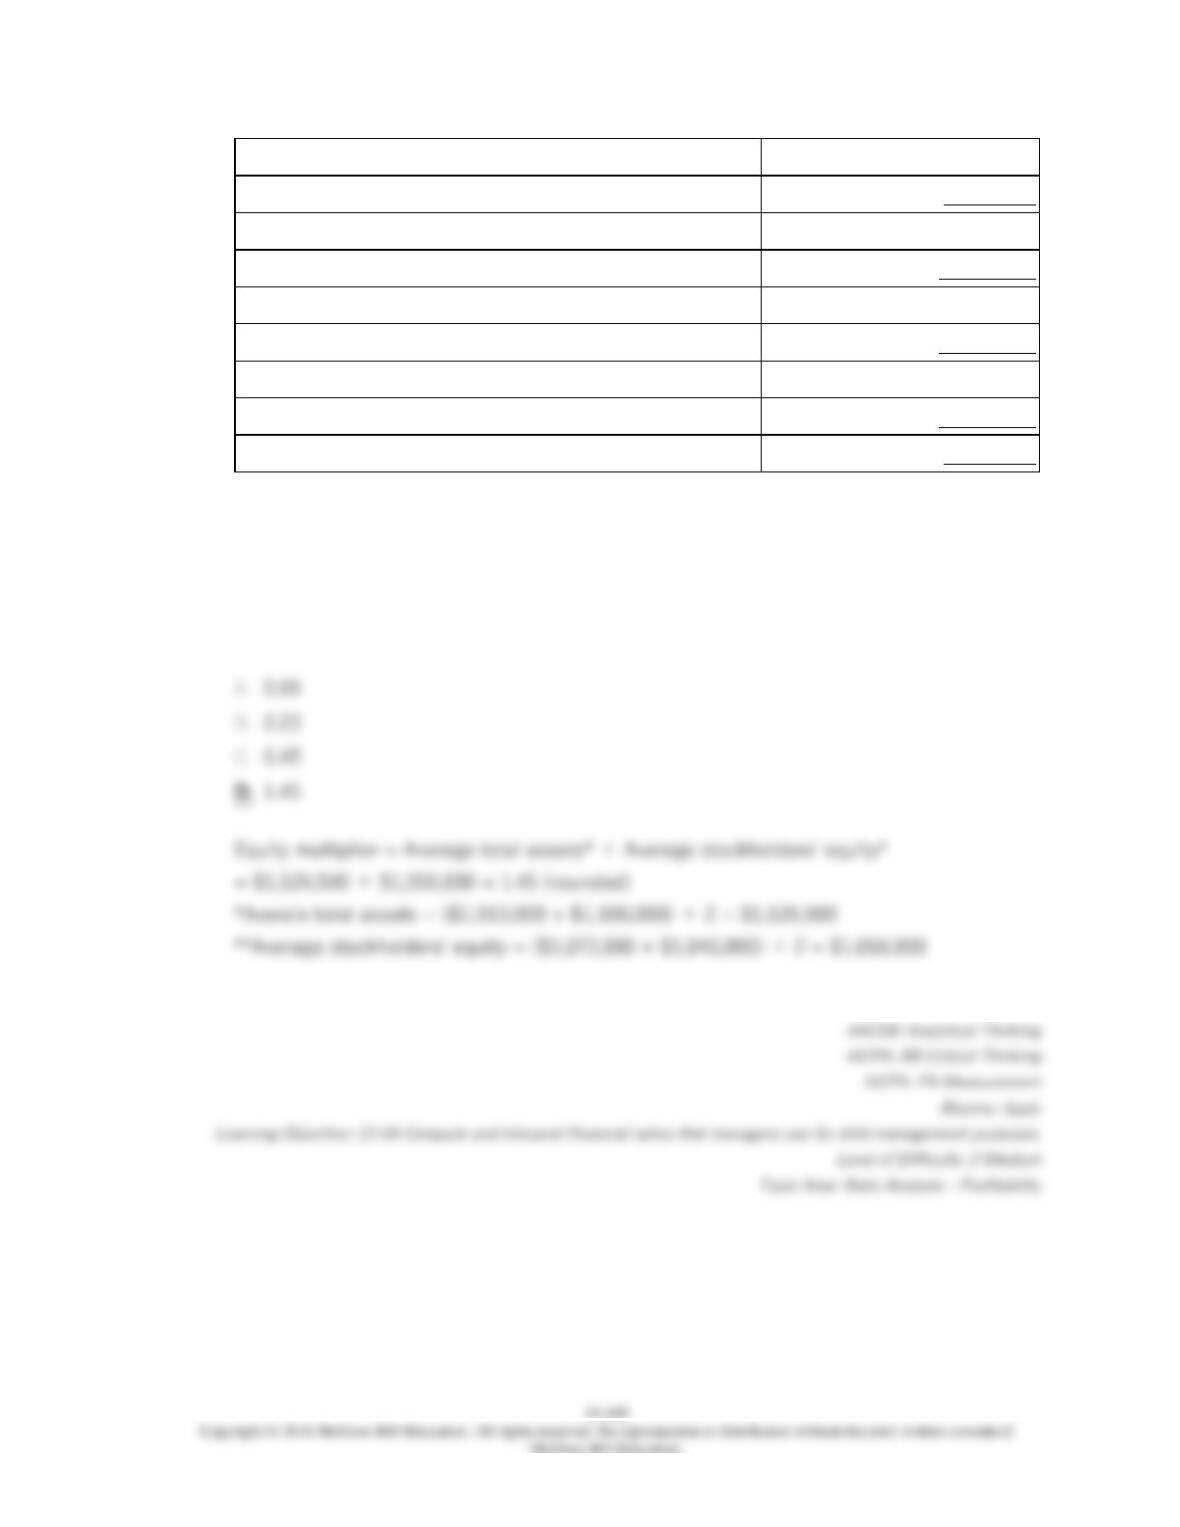
The company’s equity multiplier at the end of Year 2 is closest to:
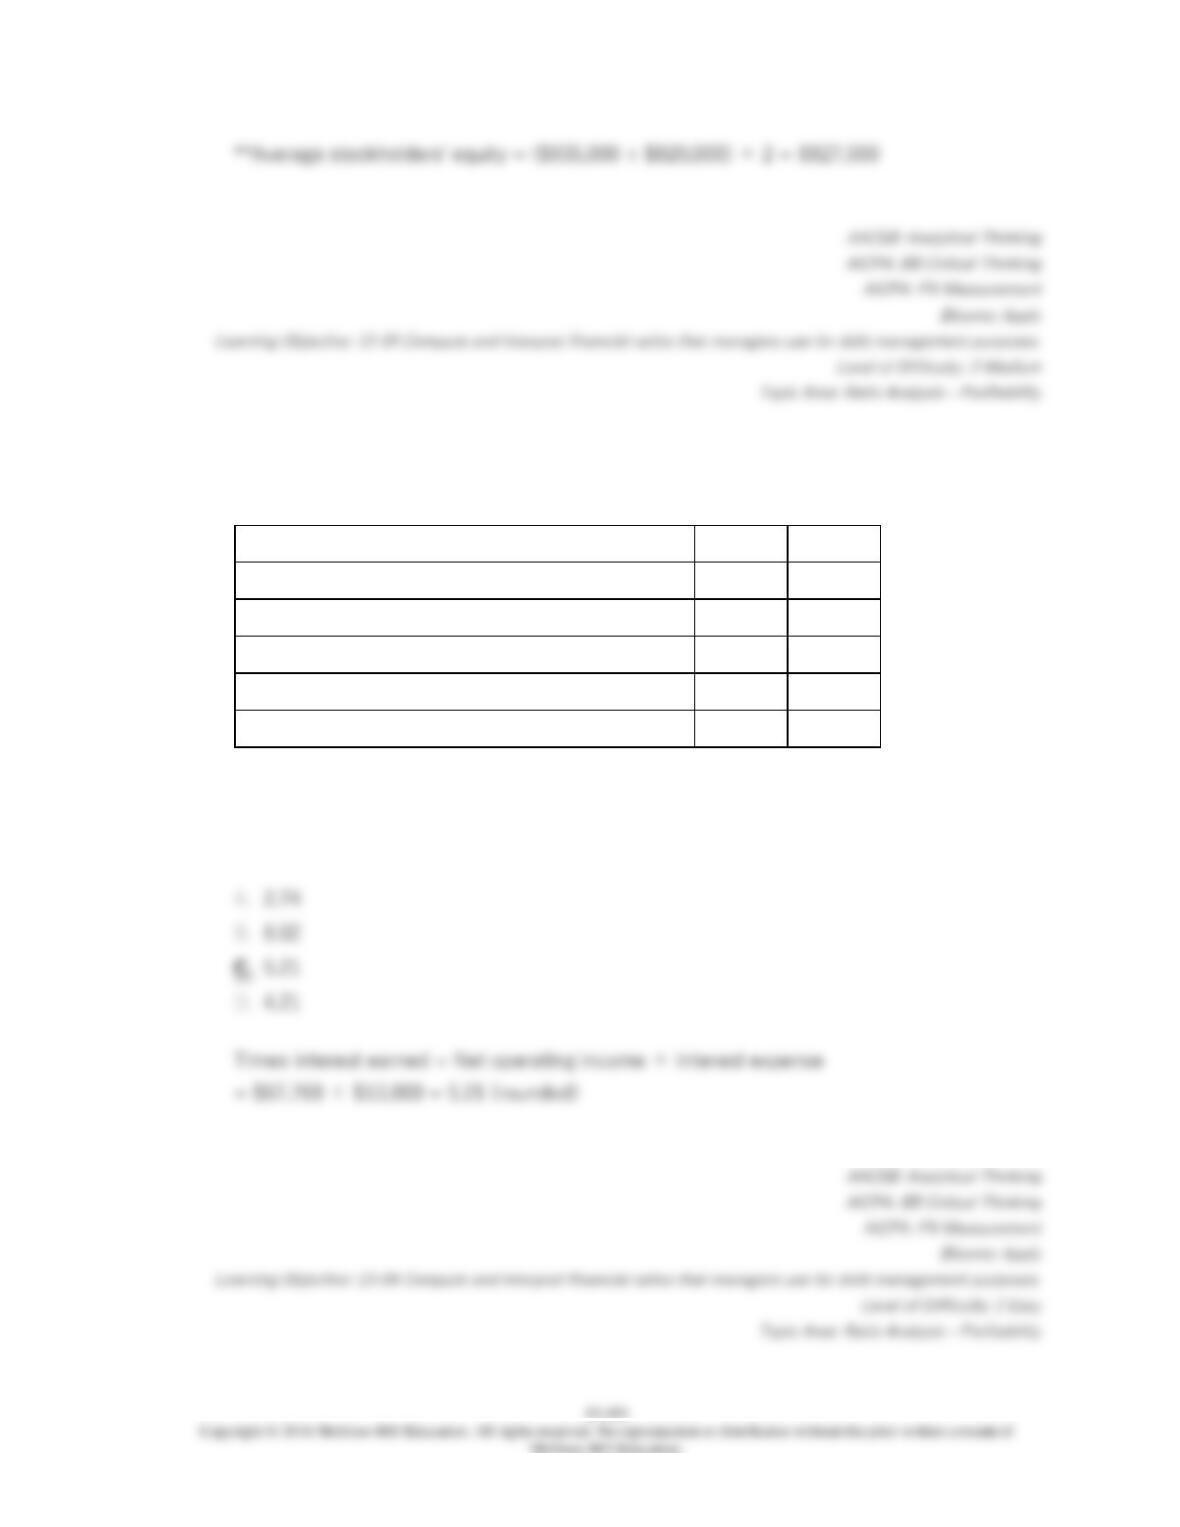
198.
Deacon Corporation has provided the following financial data from its balance sheet and
income statement:
Year 2
Year 1
Total assets
$1,198,000
$1,160,000
Total liabilities
$466,000
$460,000
Total stockholders’ equity
$732,000
$700,000
Net operating income (income before interest and taxes)
$67,769
Interest expense
$13,000
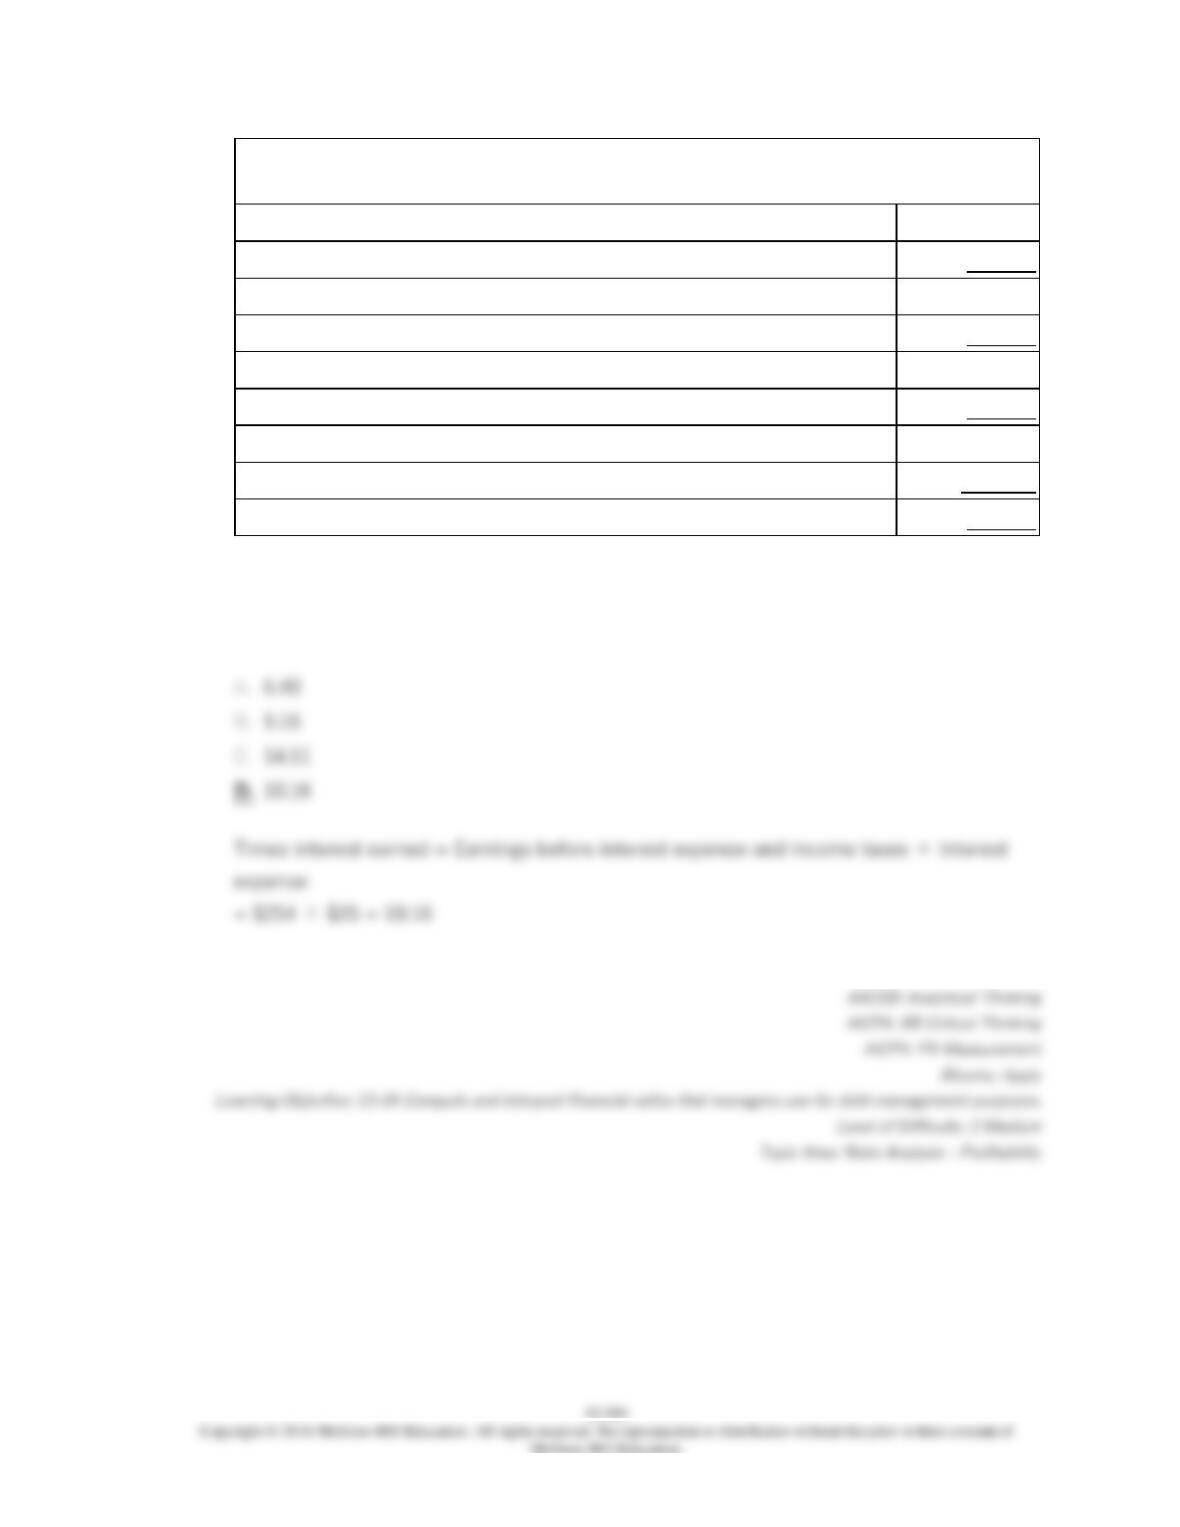
The company’s times interest earned for Year 2 is closest to:
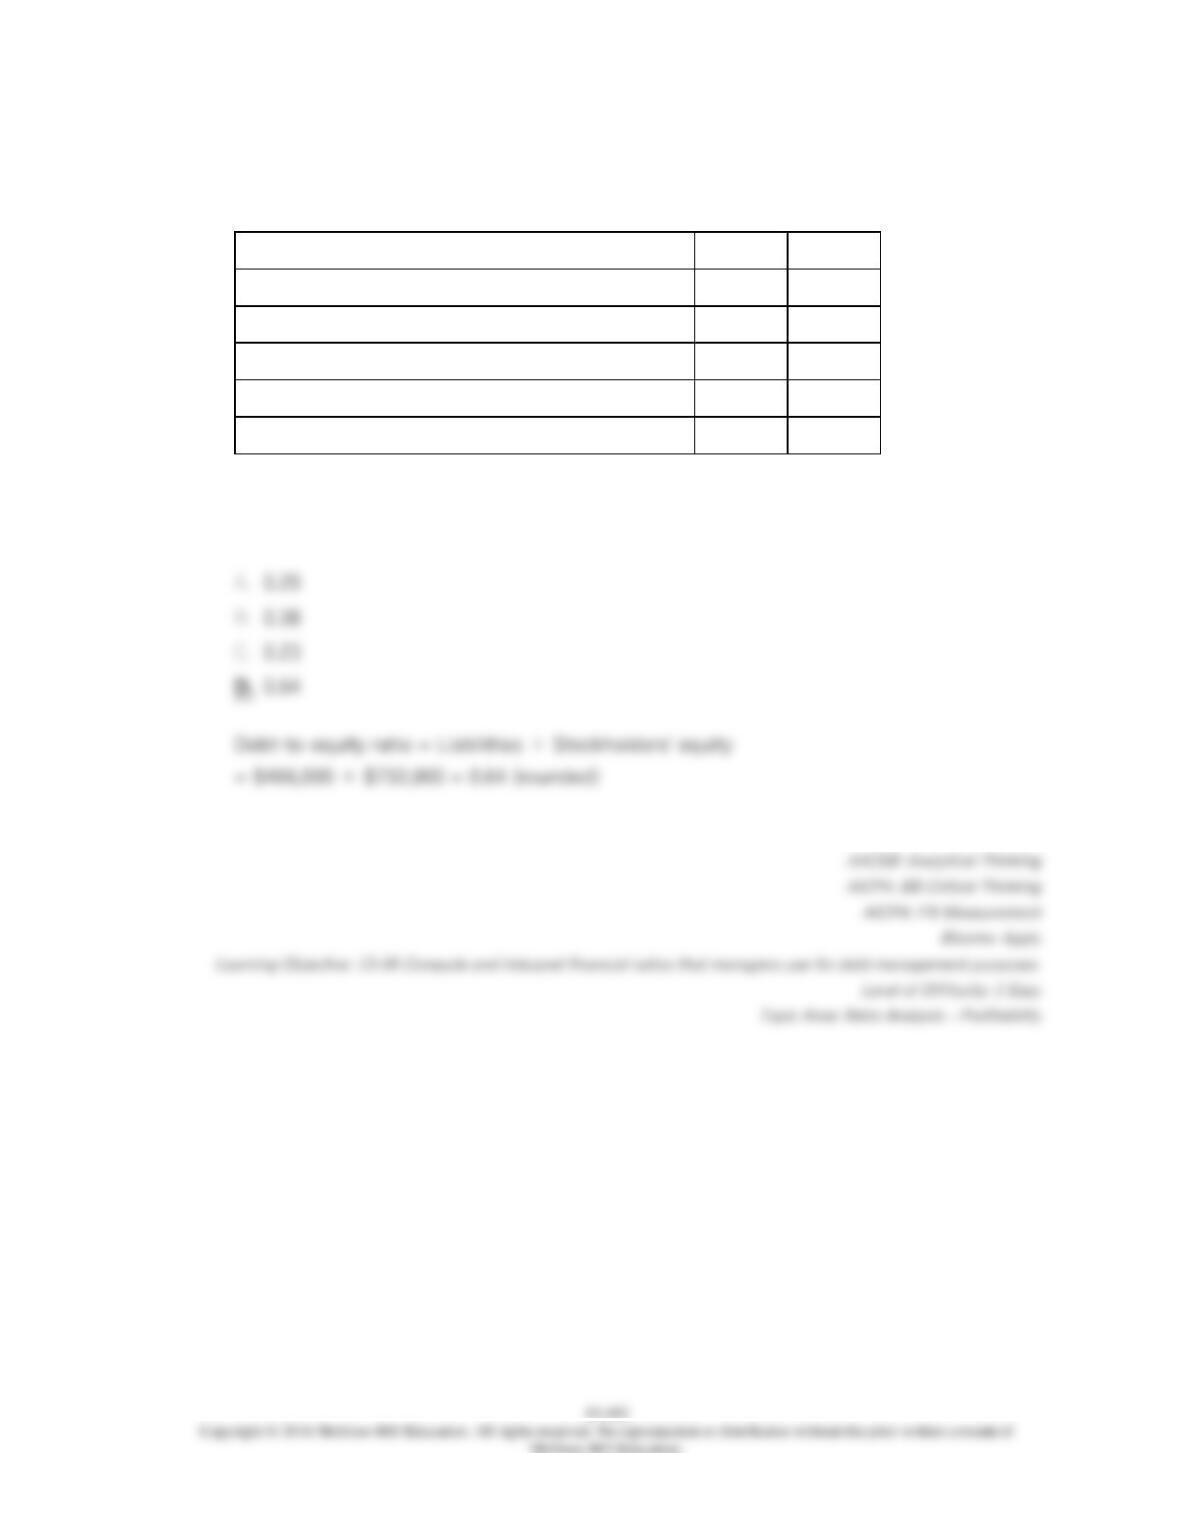
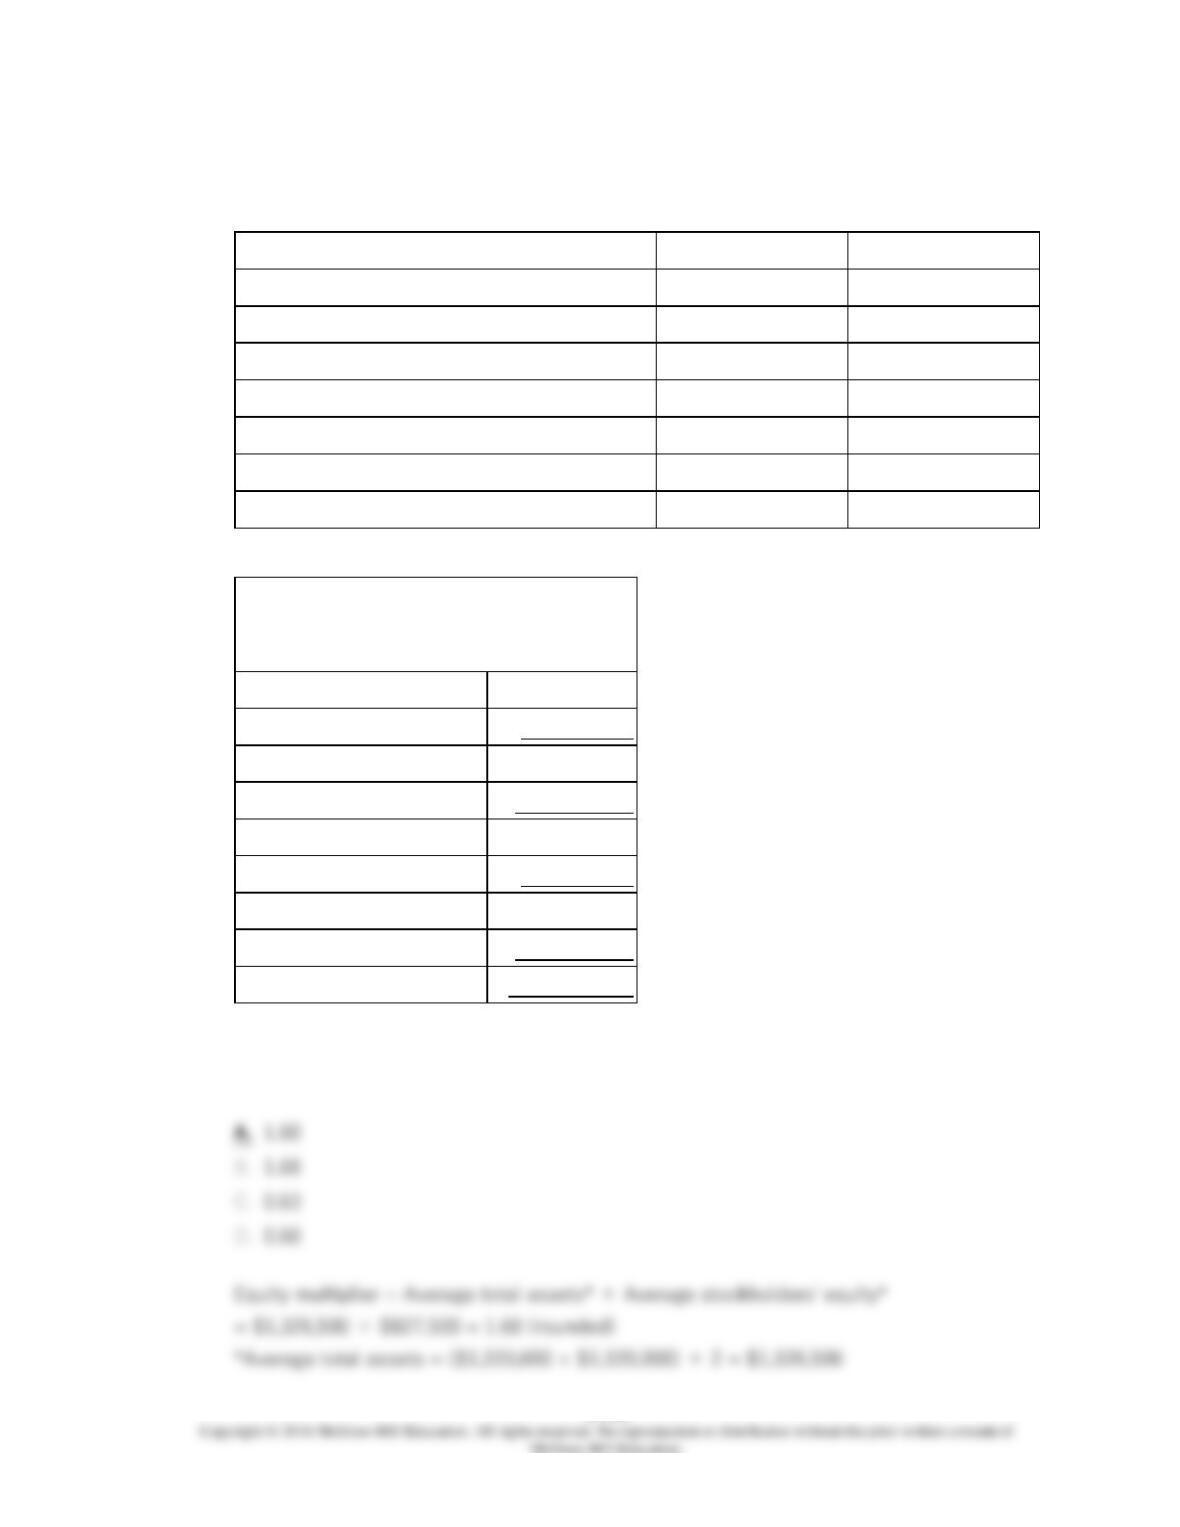
199.
Deacon Corporation has provided the following financial data from its balance sheet and
income statement:
Year 2
Year 1
Total assets
$1,198,000
$1,160,000
Total liabilities
$466,000
$460,000
Total stockholders’ equity
$732,000
$700,000
Net operating income (income before interest and taxes)
$67,769
Interest expense
$13,000
The company’s debt-to-equity ratio at the end of Year 2 is closest to:
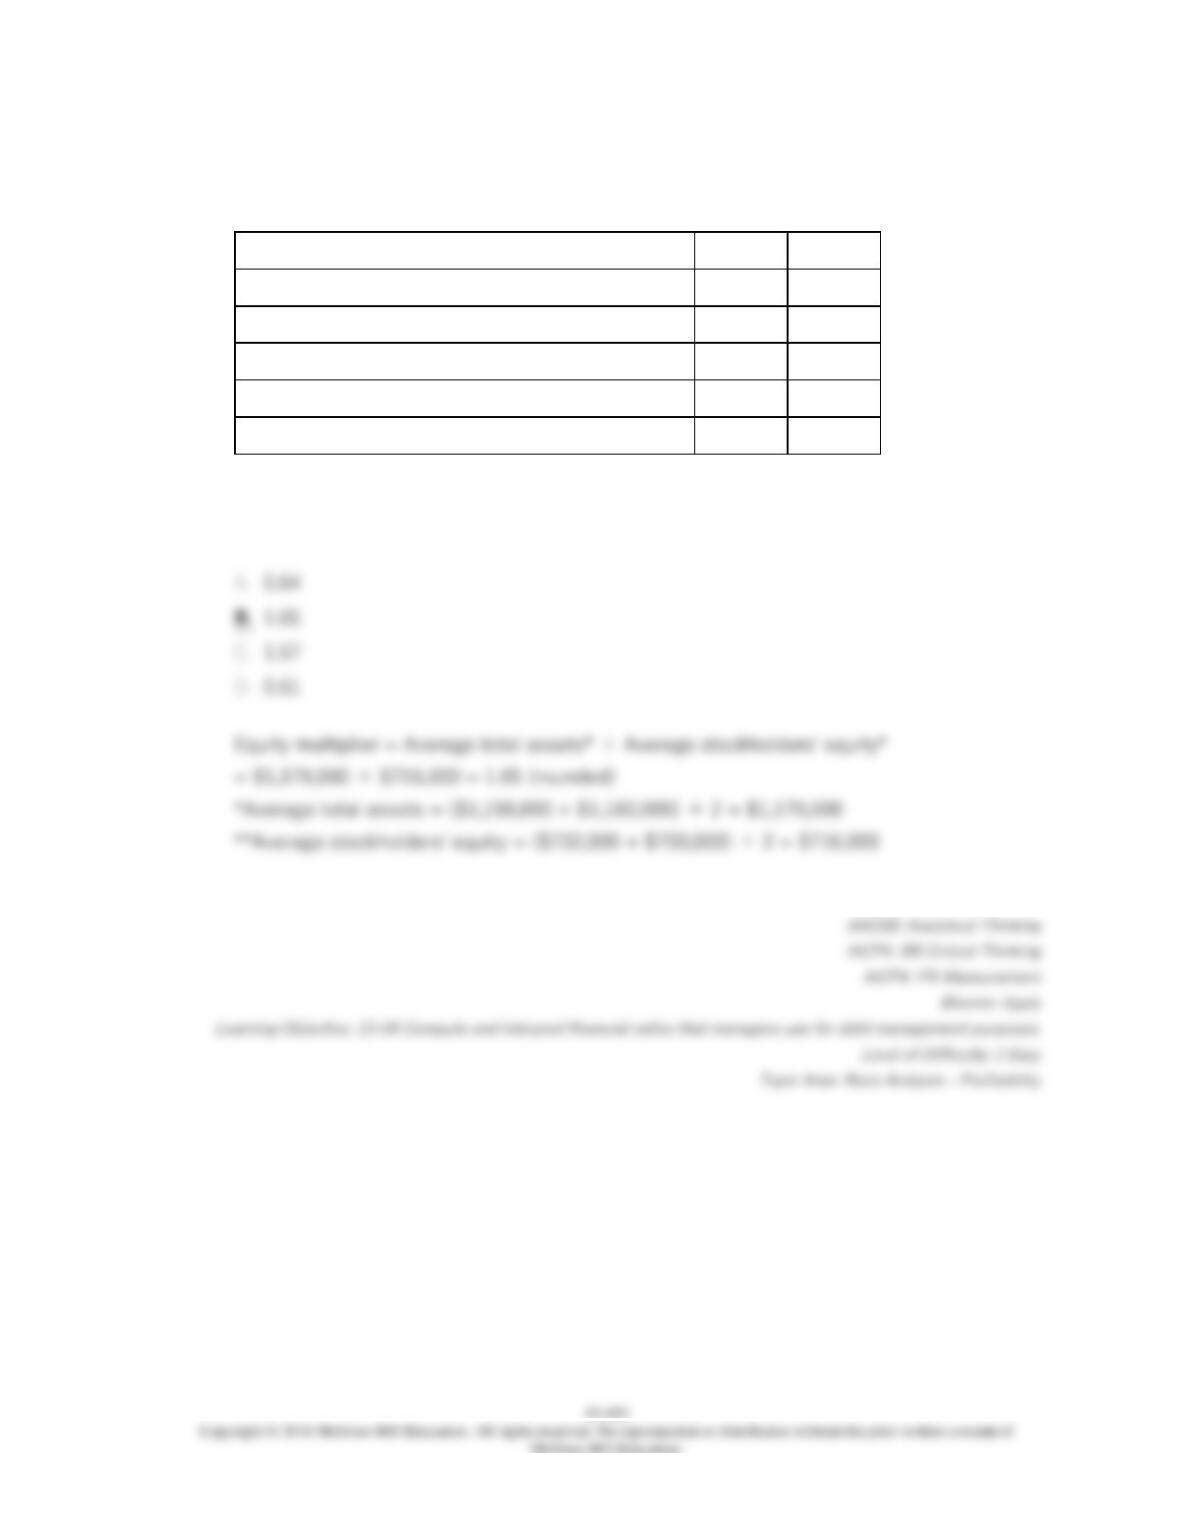
200.
Deacon Corporation has provided the following financial data from its balance sheet and
income statement:
Year 2
Year 1
Total assets
$1,198,000
$1,160,000
Total liabilities
$466,000
$460,000
Total stockholders’ equity
$732,000
$700,000
Net operating income (income before interest and taxes)
$67,769
Interest expense
$13,000
The company’s equity multiplier at the end of Year 2 is closest to:

13–494
201.
Fayer Corporation has provided the following financial data:
Balance Sheet
December 31, Year 2 and Year 1
Assets
Year 2
Year 1
Current assets:
Cash
$161,000
$180,000
Accounts receivable
110,000
130,000
Inventory
181,000
160,000
Prepaid expenses
57,000
70,000
Total current assets
509,000
540,000
Plant and equipment, net
1,044,000
960,000
Total assets
$1,553,000
$1,500,000
Liabilities and Stockholders’ Equity
Current liabilities:
Accounts payable
$188,000
$160,000
Accrued liabilities
57,000
60,000
Notes payable, short term
36,000
40,000
Total current liabilities
281,000
260,000
Bonds payable
200,000
200,000
Total liabilities
481,000
460,000
Stockholders’ equity:
Common stock, $4 par value
200,000
200,000
Additional paid-in capital-common stock
80,000
80,000
Retained earnings
792,000
760,000
Total stockholders’ equity
1,072,000
1,040,000
Total liabilities & stockholders’ equity
$1,553,000
$1,500,000
Income Statement—Year 2
For the Year Ended December 31, Year 2
Sales (all on account)
$1,220,000
Cost of goods sold
760,000
Gross margin
460,000
Operating expenses
389,846
Net operating income
70,154
Interest expense
14,000
Net income before taxes
56,154
Income taxes (35%)
19,654
Net income
$36,500
Dividends on common stock during Year 2 totaled $4,500. The market price of common
stock at the end of Year 2 was $10.88 per share.
The company’s times interest earned for Year 2 is closest to:
13–496
202.
Fayer Corporation has provided the following financial data:
Balance Sheet
December 31, Year 2 and Year 1
Assets
Year 2
Year 1
Current assets:
Cash
$161,000
$180,000
Accounts receivable
110,000
130,000
Inventory
181,000
160,000
Prepaid expenses
57,000
70,000
Total current assets
509,000
540,000
Plant and equipment, net
1,044,000
960,000
Total assets
$1,553,000
$1,500,000
Liabilities and Stockholders’ Equity
Current liabilities:
Accounts payable
$188,000
$160,000
Accrued liabilities
57,000
60,000
Notes payable, short term
36,000
40,000
Total current liabilities
281,000
260,000
Bonds payable
200,000
200,000
Total liabilities
481,000
460,000
Stockholders’ equity:
Common stock, $4 par value
200,000
200,000
Additional paid-in capital-common stock
80,000
80,000
Retained earnings
792,000
760,000
Total stockholders’ equity
1,072,000
1,040,000
Total liabilities & stockholders’ equity
$1,553,000
$1,500,000
Income Statement—Year 2
For the Year Ended December 31, Year 2
Sales (all on account)
$1,220,000
Cost of goods sold
760,000
Gross margin
460,000
Operating expenses
389,846
Net operating income
70,154
Interest expense
14,000
Net income before taxes
56,154
Income taxes (35%)
19,654
Net income
$36,500
Dividends on common stock during Year 2 totaled $4,500. The market price of common
stock at the end of Year 2 was $10.88 per share.
The company’s debt-to-equity ratio at the end of Year 2 is closest to:
13–498
203.
Fayer Corporation has provided the following financial data:
Balance Sheet
December 31, Year 2 and Year 1
Assets
Year 2
Year 1
Current assets:
Cash
$161,000
$180,000
Accounts receivable
110,000
130,000
Inventory
181,000
160,000
Prepaid expenses
57,000
70,000
Total current assets
509,000
540,000
Plant and equipment, net
1,044,000
960,000
Total assets
$1,553,000
$1,500,000
Liabilities and Stockholders’ Equity
Current liabilities:
Accounts payable
$188,000
$160,000
Accrued liabilities
57,000
60,000
Notes payable, short term
36,000
40,000
Total current liabilities
281,000
260,000
Bonds payable
200,000
200,000
Total liabilities
481,000
460,000
Stockholders’ equity:
Common stock, $4 par value
200,000
200,000
Additional paid-in capital-common stock
80,000
80,000
Retained earnings
792,000
760,000
Total stockholders’ equity
1,072,000
1,040,000
Total liabilities & stockholders’ equity
$1,553,000
$1,500,000
Income Statement—Year 2
For the Year Ended December 31, Year 2
Sales (all on account)
$1,220,000
Cost of goods sold
760,000
Gross margin
460,000
Operating expenses
389,846
Net operating income
70,154
Interest expense
14,000
Net income before taxes
56,154
Income taxes (35%)
19,654
Net income
$36,500
Dividends on common stock during Year 2 totaled $4,500. The market price of common
stock at the end of Year 2 was $10.88 per share.
The company’s equity multiplier at the end of Year 2 is closest to:

13–500
204.
Tweedle Corporation’s most recent balance sheet and income statement appear below:
Balance Sheet
December 31, Year 2 and Year 1
(in thousands of dollars)
Year 2
Year 1
Assets
Current assets:
Cash
$140
$130
Accounts receivable
200
210
Inventory
150
180
Prepaid expenses
20
20
Total current assets
510
540
Plant and equipment, net
950
910
Total assets
$1,460
$1,450
Liabilities and Stockholders’ Equity
Current liabilities:
Accounts payable
$130
$150
Accrued liabilities
70
70
Notes payable, short term
70
60
Total current liabilities
270
280
Bonds payable
170
190
Total liabilities
440
470
Stockholders’ equity:
Common stock, $1 par value
200
200
Additional paid-in capital-common stock
320
320
Retained earnings
500
460
Total stockholders’ equity
1,020
980
Total liabilities & stockholders’ equity
$1,460
$1,450
Income Statement
For the Year Ended December 31, Year 2
(in thousands of dollars)
Sales (all on account)
$1,190
Cost of goods sold
710
Gross margin
480
Selling and administrative expense
226
Net operating income
254
Interest expense
25
Net income before taxes
229
Income taxes (30%)
69
Net income
$160
The times interest earned for Year 2 is closest to:
13–502
205.
Tweedle Corporation’s most recent balance sheet and income statement appear below:
Balance Sheet
December 31, Year 2 and Year 1
(in thousands of dollars)
Year 2
Year 1
Assets
Current assets:
Cash
$140
$130
Accounts receivable
200
210
Inventory
150
180
Prepaid expenses
20
20
Total current assets
510
540
Plant and equipment, net
950
910
Total assets
$1,460
$1,450
Liabilities and Stockholders’ Equity
Current liabilities:
Accounts payable
$130
$150
Accrued liabilities
70
70
Notes payable, short term
70
60
Total current liabilities
270
280
Bonds payable
170
190
Total liabilities
440
470
Stockholders’ equity:
Common stock, $1 par value
200
200
Additional paid-in capital-common stock
320
320
Retained earnings
500
460
Total stockholders’ equity
1,020
980
Total liabilities & stockholders’ equity
$1,460
$1,450
Income Statement
For the Year Ended December 31, Year 2
(in thousands of dollars)
Sales (all on account)
$1,190
Cost of goods sold
710
Gross margin
480
Selling and administrative expense
226
Net operating income
254
Interest expense
25
Net income before taxes
229
Income taxes (30%)
69
Net income
$160
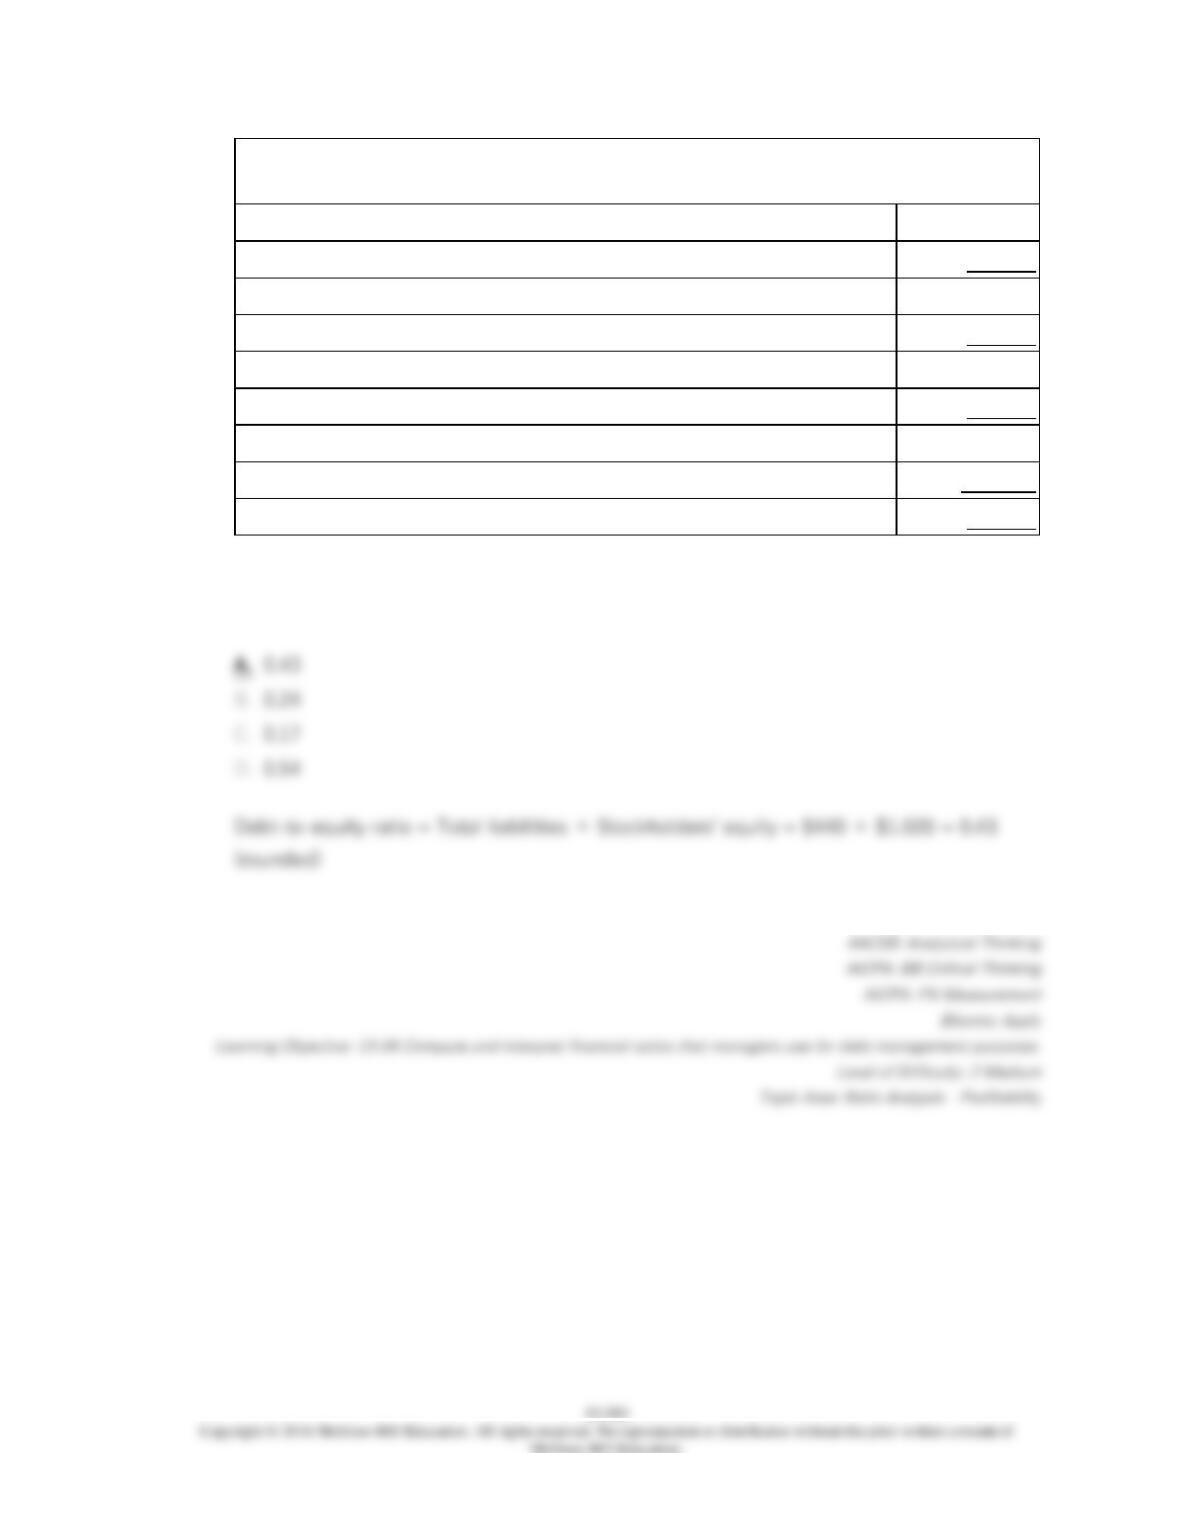
The debt-to-equity ratio at the end of Year 2 is closest to:
13–504
206.
Data from Lheureux Corporation’s most recent balance sheet and the company’s income
statement appear below:
Year
2
Year
1
Total assets
$1,440
$1,480
Total liabilities
$400
$450
Total stockholders’
equity
$1,040
$1,030
Income Statement
For the Year Ended December 31, Year 2
(in thousands of dollars)
Sales (all on account)
$1,280
Cost of goods sold
850
Gross margin
430
Selling and administrative expense
355
Net operating income
75
Interest expense
18
Net income before taxes
57
Income taxes (30%)
17
Net income
$40
The times interest earned for Year 2 is closest to: