Unlock document.
This document is partially blurred.
Unlock all pages and 1 million more documents.
Get Access

13-181
189. Mahoe Corporation has provided the following financial data:
Balance Sheet
December 31, Year 2 and Year 1
Assets Year 2 Year 1
Current assets:
Cash $105,000 $190,000
Accounts receivable 255,000 220,000
Inventory 206,000 200,000
Prepaid expenses 44,000 50,000
Total current assets 610,000 660,000
Plant and equipment, net 1,065,000 970,000
Total assets $1,675,000 $1,630,000
Liabilities and Stockholders' Equity
Current liabilities:
Accounts payable $119,000 $110,000
Accrued liabilities 88,000 80,000
Notes payable, short term 53,000 50,000
Total current liabilities 260,000 240,000
Bonds payable 110,000 110,000
Total liabilities 370,000 350,000
Stockholders' equity:
Common stock, $5 par value 250,000 250,000
Additional paid-in capital-common stock 70,000 70,000
Retained earnings 985,000 960,000
Total stockholders' equity 1,305,000 1,280,000
Total liabilities & stockholders' equity $1,675,000 $1,630,000
Income Statement—Year 2
For the Year Ended December 31, Year 2
Sales (all on account) $1,330,000
Cost of goods sold 890,000
Gross margin 440,000
Operating expenses 393,571
Net operating income 46,429
Interest expense 10,000
Net income before taxes 36,429
Income taxes (30%) 10,929
Net income $25,500
Dividends on common stock during Year 2 totaled $500. The market price of common stock at
the end of Year 2 was $8.06 per share.
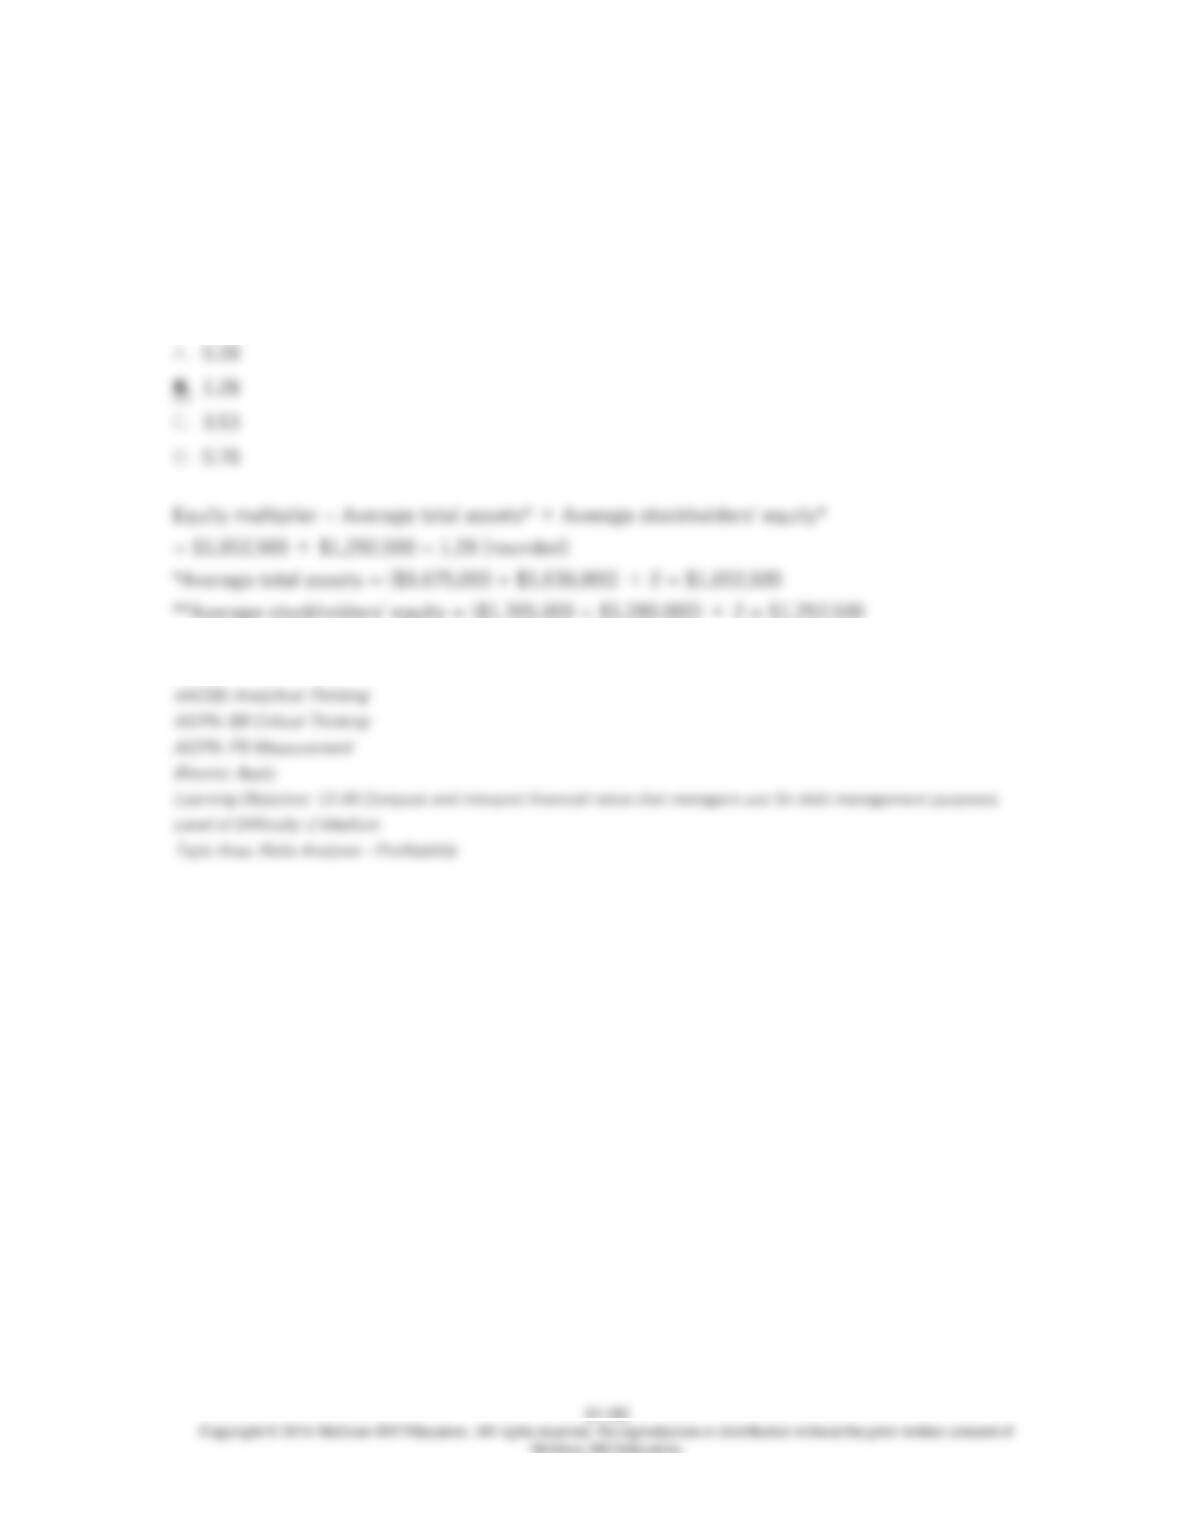
The company's equity multiplier at the end of Year 2 is closest to:
190. Burdick Corporation has provided the following financial data from its balance sheet:
Year 2 Year 1
Accounts receivable $266,000 $250,000
Inventory $162,000 $190,000
Total assets $1,415,000 $1,390,000
Total stockholders' equity $991,000 $970,000
Sales (all on account) in Year 2 amounted to $1,410,000 and the cost of goods sold was
$860,000.
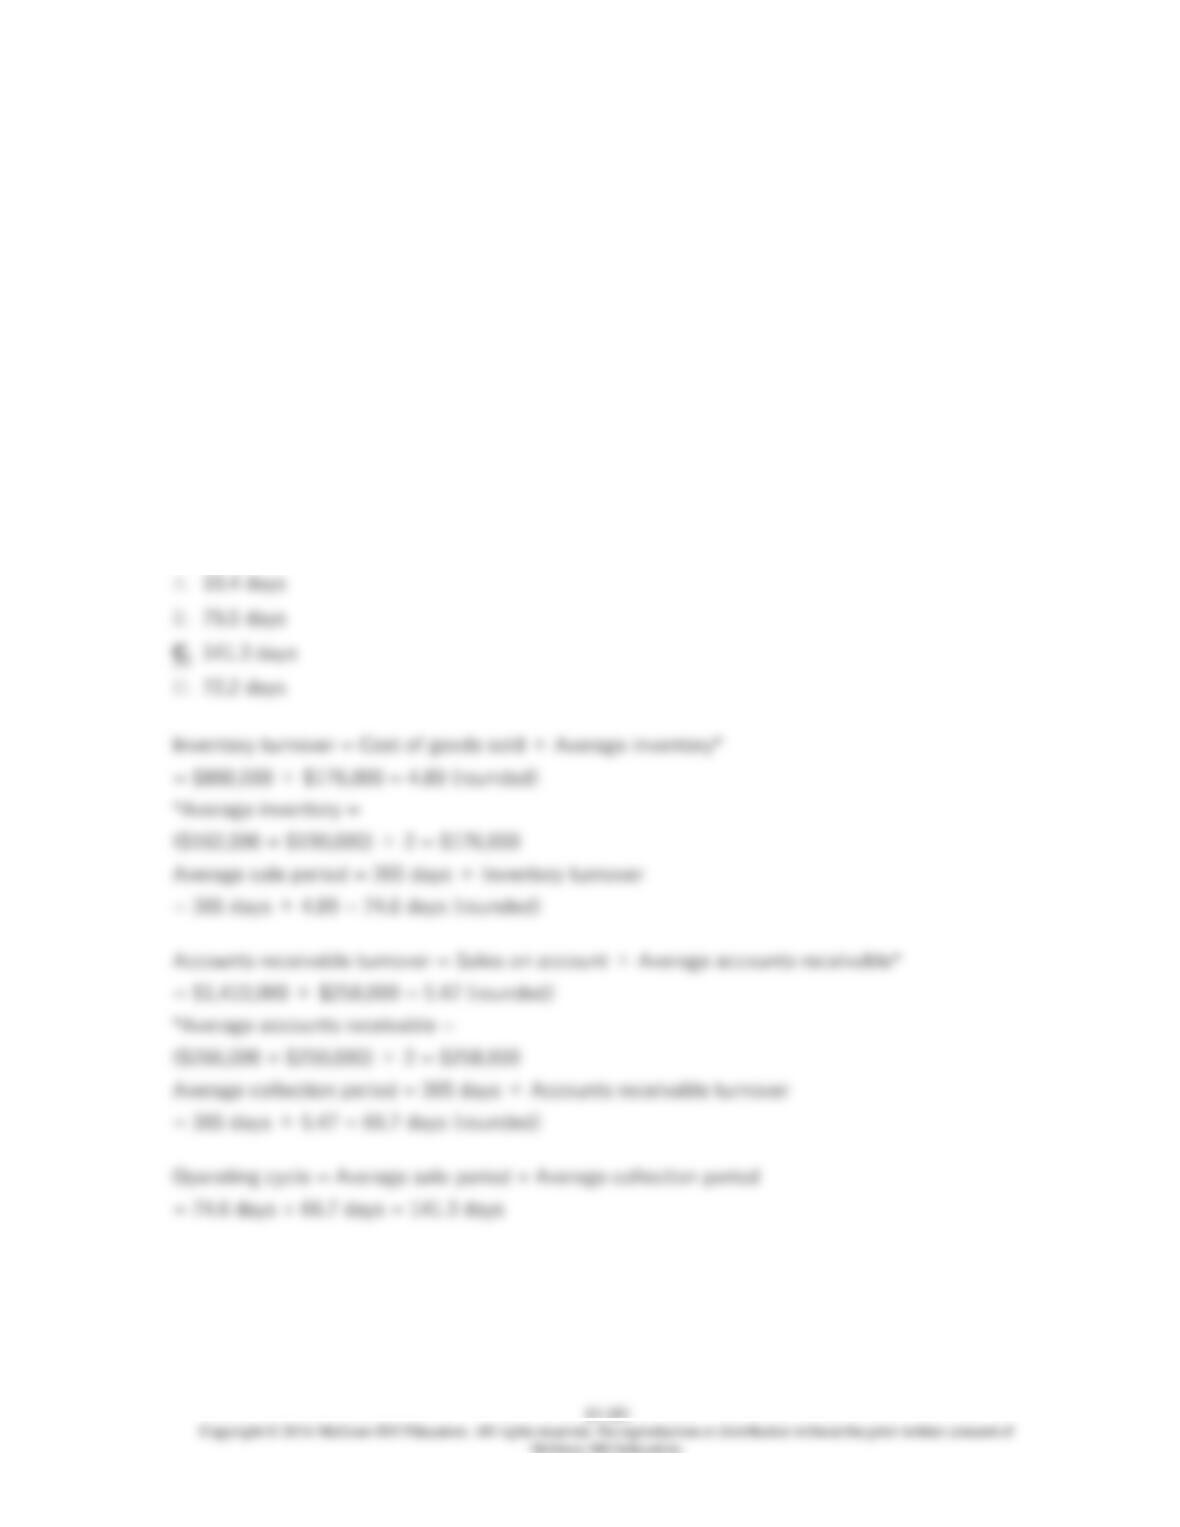
The company's operating cycle for Year 2 is closest to:
191. Burdick Corporation has provided the following financial data from its balance sheet:
Year 2 Year 1
Accounts receivable $266,000 $250,000
Inventory $162,000 $190,000
Total assets $1,415,000 $1,390,000
Total stockholders' equity $991,000 $970,000
Sales (all on account) in Year 2 amounted to $1,410,000 and the cost of goods sold was
$860,000.
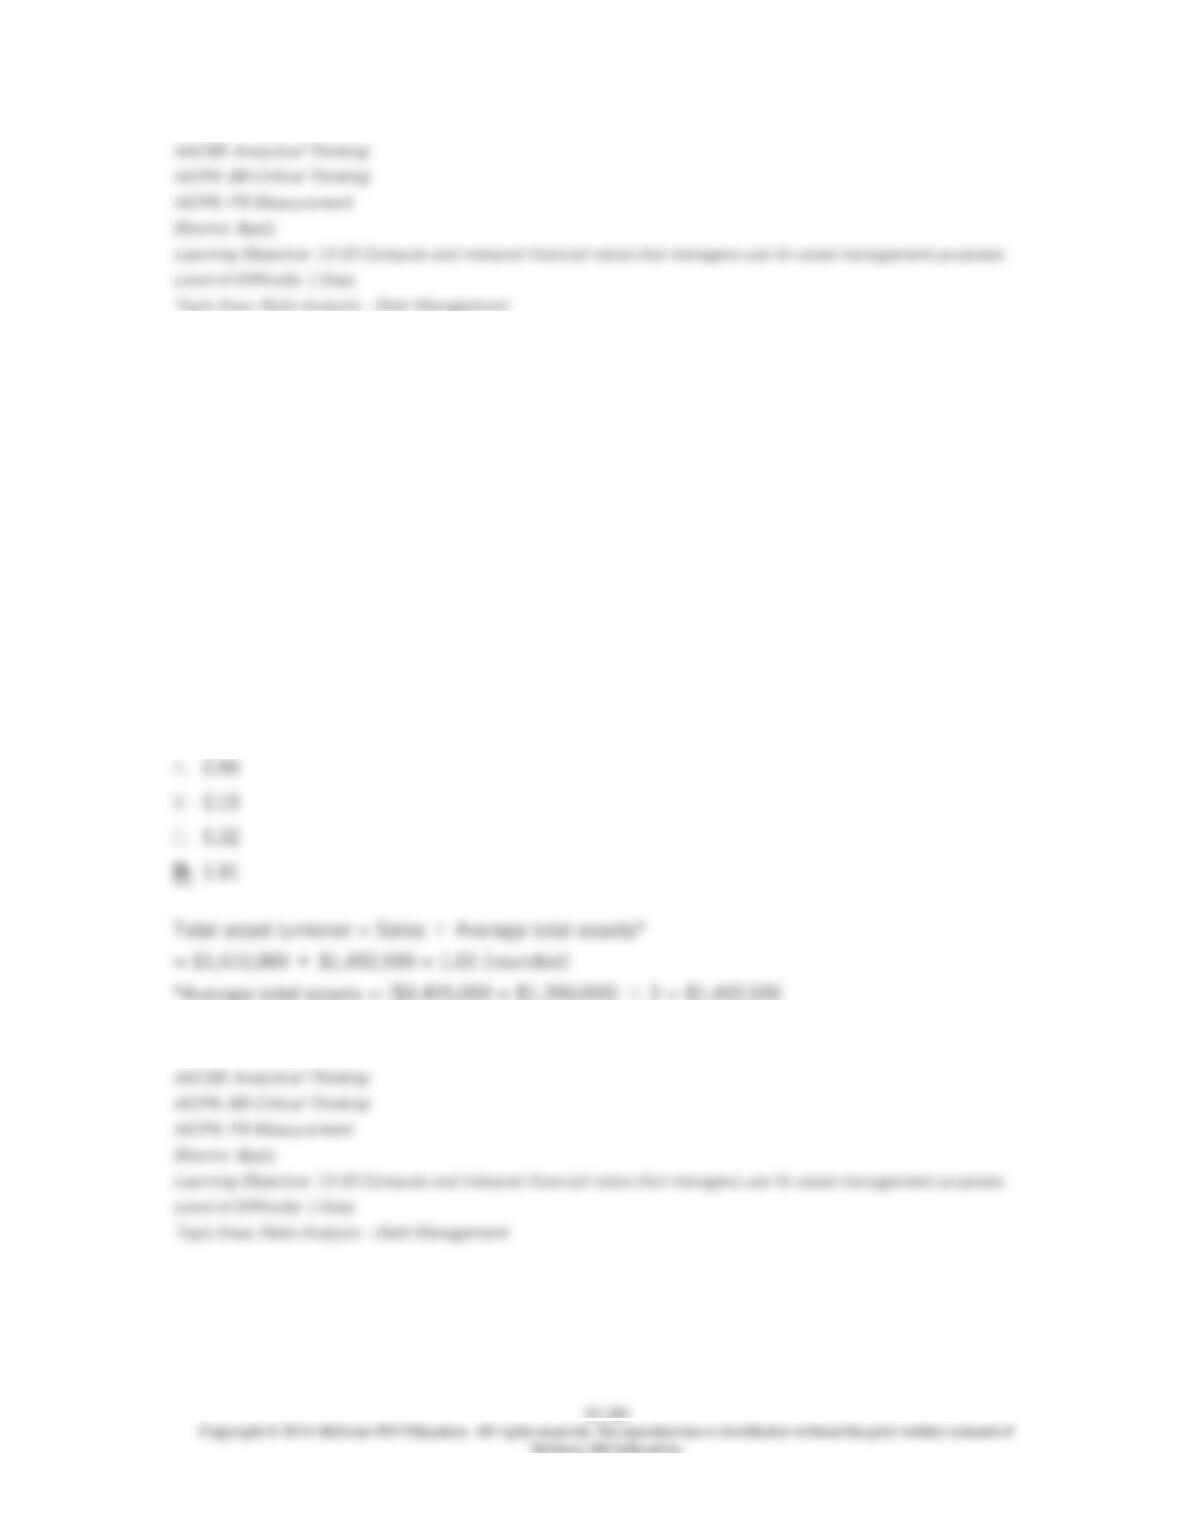
The company's total asset turnover for Year 2 is closest to:
192. Burdick Corporation has provided the following financial data from its balance sheet:
Year 2 Year 1
Accounts receivable $266,000 $250,000
Inventory $162,000 $190,000
Total assets $1,415,000 $1,390,000
Total stockholders' equity $991,000 $970,000
Sales (all on account) in Year 2 amounted to $1,410,000 and the cost of goods sold was
$860,000.
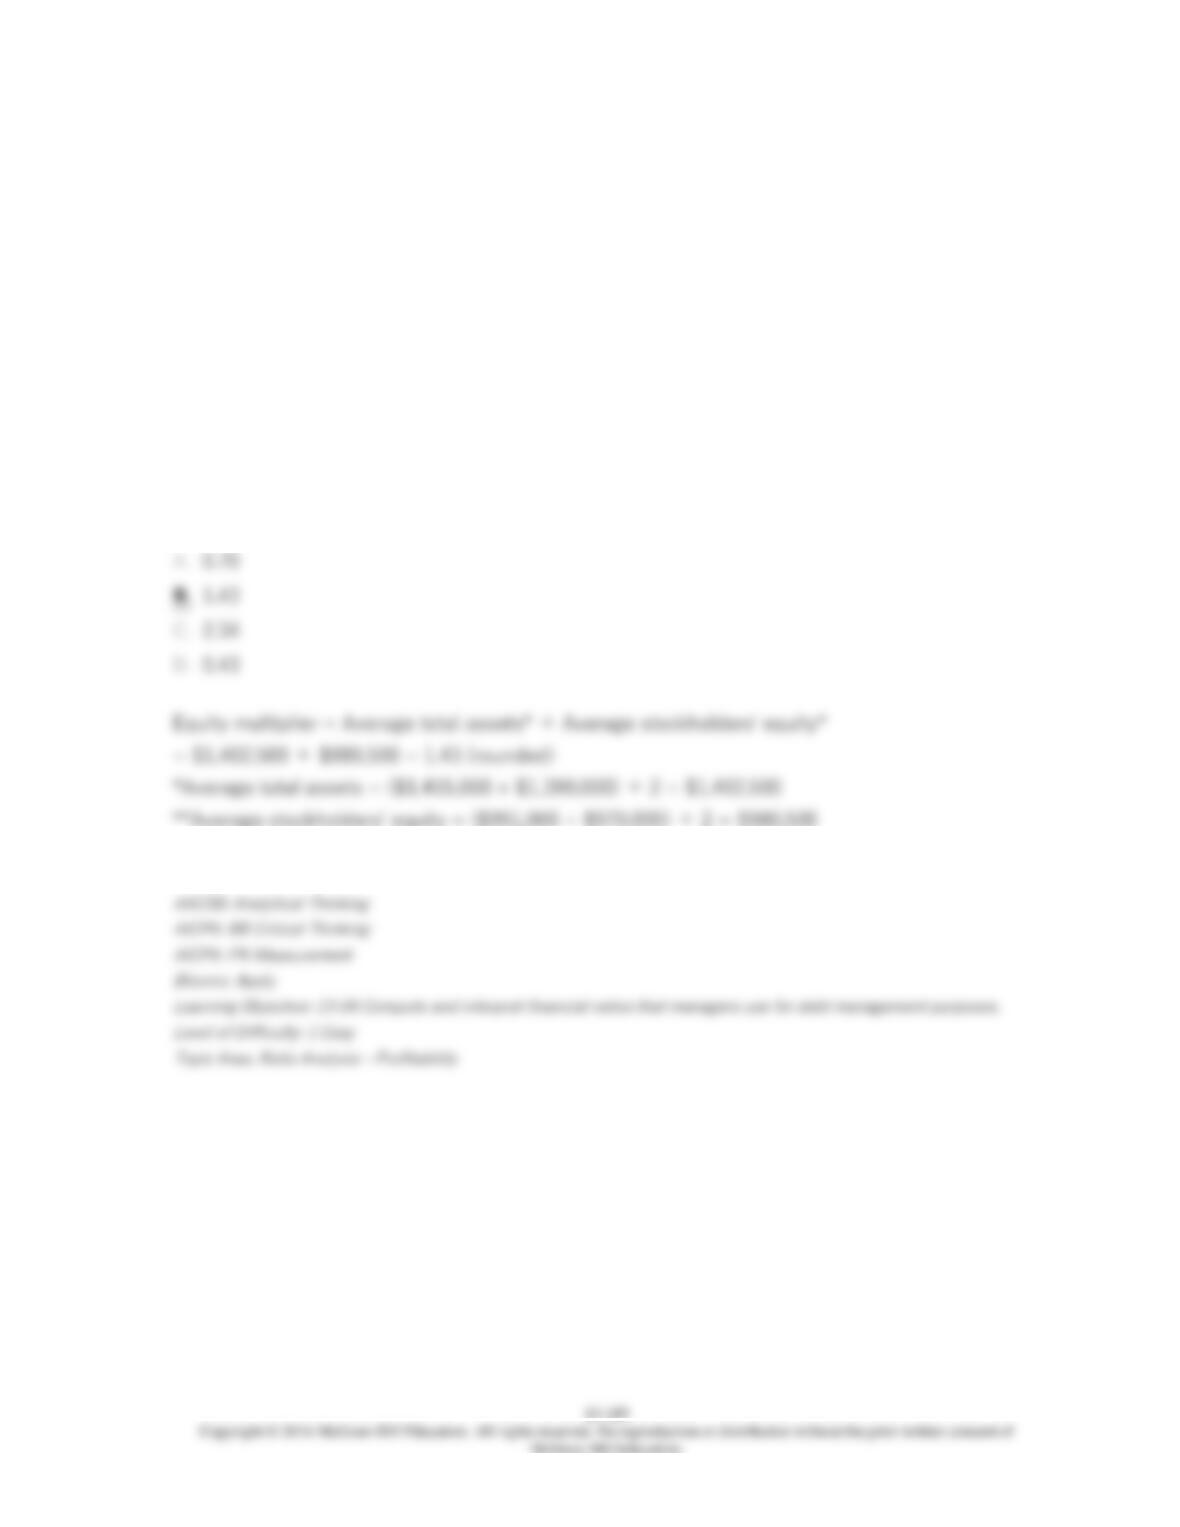
The company's equity multiplier at the end of Year 2 is closest to:

13-186
193. Financial statements for Narstad Corporation appear below:
Narstad Corporation
Balance Sheet
December 31, Year 2 and Year 1
(dollars in thousands)
Current assets:
Cash and marketable securities $100 $100
Accounts receivable, net 220 190
Inventory 190 180
Prepaid expenses 10 20
Total current assets 520 490
Plant & equipment, net 1,940 1,940
Total assets $2,460 $2,430
Current liabilities:
Accounts payable $150 $150
Accrued liabilities 90 70
Notes payable, short term 100 150
Total current liabilities 340 370
Bonds payable 310 300
Total liabilities 650 670
Stockholders’ equity:
Common stock, $2 par 180 180
Additional paid-in capital-common stock 330 330
Retained earnings 1,300 1,250
Total stockholders’ equity 1,810 1,760
Total liabilities & stockholders’ equity $2,460 $2,430
Narstad Corporation
Income Statement
For the Year Ended December 31, Year 2
(dollars in thousands)
Sales (all on account) $1,770
Cost of goods sold 1,230
Gross margin 540
Selling and administrative expense 210
Net operating income 330
Interest expense 30
Net income before taxes 300
Income taxes (30%) 90
Net income $210
Narstad Corporation's times interest earned for Year 2 was closest to:
13-188
194. Financial statements for Narstad Corporation appear below:
Narstad Corporation
Balance Sheet
December 31, Year 2 and Year 1
(dollars in thousands)
Current assets:
Cash and marketable securities $100 $100
Accounts receivable, net 220 190
Inventory 190 180
Prepaid expenses 10 20
Total current assets 520 490
Plant & equipment, net 1,940 1,940
Total assets $2,460 $2,430
Current liabilities:
Accounts payable $150 $150
Accrued liabilities 90 70
Notes payable, short term 100 150
Total current liabilities 340 370
Bonds payable 310 300
Total liabilities 650 670
Stockholders’ equity:
Common stock, $2 par 180 180
Additional paid-in capital-common stock 330 330
Retained earnings 1,300 1,250
Total stockholders’ equity 1,810 1,760
Total liabilities & stockholders’ equity $2,460 $2,430
Narstad Corporation
Income Statement
For the Year Ended December 31, Year 2
(dollars in thousands)
Sales (all on account) $1,770
Cost of goods sold 1,230
Gross margin 540
Selling and administrative expense 210
Net operating income 330
Interest expense 30
Net income before taxes 300
Income taxes (30%) 90
Net income $210
Narstad Corporation's debt-to-equity ratio at the end of Year 2 was closest to:
195. Lasch Corporation has provided the following financial data from its balance sheet and
income statement:
Year 2 Year 1
Total assets $1,333,000 $1,320,000
Accounts payable $158,000 $160,000
Accrued liabilities $43,000 $40,000
Notes payable, short term $47,000 $50,000
Bonds payable $250,000 $250,000
Total liabilities $498,000 $500,000
Total stockholders' equity $835,000 $820,000
Income Statement—Year 2
For the Year Ended December 31, Year 2
Sales (all on account) $1,250,000
Cost of goods sold 840,000
Gross margin 410,000
Operating expenses 366,286
Net operating income 43,714
Interest expense 18,000
Net income before taxes 25,714
Income taxes (30%) 7,714
Net income $18,000
The company's times interest earned for Year 2 is closest to:

196. Lasch Corporation has provided the following financial data from its balance sheet and
income statement:
Year 2 Year 1
Total assets $1,333,000 $1,320,000
Accounts payable $158,000 $160,000
Accrued liabilities $43,000 $40,000
Notes payable, short term $47,000 $50,000
Bonds payable $250,000 $250,000
Total liabilities $498,000 $500,000
Total stockholders' equity $835,000 $820,000
Income Statement—Year 2
For the Year Ended December 31, Year 2
Sales (all on account) $1,250,000
Cost of goods sold 840,000
Gross margin 410,000
Operating expenses 366,286
Net operating income 43,714
Interest expense 18,000
Net income before taxes 25,714
Income taxes (30%) 7,714
Net income $18,000
The company's debt-to-equity ratio at the end of Year 2 is closest to:
197. Lasch Corporation has provided the following financial data from its balance sheet and
income statement:
Year 2 Year 1
Total assets $1,333,000 $1,320,000
Accounts payable $158,000 $160,000
Accrued liabilities $43,000 $40,000
Notes payable, short term $47,000 $50,000
Bonds payable $250,000 $250,000
Total liabilities $498,000 $500,000
Total stockholders' equity $835,000 $820,000
Income Statement—Year 2
For the Year Ended December 31, Year 2
Sales (all on account) $1,250,000
Cost of goods sold 840,000
Gross margin 410,000
Operating expenses 366,286
Net operating income 43,714
Interest expense 18,000
Net income before taxes 25,714
Income taxes (30%) 7,714
Net income $18,000
The company's equity multiplier at the end of Year 2 is closest to:
198. Deacon Corporation has provided the following financial data from its balance sheet and
income statement:
Year 2 Year 1
Total assets $1,198,000 $1,160,000
Total liabilities $466,000 $460,000
Total stockholders' equity $732,000 $700,000
Net operating income (income before interest and taxes) $67,769
Interest expense $13,000
The company's times interest earned for Year 2 is closest to:
199. Deacon Corporation has provided the following financial data from its balance sheet and
income statement:
Year 2 Year 1
Total assets $1,198,000 $1,160,000
Total liabilities $466,000 $460,000
Total stockholders' equity $732,000 $700,000
Net operating income (income before interest and taxes) $67,769
Interest expense $13,000
The company's debt-to-equity ratio at the end of Year 2 is closest to:
200. Deacon Corporation has provided the following financial data from its balance sheet and
income statement:
Year 2 Year 1
Total assets $1,198,000 $1,160,000
Total liabilities $466,000 $460,000
Total stockholders' equity $732,000 $700,000
Net operating income (income before interest and taxes) $67,769
Interest expense $13,000
The company's equity multiplier at the end of Year 2 is closest to:

13-198
201. Fayer Corporation has provided the following financial data:
Balance Sheet
December 31, Year 2 and Year 1
Assets Year 2 Year 1
Current assets:
Cash $161,000 $180,000
Accounts receivable 110,000 130,000
Inventory 181,000 160,000
Prepaid expenses 57,000 70,000
Total current assets 509,000 540,000
Plant and equipment, net 1,044,000 960,000
Total assets $1,553,000 $1,500,000
Liabilities and Stockholders' Equity
Current liabilities:
Accounts payable $188,000 $160,000
Accrued liabilities 57,000 60,000
Notes payable, short term 36,000 40,000
Total current liabilities 281,000 260,000
Bonds payable 200,000 200,000
Total liabilities 481,000 460,000
Stockholders' equity:
Common stock, $4 par value 200,000 200,000
Additional paid-in capital-common stock 80,000 80,000
Retained earnings 792,000 760,000
Total stockholders' equity 1,072,000 1,040,000
Total liabilities & stockholders' equity $1,553,000 $1,500,000
Income Statement—Year 2
For the Year Ended December 31, Year 2
Sales (all on account) $1,220,000
Cost of goods sold 760,000
Gross margin 460,000
Operating expenses 389,846
Net operating income 70,154
Interest expense 14,000
Net income before taxes 56,154
Income taxes (35%) 19,654
Net income $36,500
Dividends on common stock during Year 2 totaled $4,500. The market price of common stock at
the end of Year 2 was $10.88 per share.
The company's times interest earned for Year 2 is closest to:

13-200
202. Fayer Corporation has provided the following financial data:
Balance Sheet
December 31, Year 2 and Year 1
Assets Year 2 Year 1
Current assets:
Cash $161,000 $180,000
Accounts receivable 110,000 130,000
Inventory 181,000 160,000
Prepaid expenses 57,000 70,000
Total current assets 509,000 540,000
Plant and equipment, net 1,044,000 960,000
Total assets $1,553,000 $1,500,000
Liabilities and Stockholders' Equity
Current liabilities:
Accounts payable $188,000 $160,000
Accrued liabilities 57,000 60,000
Notes payable, short term 36,000 40,000
Total current liabilities 281,000 260,000
Bonds payable 200,000 200,000
Total liabilities 481,000 460,000
Stockholders' equity:
Common stock, $4 par value 200,000 200,000
Additional paid-in capital-common stock 80,000 80,000
Retained earnings 792,000 760,000
Total stockholders' equity 1,072,000 1,040,000
Total liabilities & stockholders' equity $1,553,000 $1,500,000
Income Statement—Year 2
For the Year Ended December 31, Year 2
Sales (all on account) $1,220,000
Cost of goods sold 760,000
Gross margin 460,000
Operating expenses 389,846
Net operating income 70,154
Interest expense 14,000
Net income before taxes 56,154
Income taxes (35%) 19,654


