13–465
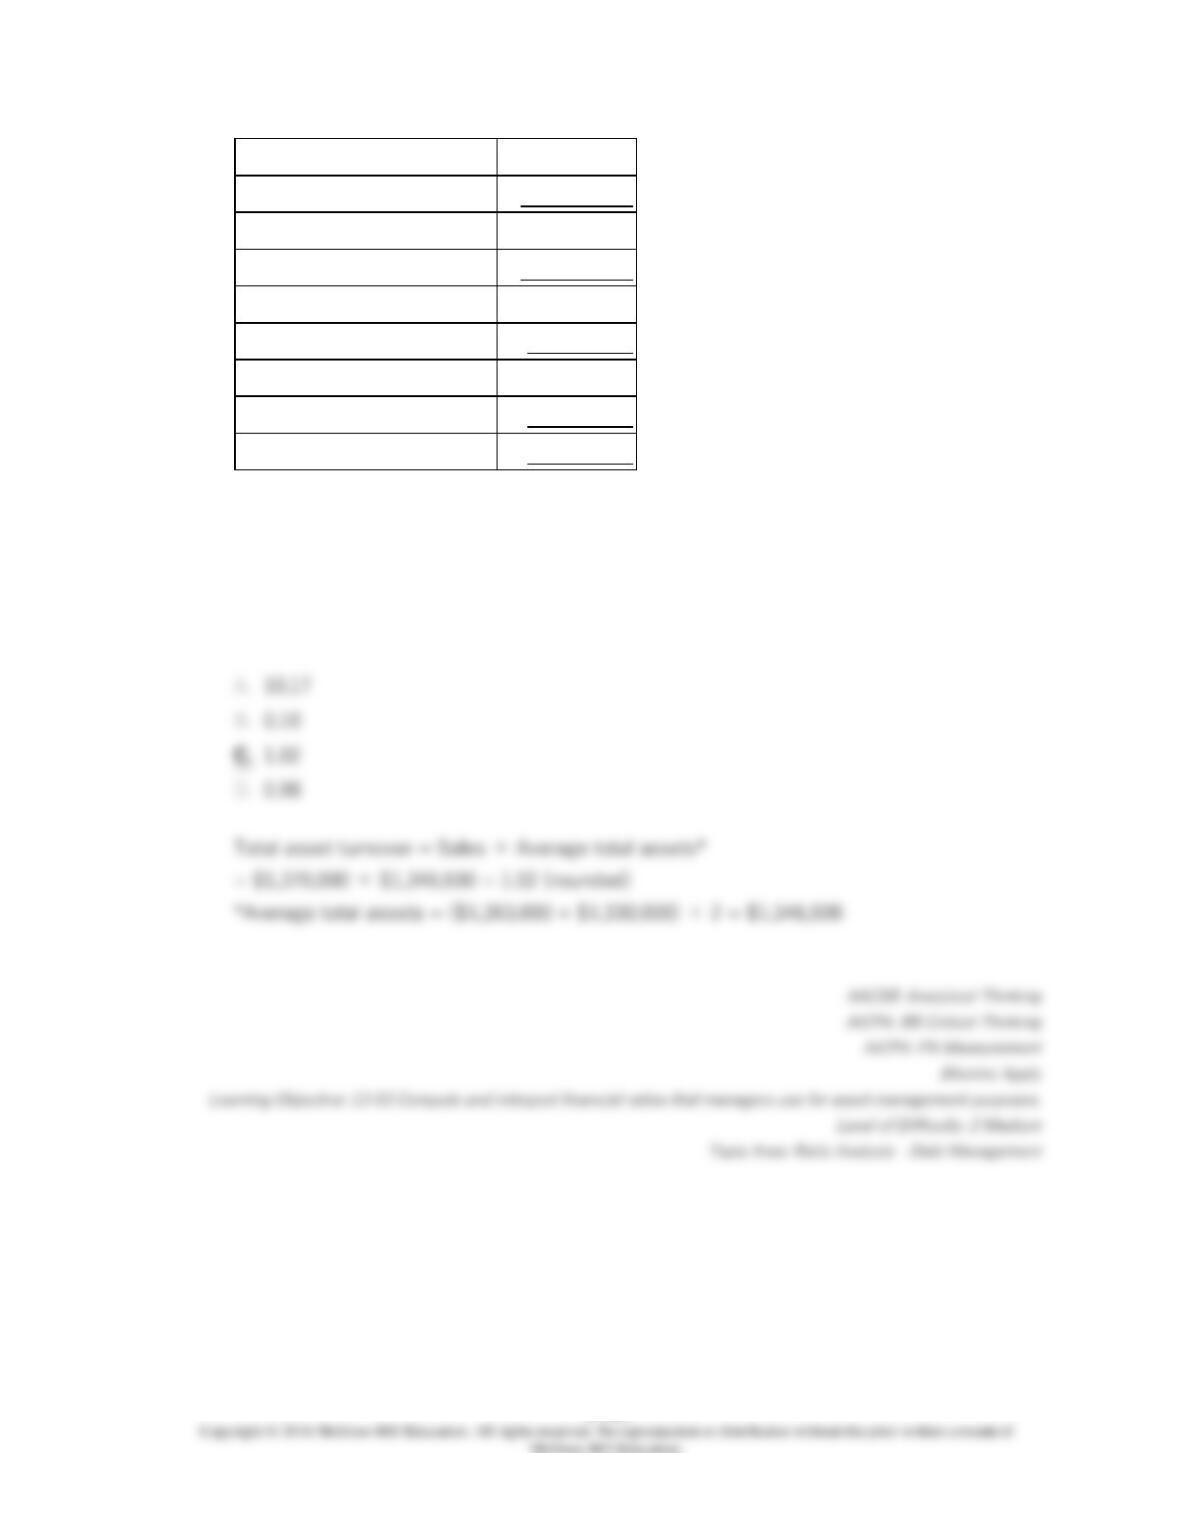
Sales (all on account)
$1,370,000
Cost of goods sold
850,000
Gross margin
520,000
Operating expenses
482,692
Net operating income
37,308
Interest expense
21,000
Net income before taxes
16,308
Income taxes (35%)
5,708
Net income
$10,600
Dividends on common stock during Year 2 totaled $1,600. The market price of common
stock at the end of Year 2 was $2.37 per share.
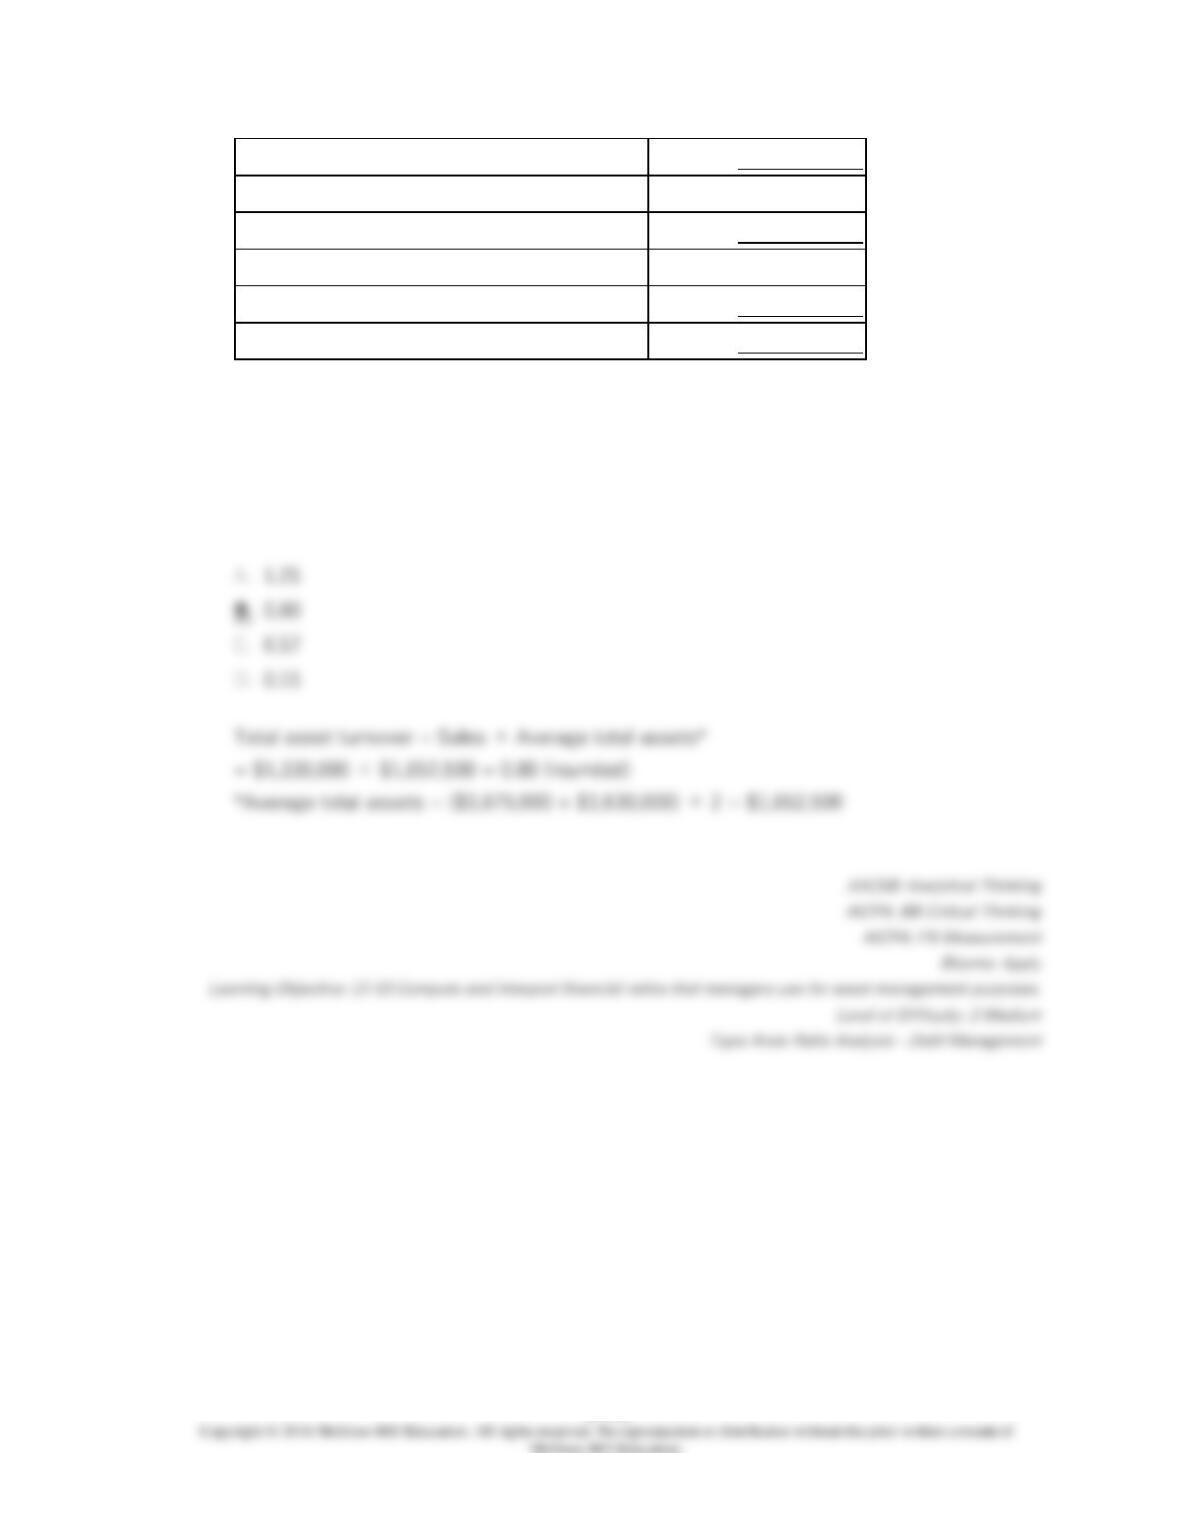
The company’s total asset turnover for Year 2 is closest to:
13–466
181.
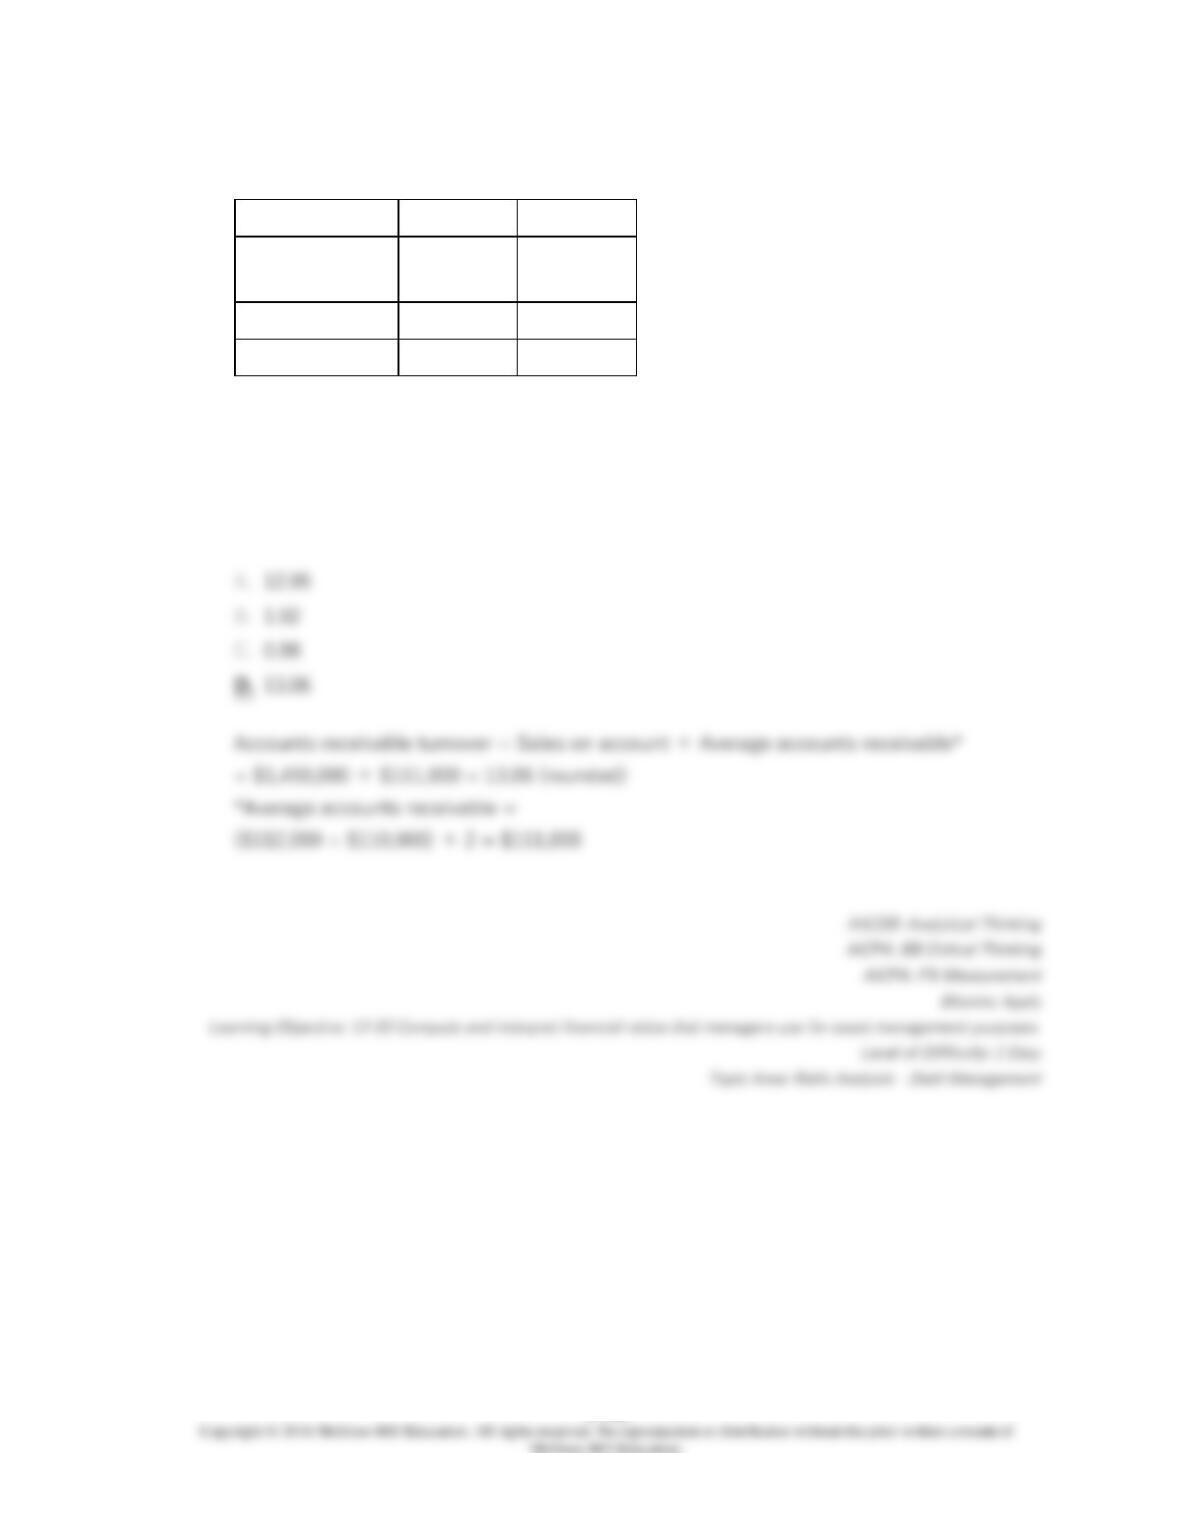
Guttery Corporation has provided the following financial data from its balance sheet:
Year 2
Year 1
Accounts
receivable
$112,000
$110,000
Inventory
$174,000
$150,000
Total assets
$1,236,000
$1,250,000
Sales on account in Year 2 totaled $1,450,000 and cost of goods sold totaled $900,000.
The company’s accounts receivable turnover for Year 2 is closest to:
13–467
182.
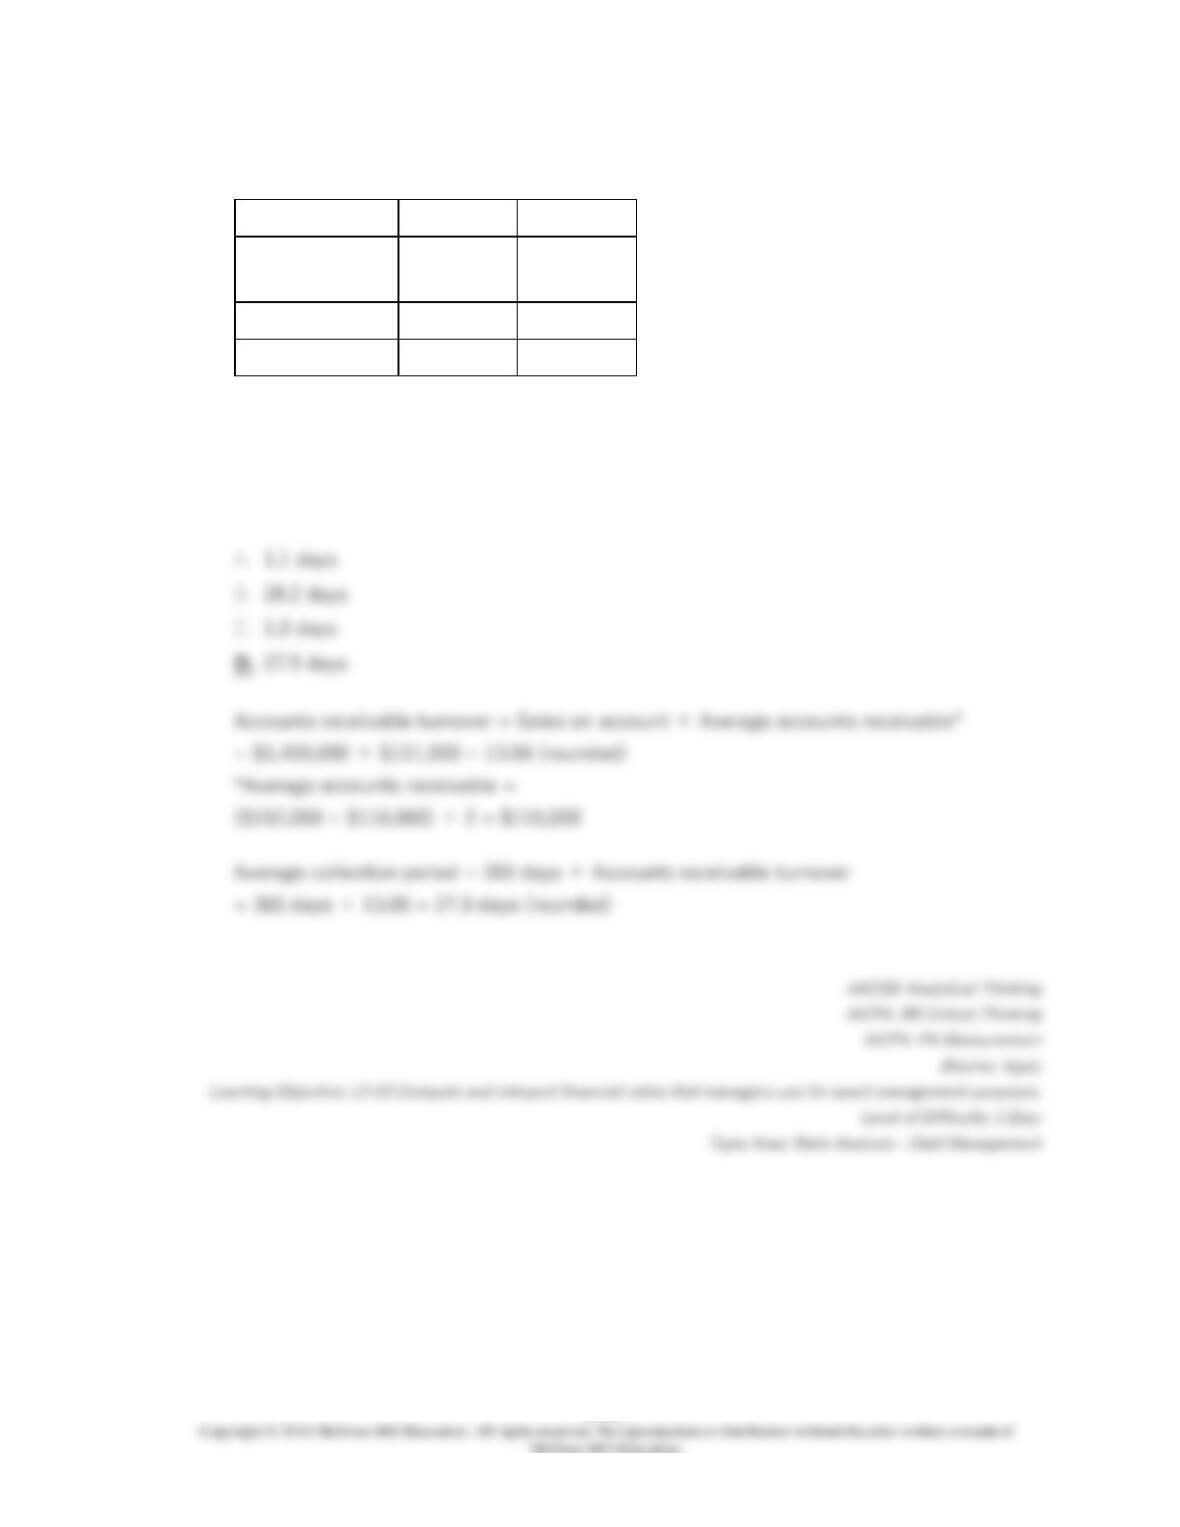
Guttery Corporation has provided the following financial data from its balance sheet:
Year 2
Year 1
Accounts
receivable
$112,000
$110,000
Inventory
$174,000
$150,000
Total assets
$1,236,000
$1,250,000
Sales on account in Year 2 totaled $1,450,000 and cost of goods sold totaled $900,000.
The company’s average collection period (age of receivables) for Year 2 is closest to:
183.
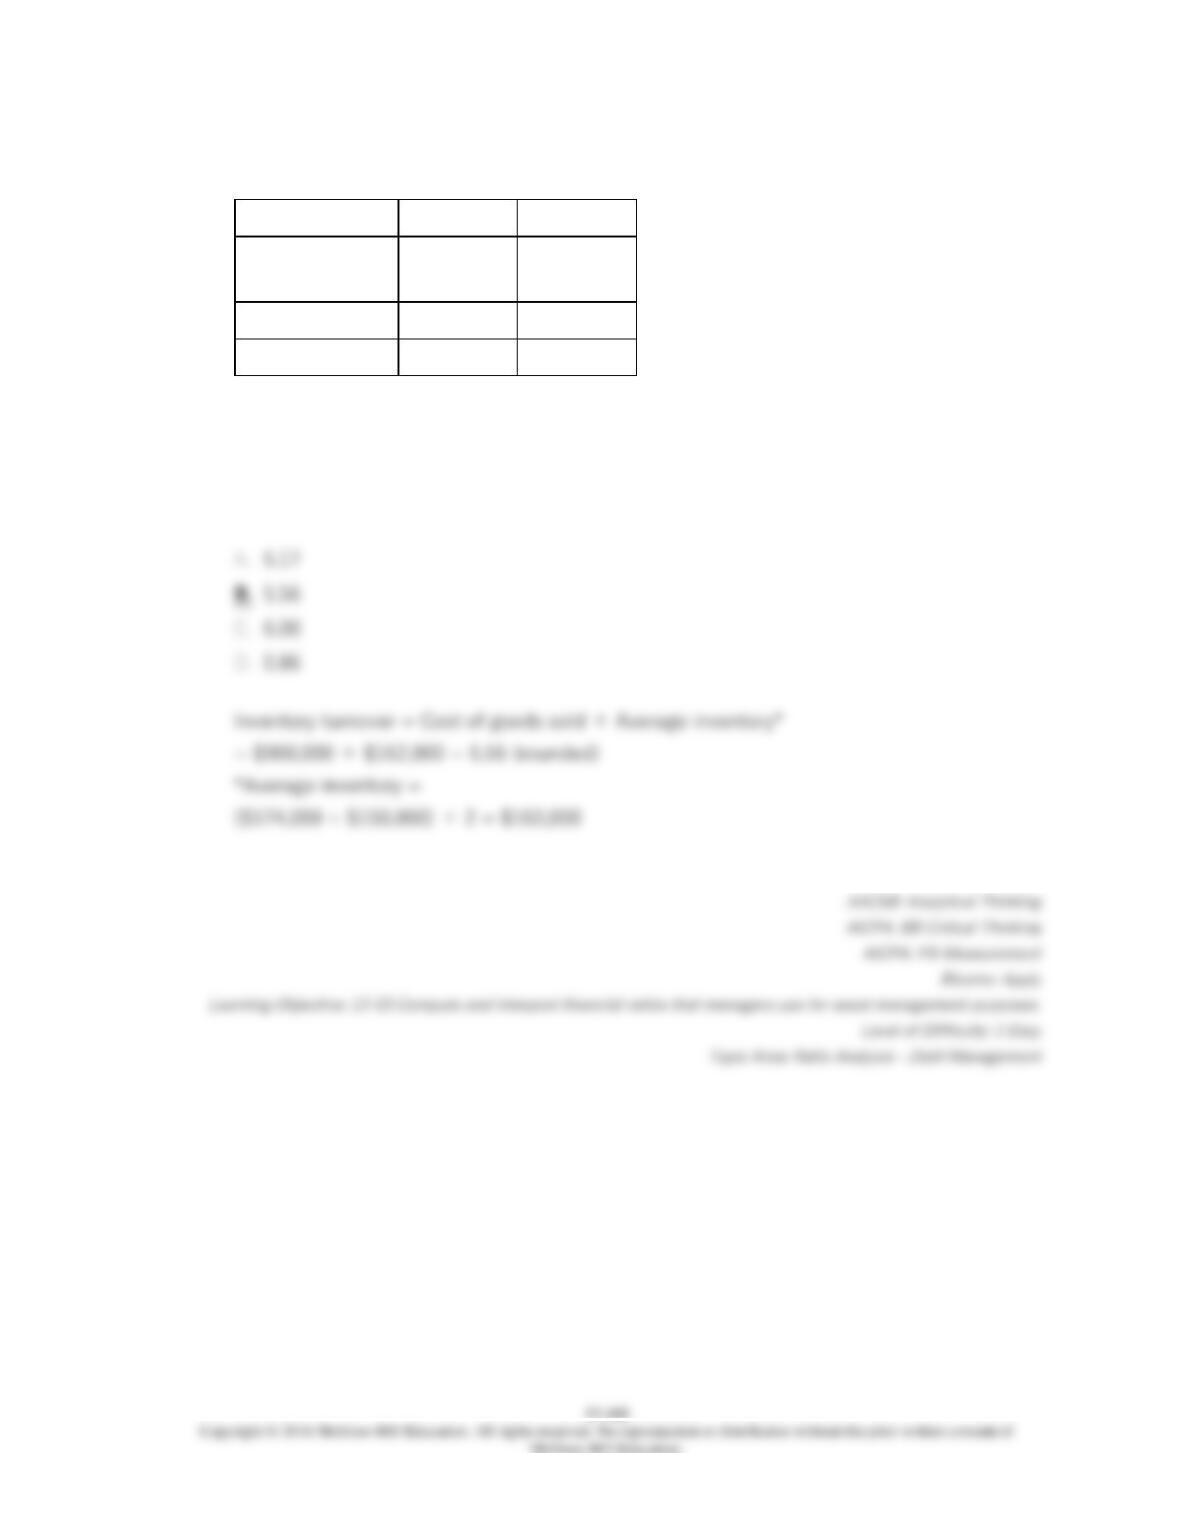
Guttery Corporation has provided the following financial data from its balance sheet:
Year 2
Year 1
Accounts
receivable
$112,000
$110,000
Inventory
$174,000
$150,000
Total assets
$1,236,000
$1,250,000
Sales on account in Year 2 totaled $1,450,000 and cost of goods sold totaled $900,000.
The company’s inventory turnover for Year 2 is closest to:

184.
Guttery Corporation has provided the following financial data from its balance sheet:
Year 2
Year 1
Accounts
receivable
$112,000
$110,000
Inventory
$174,000
$150,000
Total assets
$1,236,000
$1,250,000
Sales on account in Year 2 totaled $1,450,000 and cost of goods sold totaled $900,000.
The company’s average sale period (turnover in days) for Year 2 is closest to:
185.
Guttery Corporation has provided the following financial data from its balance sheet:
Year 2
Year 1
Accounts
receivable
$112,000
$110,000
Inventory
$174,000
$150,000
Total assets
$1,236,000
$1,250,000
Sales on account in Year 2 totaled $1,450,000 and cost of goods sold totaled $900,000.
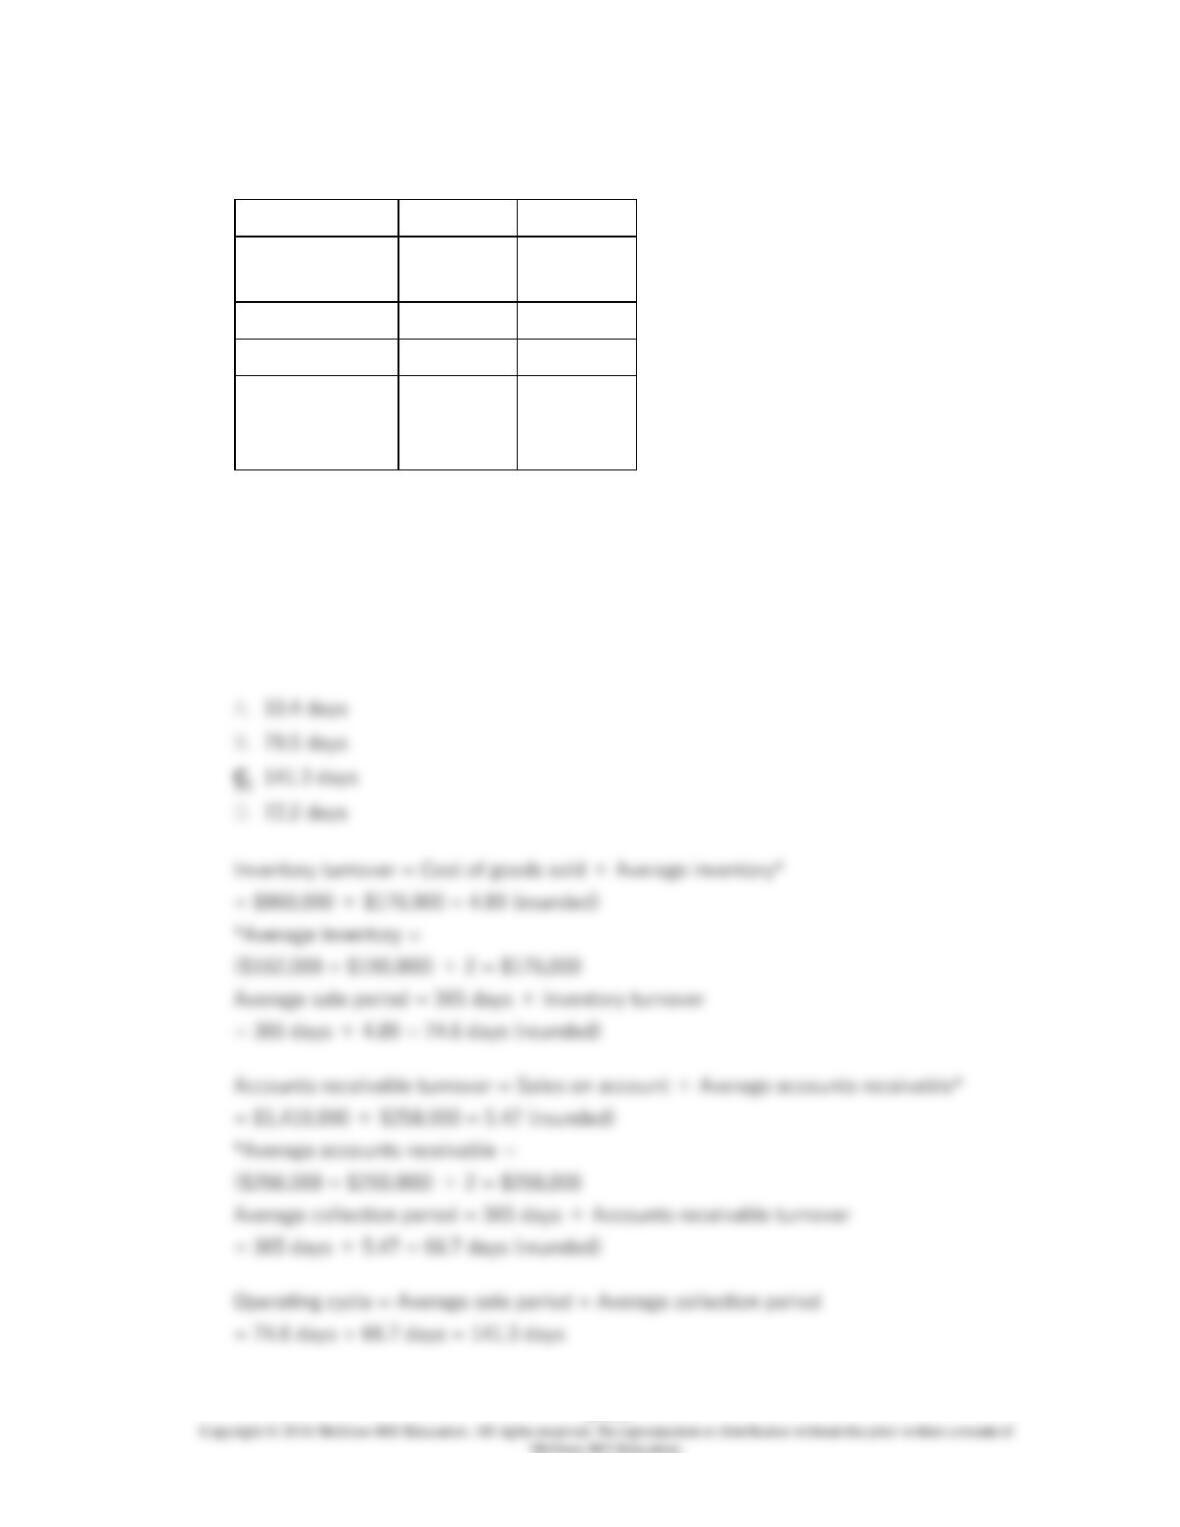
The company’s operating cycle for Year 2 is closest to:

186.
Guttery Corporation has provided the following financial data from its balance sheet:
Year 2
Year 1
Accounts
receivable
$112,000
$110,000
Inventory
$174,000
$150,000
Total assets
$1,236,000
$1,250,000
Sales on account in Year 2 totaled $1,450,000 and cost of goods sold totaled $900,000.
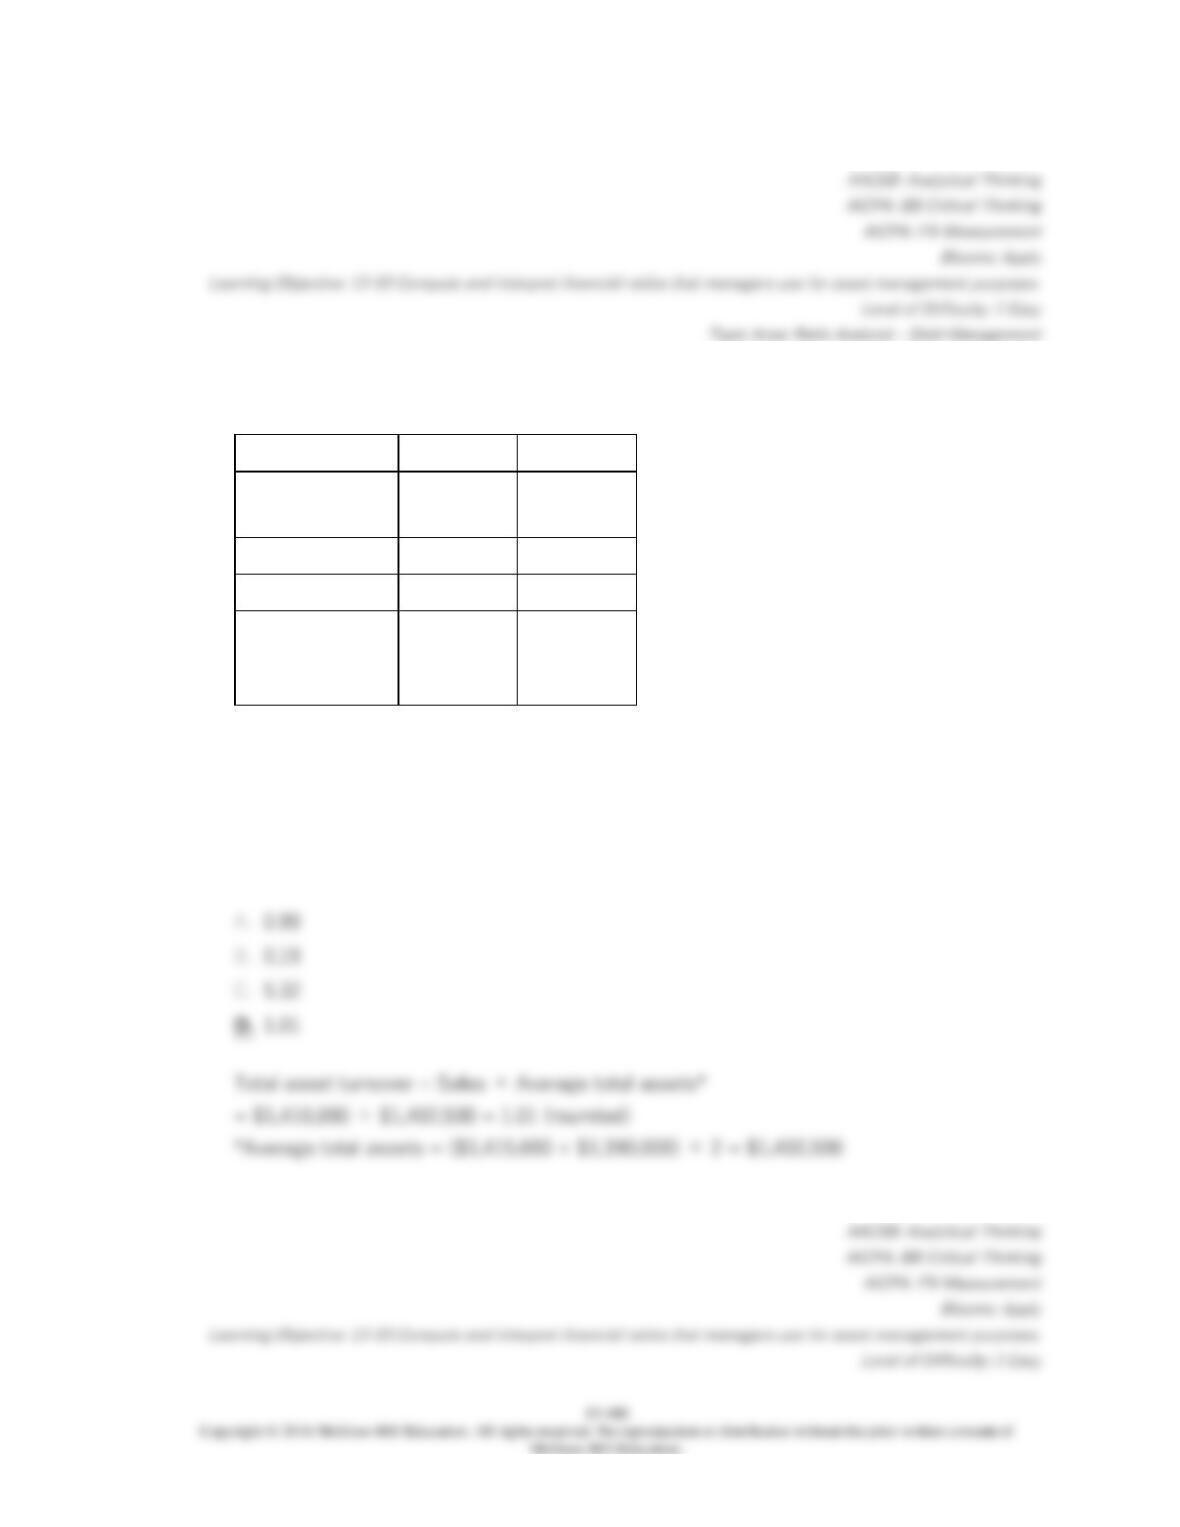
The company’s total asset turnover for Year 2 is closest to:
13–472
187.
Mahoe Corporation has provided the following financial data:
Balance Sheet
December 31, Year 2 and Year 1
Assets
Year 2
Year 1
Current assets:
Cash
$105,000
$190,000
Accounts receivable
255,000
220,000
Inventory
206,000
200,000
Prepaid expenses
44,000
50,000
Total current assets
610,000
660,000
Plant and equipment, net
1,065,000
970,000
Total assets
$1,675,000
$1,630,000
Liabilities and Stockholders’ Equity
Current liabilities:
Accounts payable
$119,000
$110,000
Accrued liabilities
88,000
80,000
Notes payable, short term
53,000
50,000
Total current liabilities
260,000
240,000
Bonds payable
110,000
110,000
Total liabilities
370,000
350,000
Stockholders’ equity:
Common stock, $5 par value
250,000
250,000
Additional paid-in capital-common stock
70,000
70,000
Retained earnings
985,000
960,000
Total stockholders’ equity
1,305,000
1,280,000
Total liabilities & stockholders’ equity
$1,675,000
$1,630,000
Income Statement—Year 2
For the Year Ended December 31, Year 2
Sales (all on account)
$1,330,000
Cost of goods sold
890,000
Gross margin
440,000
Operating expenses
393,571
Net operating income
46,429
Interest expense
10,000
Net income before taxes
36,429
Income taxes (30%)
10,929
Net income
$25,500
Dividends on common stock during Year 2 totaled $500. The market price of common
stock at the end of Year 2 was $8.06 per share.
The company’s operating cycle for Year 2 is closest to:
13–474

13–475
188.
Mahoe Corporation has provided the following financial data:
Balance Sheet
December 31, Year 2 and Year 1
Assets
Year 2
Year 1
Current assets:
Cash
$105,000
$190,000
Accounts receivable
255,000
220,000
Inventory
206,000
200,000
Prepaid expenses
44,000
50,000
Total current assets
610,000
660,000
Plant and equipment, net
1,065,000
970,000
Total assets
$1,675,000
$1,630,000
Liabilities and Stockholders’ Equity
Current liabilities:
Accounts payable
$119,000
$110,000
Accrued liabilities
88,000
80,000
Notes payable, short term
53,000
50,000
Total current liabilities
260,000
240,000
Bonds payable
110,000
110,000
Total liabilities
370,000
350,000
Stockholders’ equity:
Common stock, $5 par value
250,000
250,000
Additional paid-in capital-common stock
70,000
70,000
Retained earnings
985,000
960,000
Total stockholders’ equity
1,305,000
1,280,000
Total liabilities & stockholders’ equity
$1,675,000
$1,630,000
Income Statement—Year 2
For the Year Ended December 31, Year 2
Sales (all on account)
$1,330,000
Cost of goods sold
890,000
Gross margin
440,000
13–476
Operating expenses
393,571
Net operating income
46,429
Interest expense
10,000
Net income before taxes
36,429
Income taxes (30%)
10,929
Net income
$25,500
Dividends on common stock during Year 2 totaled $500. The market price of common
stock at the end of Year 2 was $8.06 per share.
The company’s total asset turnover for Year 2 is closest to:

13–477
189.
Mahoe Corporation has provided the following financial data:
Balance Sheet
December 31, Year 2 and Year 1
Assets
Year 2
Year 1
Current assets:
Cash
$105,000
$190,000
Accounts receivable
255,000
220,000
Inventory
206,000
200,000
Prepaid expenses
44,000
50,000
Total current assets
610,000
660,000
Plant and equipment, net
1,065,000
970,000
Total assets
$1,675,000
$1,630,000
Liabilities and Stockholders’ Equity
Current liabilities:
Accounts payable
$119,000
$110,000
Accrued liabilities
88,000
80,000
Notes payable, short term
53,000
50,000
Total current liabilities
260,000
240,000
Bonds payable
110,000
110,000
Total liabilities
370,000
350,000
Stockholders’ equity:
Common stock, $5 par value
250,000
250,000
Additional paid-in capital-common stock
70,000
70,000
Retained earnings
985,000
960,000
Total stockholders’ equity
1,305,000
1,280,000
Total liabilities & stockholders’ equity
$1,675,000
$1,630,000
Income Statement—Year 2
For the Year Ended December 31, Year 2
Sales (all on account)
$1,330,000
Cost of goods sold
890,000
Gross margin
440,000
Operating expenses
393,571
Net operating income
46,429
Interest expense
10,000
Net income before taxes
36,429
Income taxes (30%)
10,929
Net income
$25,500
Dividends on common stock during Year 2 totaled $500. The market price of common
stock at the end of Year 2 was $8.06 per share.
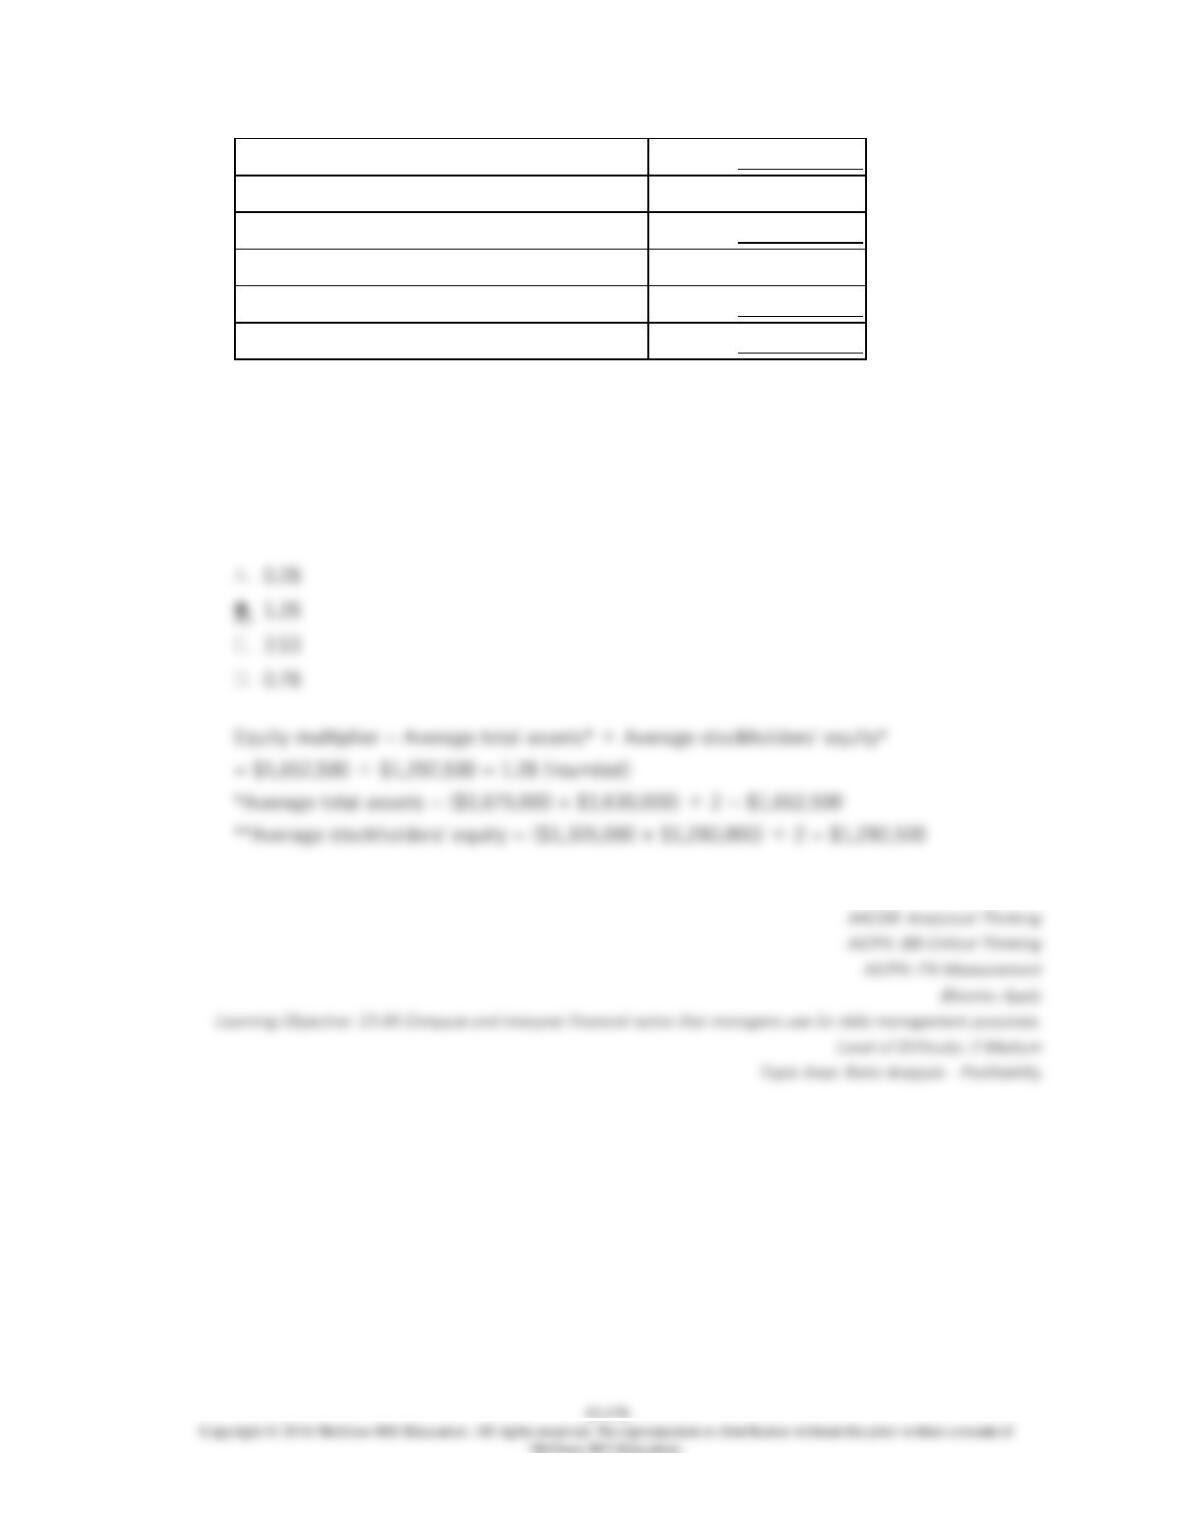
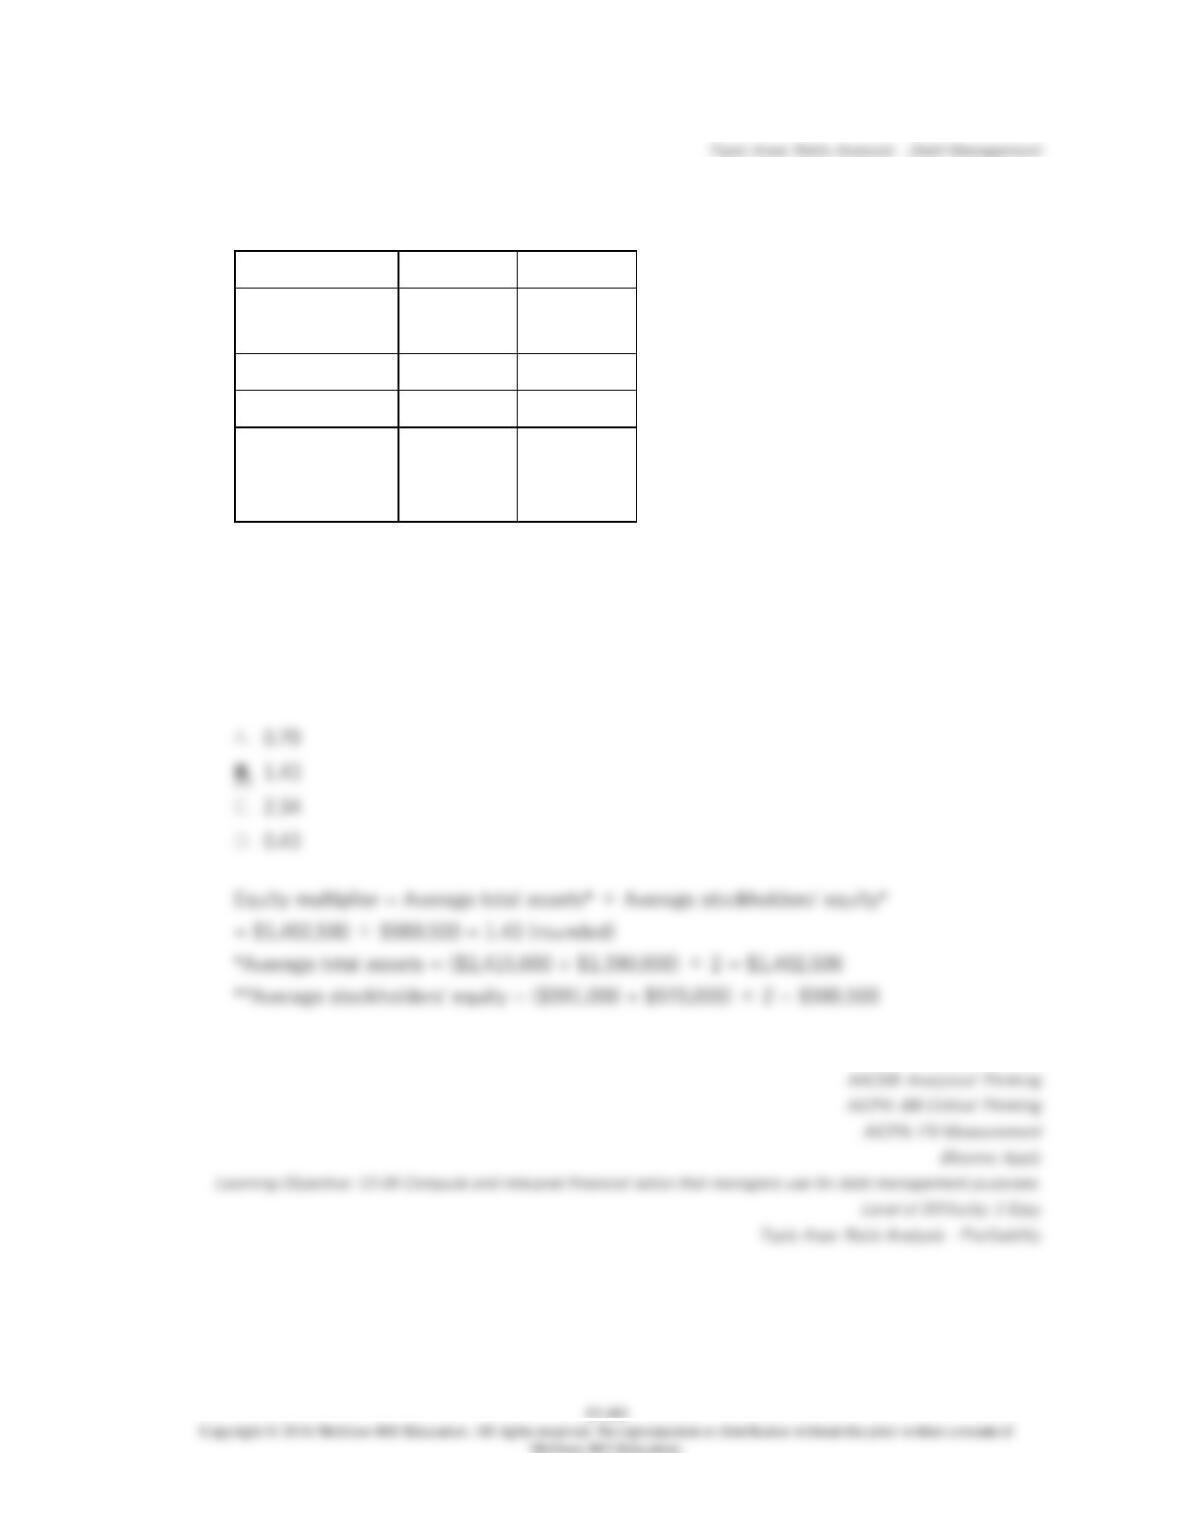
The company’s equity multiplier at the end of Year 2 is closest to:
13–479
190.
Burdick Corporation has provided the following financial data from its balance sheet:
Year 2
Year 1
Accounts
receivable
$266,000
$250,000
Inventory
$162,000
$190,000
Total assets
$1,415,000
$1,390,000
Total
stockholders’
equity
$991,000
$970,000
Sales (all on account) in Year 2 amounted to $1,410,000 and the cost of goods sold was
$860,000.
The company’s operating cycle for Year 2 is closest to:
191.
Burdick Corporation has provided the following financial data from its balance sheet:
Year 2
Year 1
Accounts
receivable
$266,000
$250,000
Inventory
$162,000
$190,000
Total assets
$1,415,000
$1,390,000
Total
stockholders’
equity
$991,000
$970,000
Sales (all on account) in Year 2 amounted to $1,410,000 and the cost of goods sold was
$860,000.
The company’s total asset turnover for Year 2 is closest to:
192.
Burdick Corporation has provided the following financial data from its balance sheet:
Year 2
Year 1
Accounts
receivable
$266,000
$250,000
Inventory
$162,000
$190,000
Total assets
$1,415,000
$1,390,000
Total
stockholders’
equity
$991,000
$970,000
Sales (all on account) in Year 2 amounted to $1,410,000 and the cost of goods sold was
$860,000.
The company’s equity multiplier at the end of Year 2 is closest to:
13–482
193.
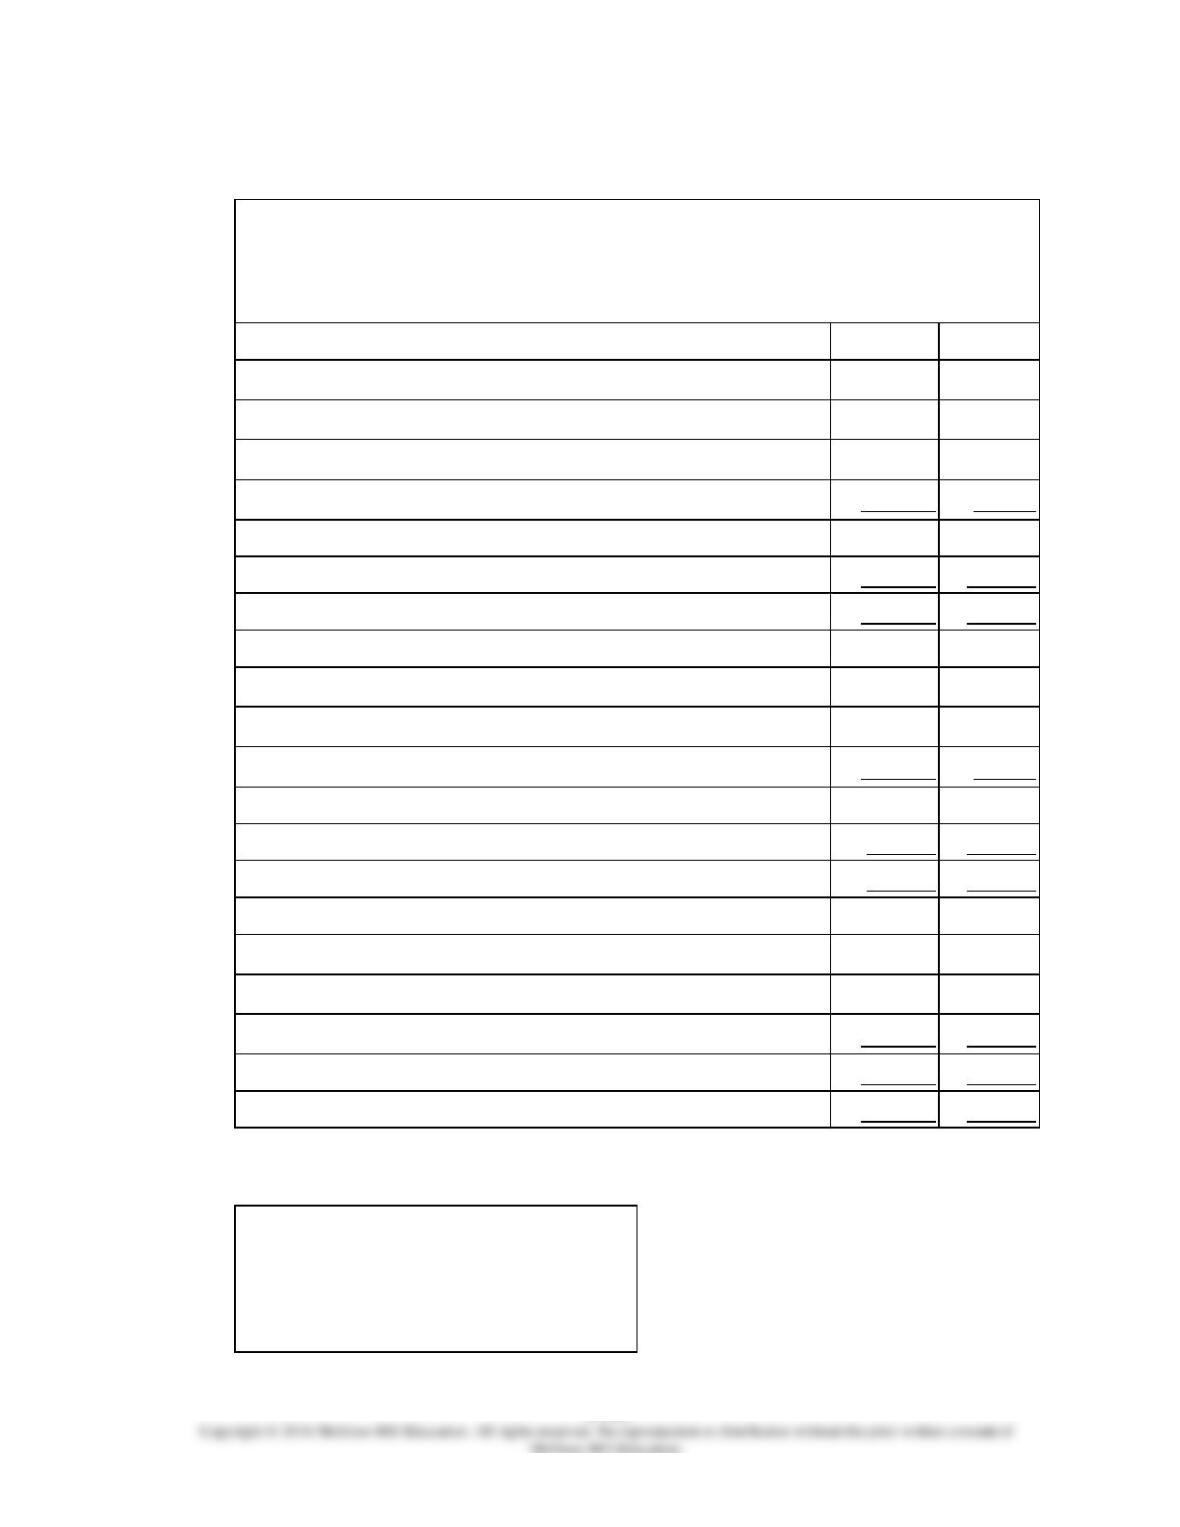
Financial statements for Narstad Corporation appear below:
Narstad Corporation
Balance Sheet
December 31, Year 2 and Year 1
(dollars in thousands)
Current assets:
Cash and marketable securities
$100
$100
Accounts receivable, net
220
190
Inventory
190
180
Prepaid expenses
10
20
Total current assets
520
490
Plant & equipment, net
1,940
1,940
Total assets
$2,460
$2,430
Current liabilities:
Accounts payable
$150
$150
Accrued liabilities
90
70
Notes payable, short term
100
150
Total current liabilities
340
370
Bonds payable
310
300
Total liabilities
650
670
Stockholders’ equity:
Common stock, $2 par
180
180
Additional paid-in capital-common stock
330
330
Retained earnings
1,300
1,250
Total stockholders’ equity
1,810
1,760
Total liabilities & stockholders’ equity
$2,460
$2,430
Narstad Corporation
Income Statement
For the Year Ended December 31,
Year 2
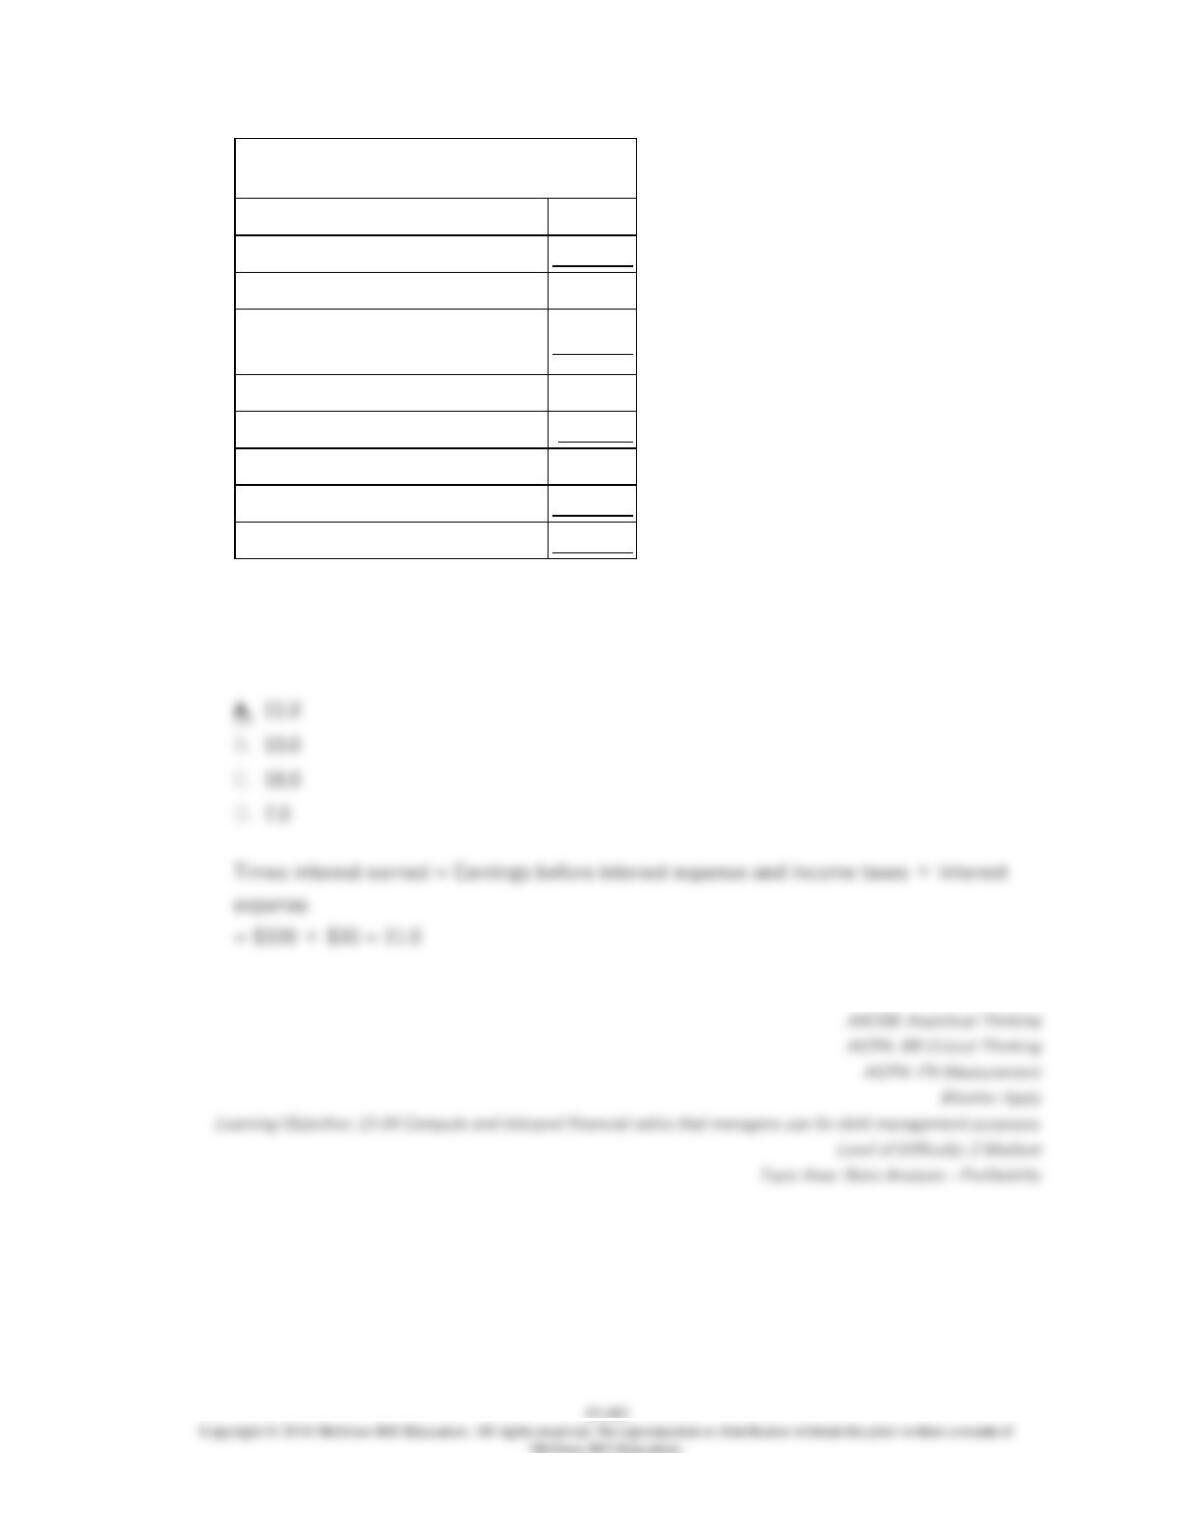
(dollars in thousands)
Sales (all on account)
$1,770
Cost of goods sold
1,230
Gross margin
540
Selling and administrative
expense
210
Net operating income
330
Interest expense
30
Net income before taxes
300
Income taxes (30%)
90
Net income
$210
Narstad Corporation’s times interest earned for Year 2 was closest to:
13–484
194.
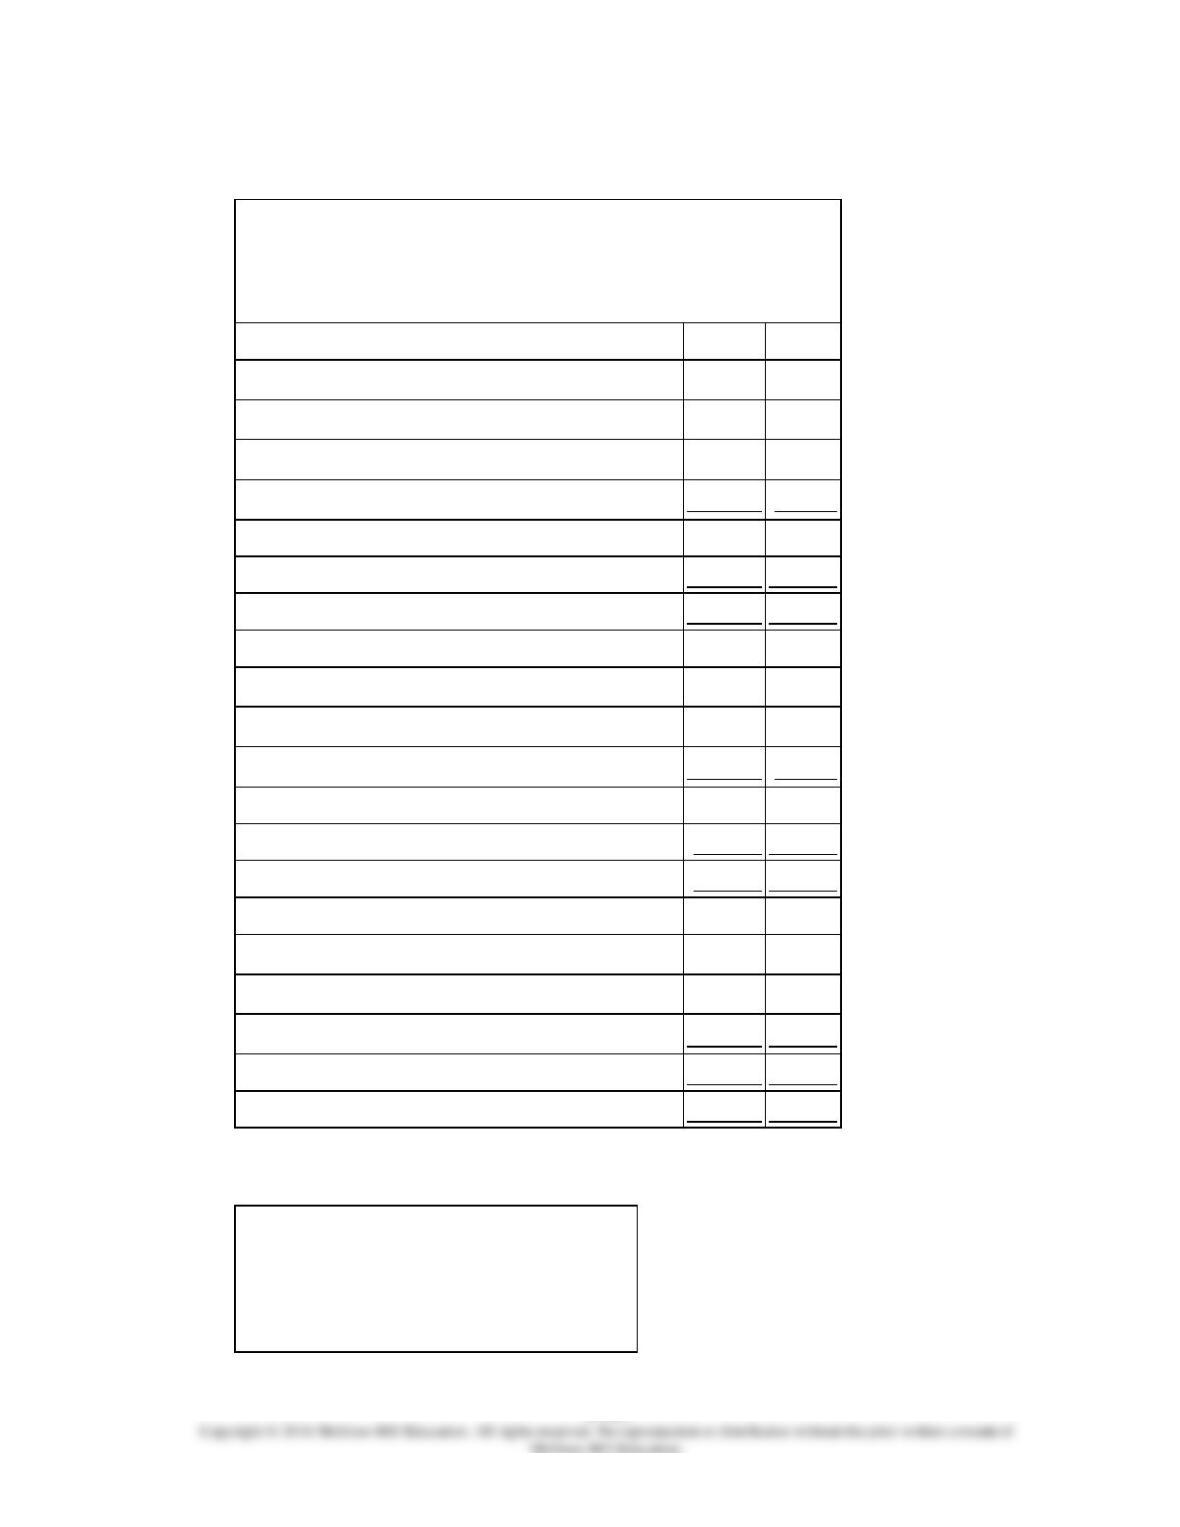
Financial statements for Narstad Corporation appear below:
Narstad Corporation
Balance Sheet
December 31, Year 2 and Year 1
(dollars in thousands)
Current assets:
Cash and marketable securities
$100
$100
Accounts receivable, net
220
190
Inventory
190
180
Prepaid expenses
10
20
Total current assets
520
490
Plant & equipment, net
1,940
1,940
Total assets
$2,460
$2,430
Current liabilities:
Accounts payable
$150
$150
Accrued liabilities
90
70
Notes payable, short term
100
150
Total current liabilities
340
370
Bonds payable
310
300
Total liabilities
650
670
Stockholders’ equity:
Common stock, $2 par
180
180
Additional paid-in capital-common stock
330
330
Retained earnings
1,300
1,250
Total stockholders’ equity
1,810
1,760
Total liabilities & stockholders’ equity
$2,460
$2,430
Narstad Corporation
Income Statement
For the Year Ended December 31,
Year 2