12–79
51. Maloney Corporation’s balance sheet and income statement appear below:
Comparative Balance Sheet
Ending Balance Beginning
Balance
Assets:
Cash and cash equivalents $26 $22
Accounts receivable 44 49
Inventory 38 40
Property, plant and equipment 646 500
Less accumulated depreciation 273
260
Total assets $481 $351
Liabilities and stockholders’ equity:
Accounts payable $65 $64
Accrued liabilities 22 25
Income taxes payable 33 35
Bonds payable 72 70
Common stock 73 70
Retained earnings 216
87
Total liabilities and stockholders’ equity $481
$351
Income Statement
Sales $1,059
Cost of goods sold 698
Gross margin 361
Selling and administrative expense 117
Net operating income 244
Income taxes 73
Net income $171
12–80
Cash dividends were $42. The company did not dispose of any property, plant, and equipment
during the year.
Required:
Prepare the operating activities section of the statement of cash flows using the direct method.
12–82
52. Carson Corporation’s comparative balance sheet and income statement for last year
appear below:
Comparative Balance Sheet
Ending Balance Beginning Balance
Cash $20,000 $15,000
Accounts receivable 27,000 25,000
Inventory 32,000 35,000
Prepaid expenses 8,000 5,000
Long-term investments 36,000 38,000
Property, plant and equipment 108,000 92,000
Less accumulated depreciation 49,000 30,000
Total assets $182,000 $180,000
Accounts payable $30,000 $38,000
Income taxes payable 17,000 35,000
Bonds payable 40,000 32,000
Common stock 45,000 40,000
Retained earnings 50,000 35,000
Total liabilities and stockholders’ equity $182,000 $180,000
Income Statement
Sales $200,000
Cost of goods sold 100,000
Gross margin 100,000
Selling and administrative expense 52,000
Net operating income 48,000
Gain on sale of investments 2,000
Income before taxes 50,000
Income taxes 20,000
Net income $30,000
12–83
Carson did not dispose of any property, plant, and equipment during the year. It constructs its
statement of cash flows using the direct method.
Required:
Using the direct method, prepare in good form the operating activities section of the statement
of cash flows.

12–85
53. The changes in each balance sheet account for Carver Corporation during the year just
completed are as follows:
Increase Decrease
Cash $3,000
Accounts receivable $5,000
Inventory $6,000
Prepaid expenses $3,000
Long-term investments $17,000
Property, plant and equipment $11,000
Accumulated depreciation $9,000
Accounts payable $8,000
Accrued liabilities $5,000
Bonds payable $12,000
Common stock $3,000
Retained earnings $2,000
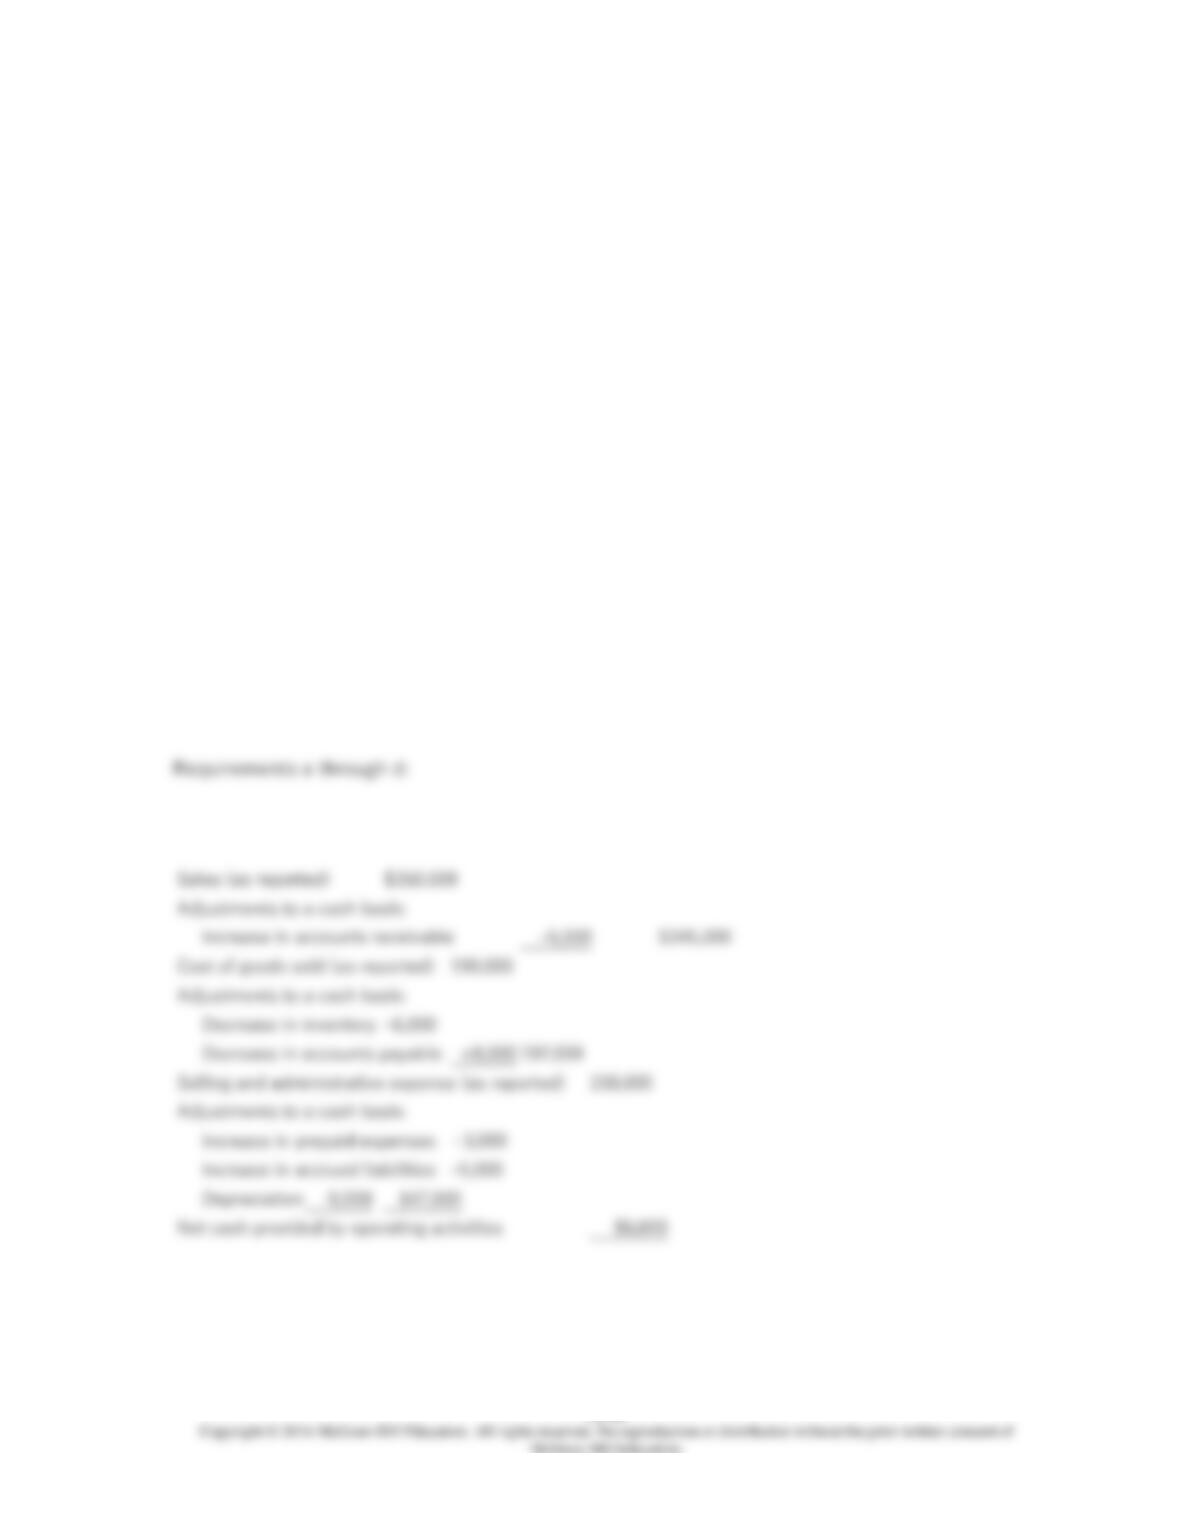
Carver Corporation’s income statement for the year just ended shows the following:
Sales $350,000
Cost of goods sold 190,000
Gross margin 160,000
Selling and administrative expense 158,000
Net income $2,000
12–86
The company did not dispose of any property, plant, and equipment, buy any long-term
investments, issue any bonds payable, or repurchase any of its own common stock during the
year. Carver Corporation uses the direct method to construct its statement of cash flows.
Required:
a. Determine the sales adjusted to the cash basis.
b. Determine the cost of goods sold adjusted to the cash basis.
c. Determine the selling and administrative expenses adjusted to a cash basis.
d. Determine the net cash provided (used) by operating activities.
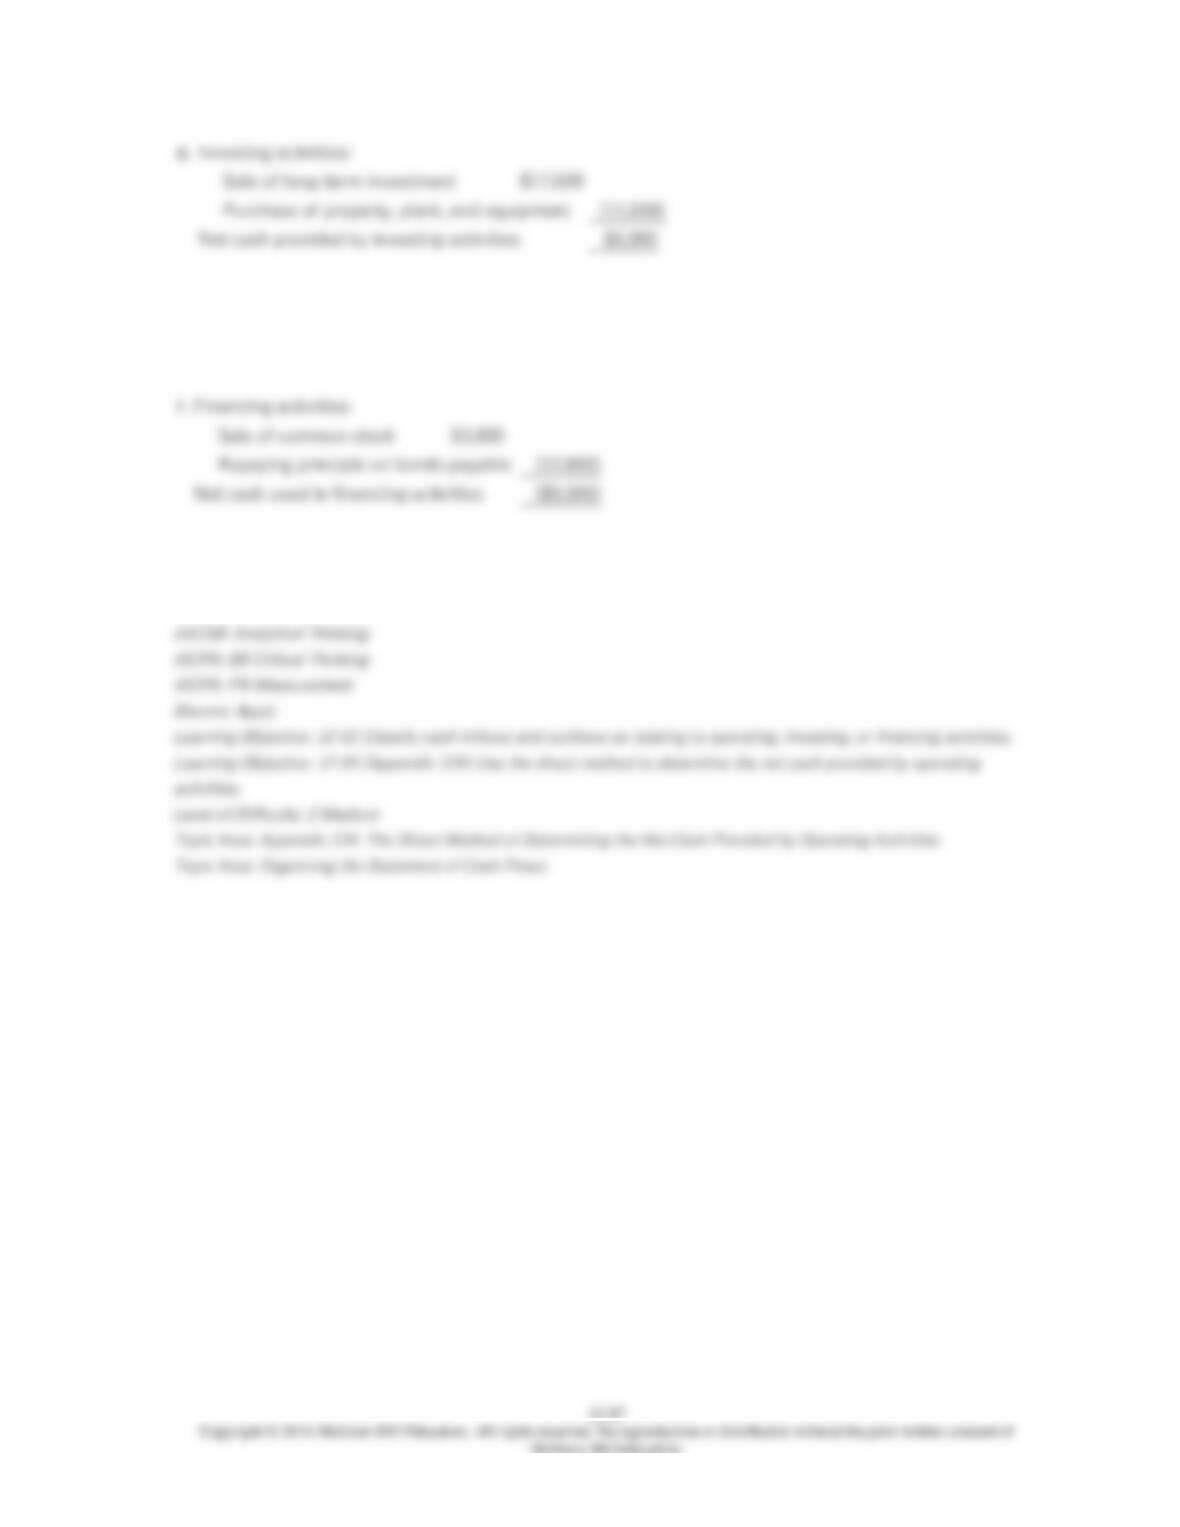
e. Determine the net cash provided (used) by investing activities.
f. Determine the net cash provided (used) by financing activities.

12–88
54. Carr Corporation’s comparative balance sheet and income statement for last year appear
below:
Comparative Balance Sheet
Ending Balance Beginning Balance
Cash $3,000 $23,000
Accounts receivable 83,000 71,000
Inventory 39,000 47,000
Prepaid expenses 9,000 15,000
Long-term investments 240,000 200,000
Property, plant and equipment 515,000 480,000
Less accumulated depreciation 320,000 295,000
Total assets $569,000 $541,000
Accounts payable $9,000 $25,000
Accrued liabilities 24,000 17,000
Income taxes payable 49,000 46,000
Bonds payable 160,000 200,000
Common stock 170,000 140,000
Retained earnings 157,000 113,000
Total liabilities and stockholders’ equity $569,000 $541,000
Income Statement
Sales $850,000
Cost of goods sold 450,000
Gross margin 400,000
Selling and administrative expense 270,000
Net operating income 130,000
Income taxes 39,000
Net income $91,000
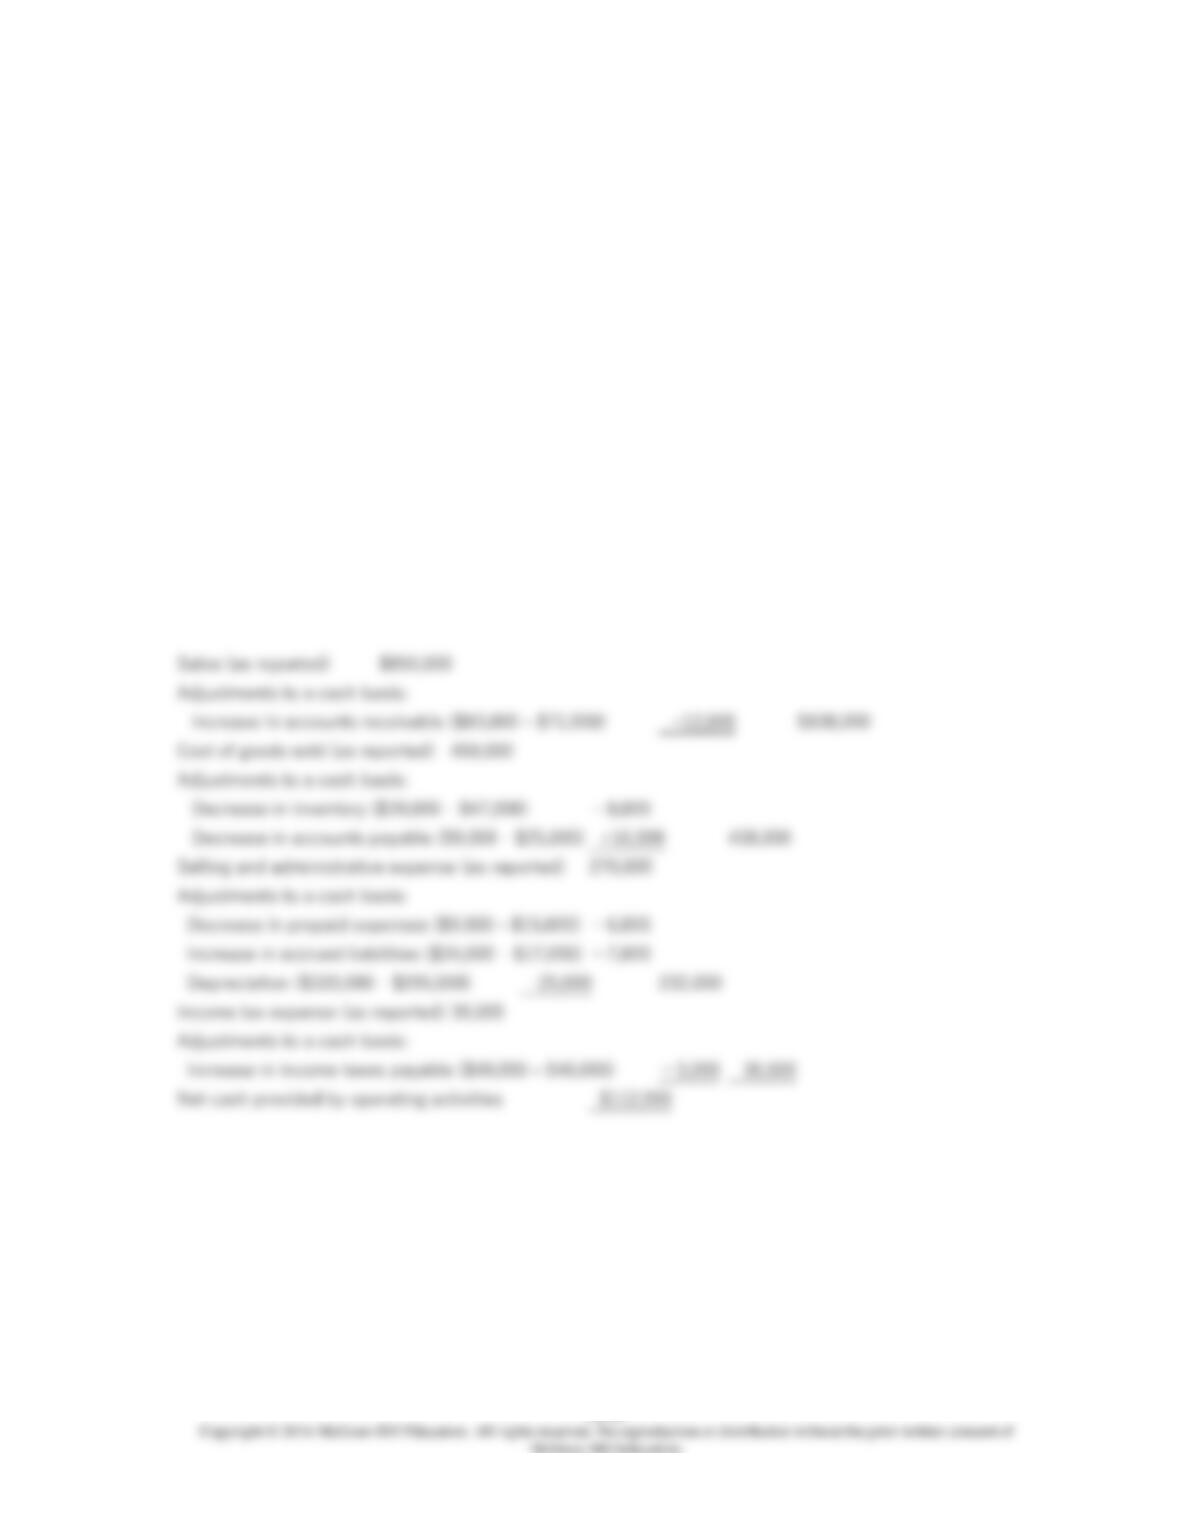
12–89
The company declared and paid $47,000 in cash dividends during the year. It did not dispose of
any property, plant, and equipment during the year.
Required:
Construct in good form the operating activities section of the company’s statement of cash flows
for the year using the direct method.


12–91
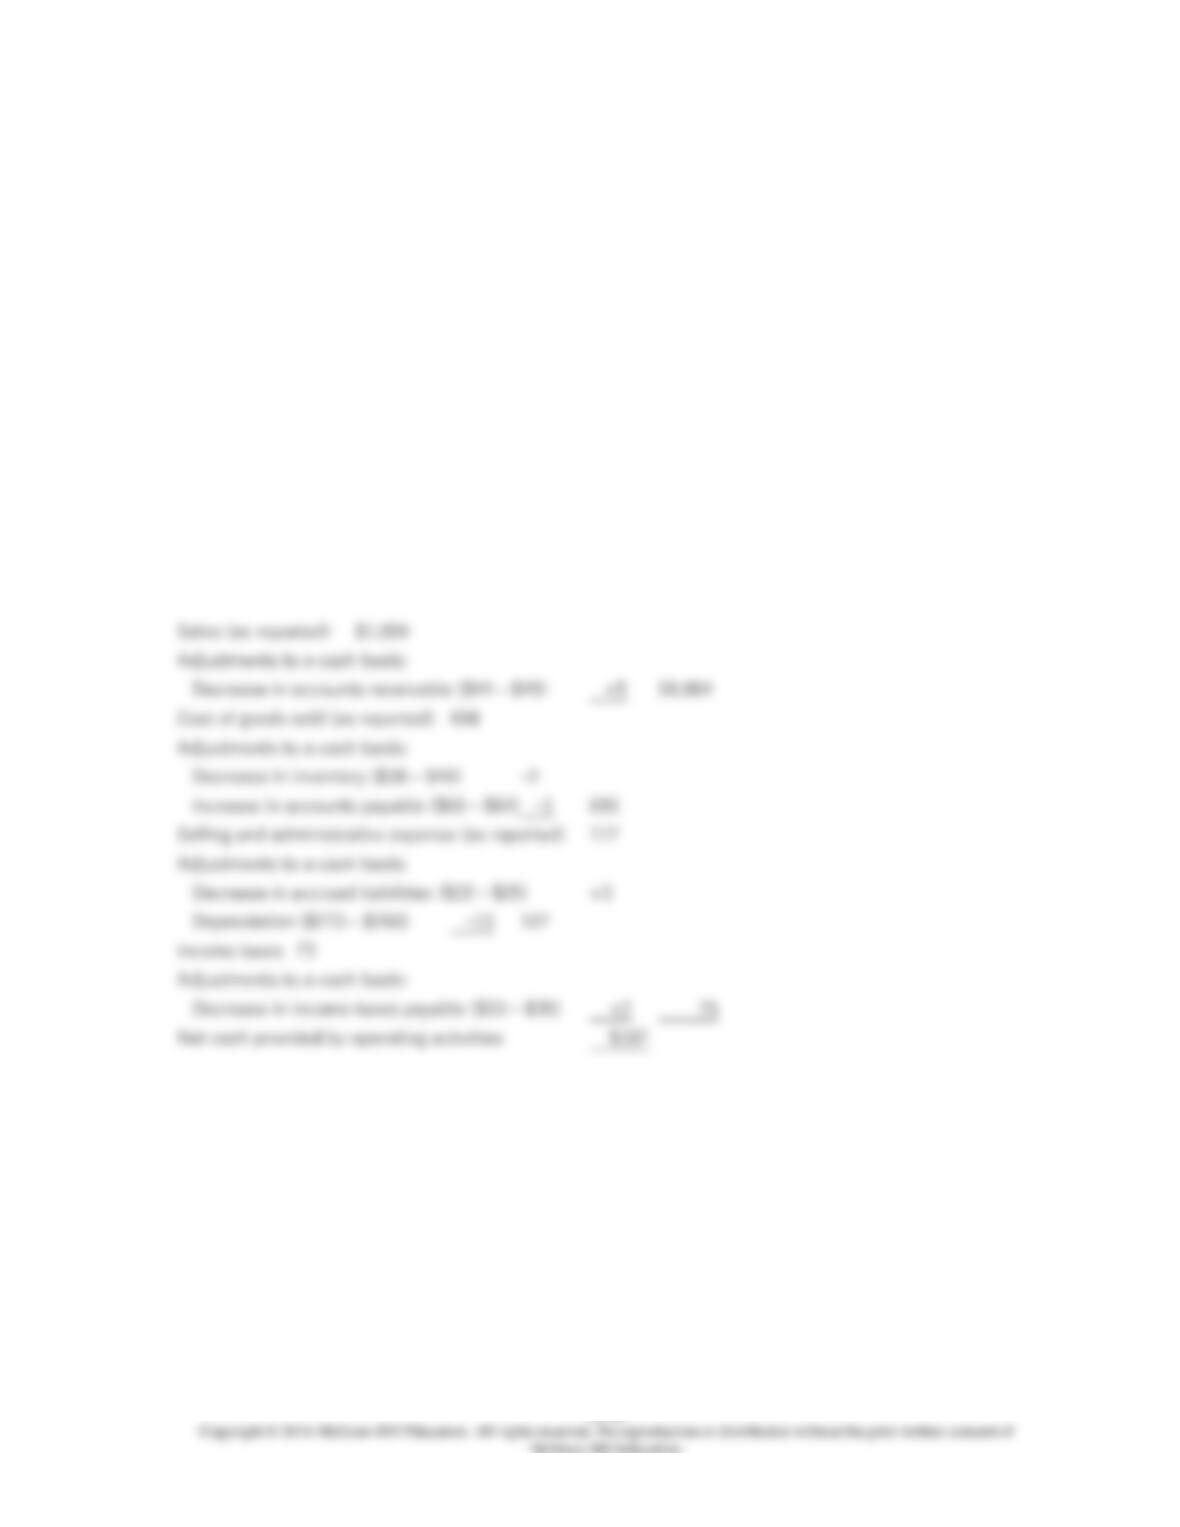
55. Digby Corporation’s balance sheet and income statement appear below:
Comparative Balance Sheet
Ending Balance Beginning
Balance
Assets:
Cash and cash equivalents $34 $28
Accounts receivable 76 65
Inventory 34 38
Property, plant and equipment 607 490
Less accumulated depreciation 350
328
Total assets $401 $293
Liabilities and stockholders’ equity:
Accounts payable $30 $36
Bonds payable 265 290
Common stock 43 40
Retained earnings 63 (73)
Total liabilities and stockholders’ equity $401
$293
Income Statement
Sales $1,075
Cost of goods sold 654
Gross margin 421
Selling and administrative expense 185
Net operating income 236
Income taxes 71
Net income $165
Cash dividends were $29. The company did not dispose of any property, plant, and equipment
during the year.
Required:
Prepare the operating activities section of the statement of cash flows in good form using the
direct method.

12–93
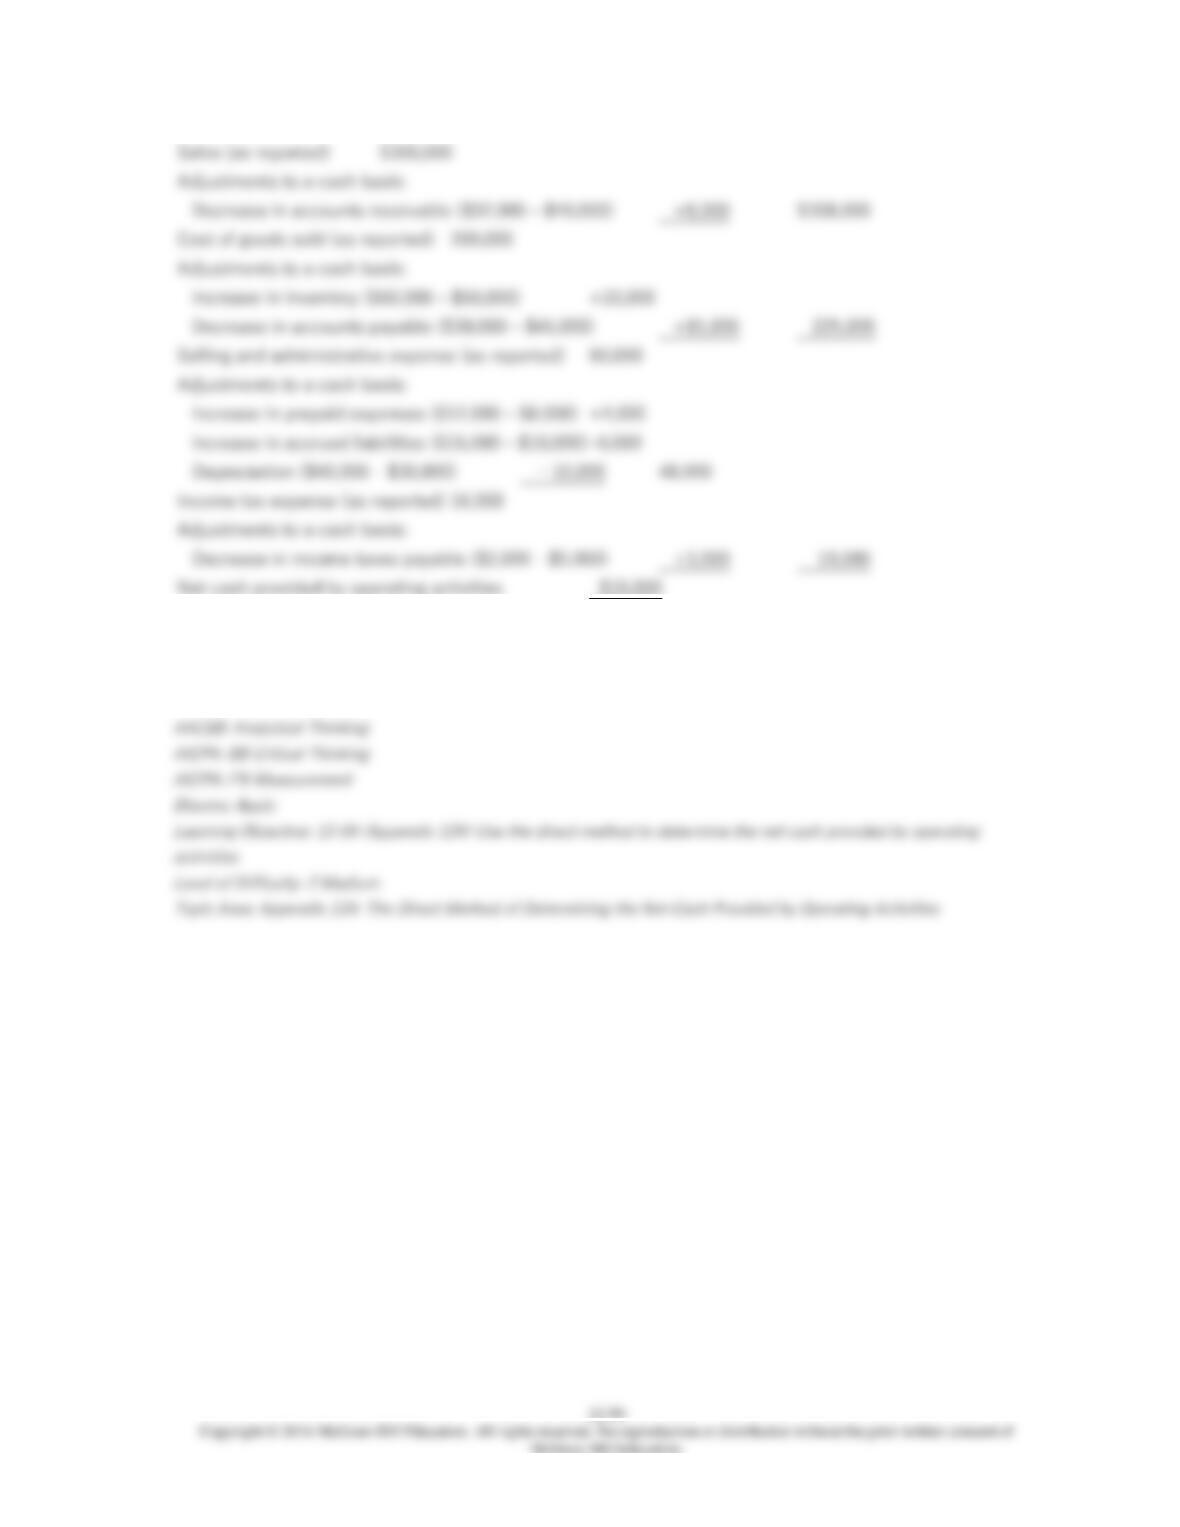
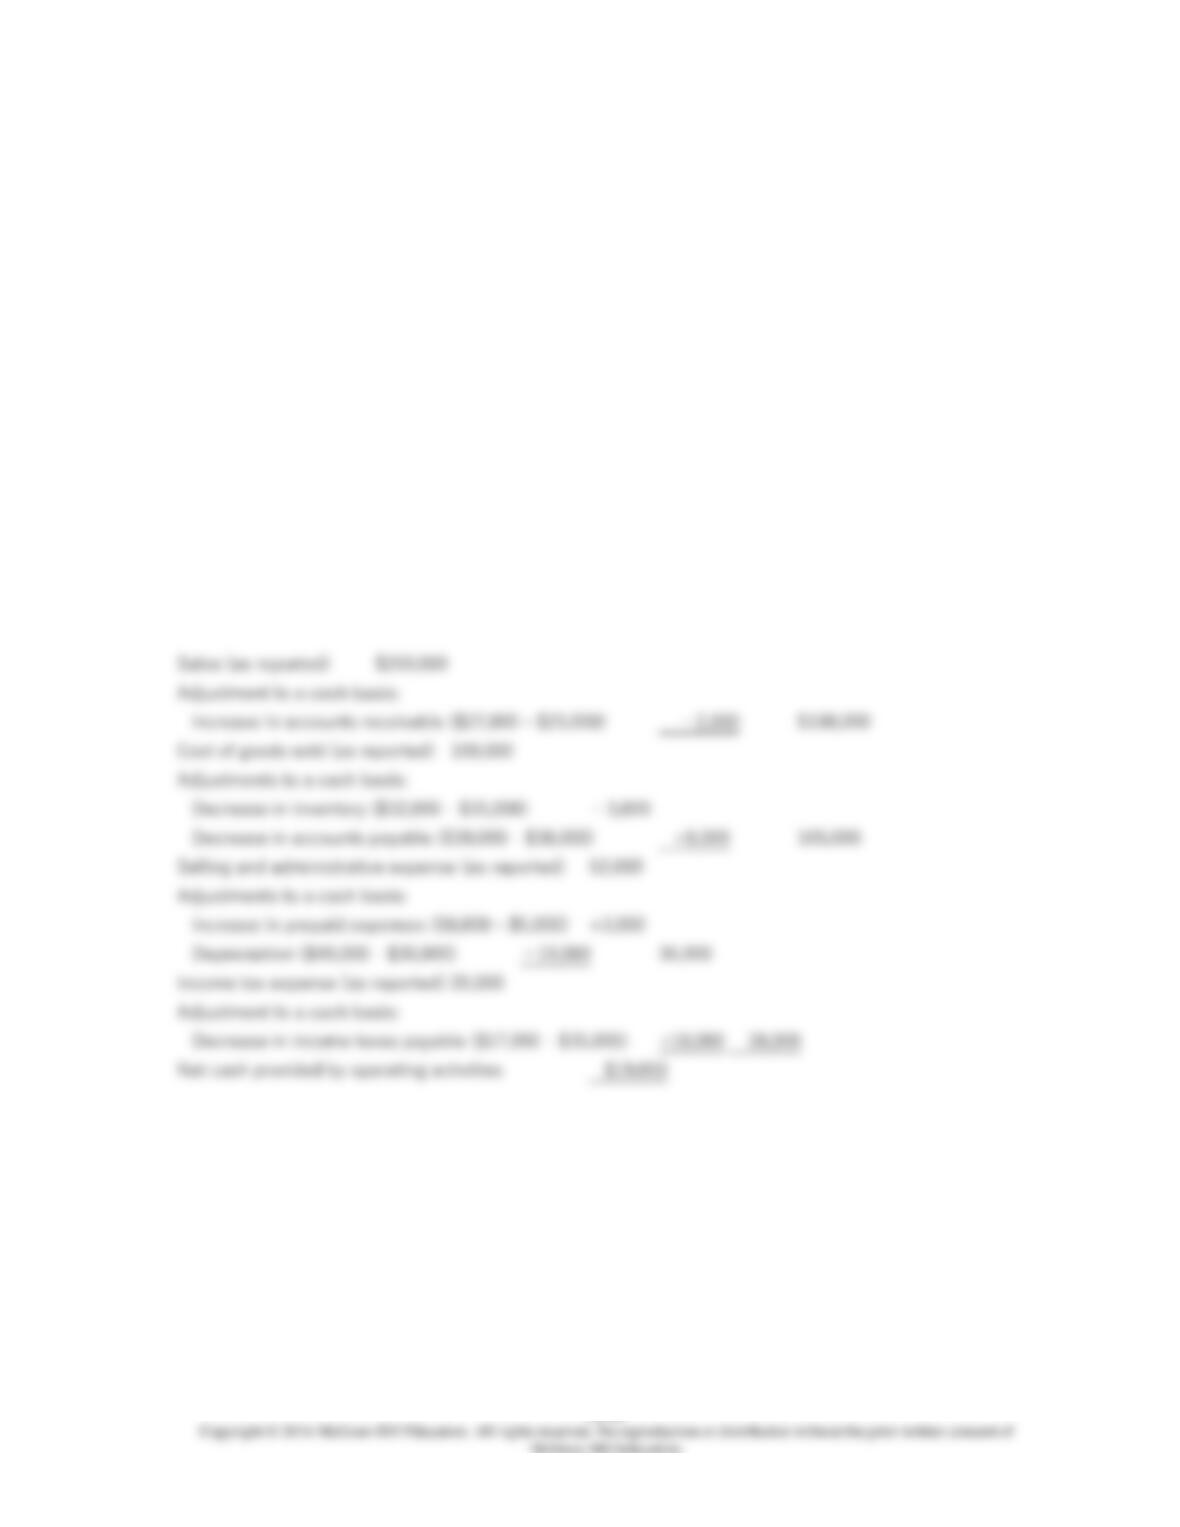
56. Freeport Corporation’s income statement for last year appears below:
Income Statement
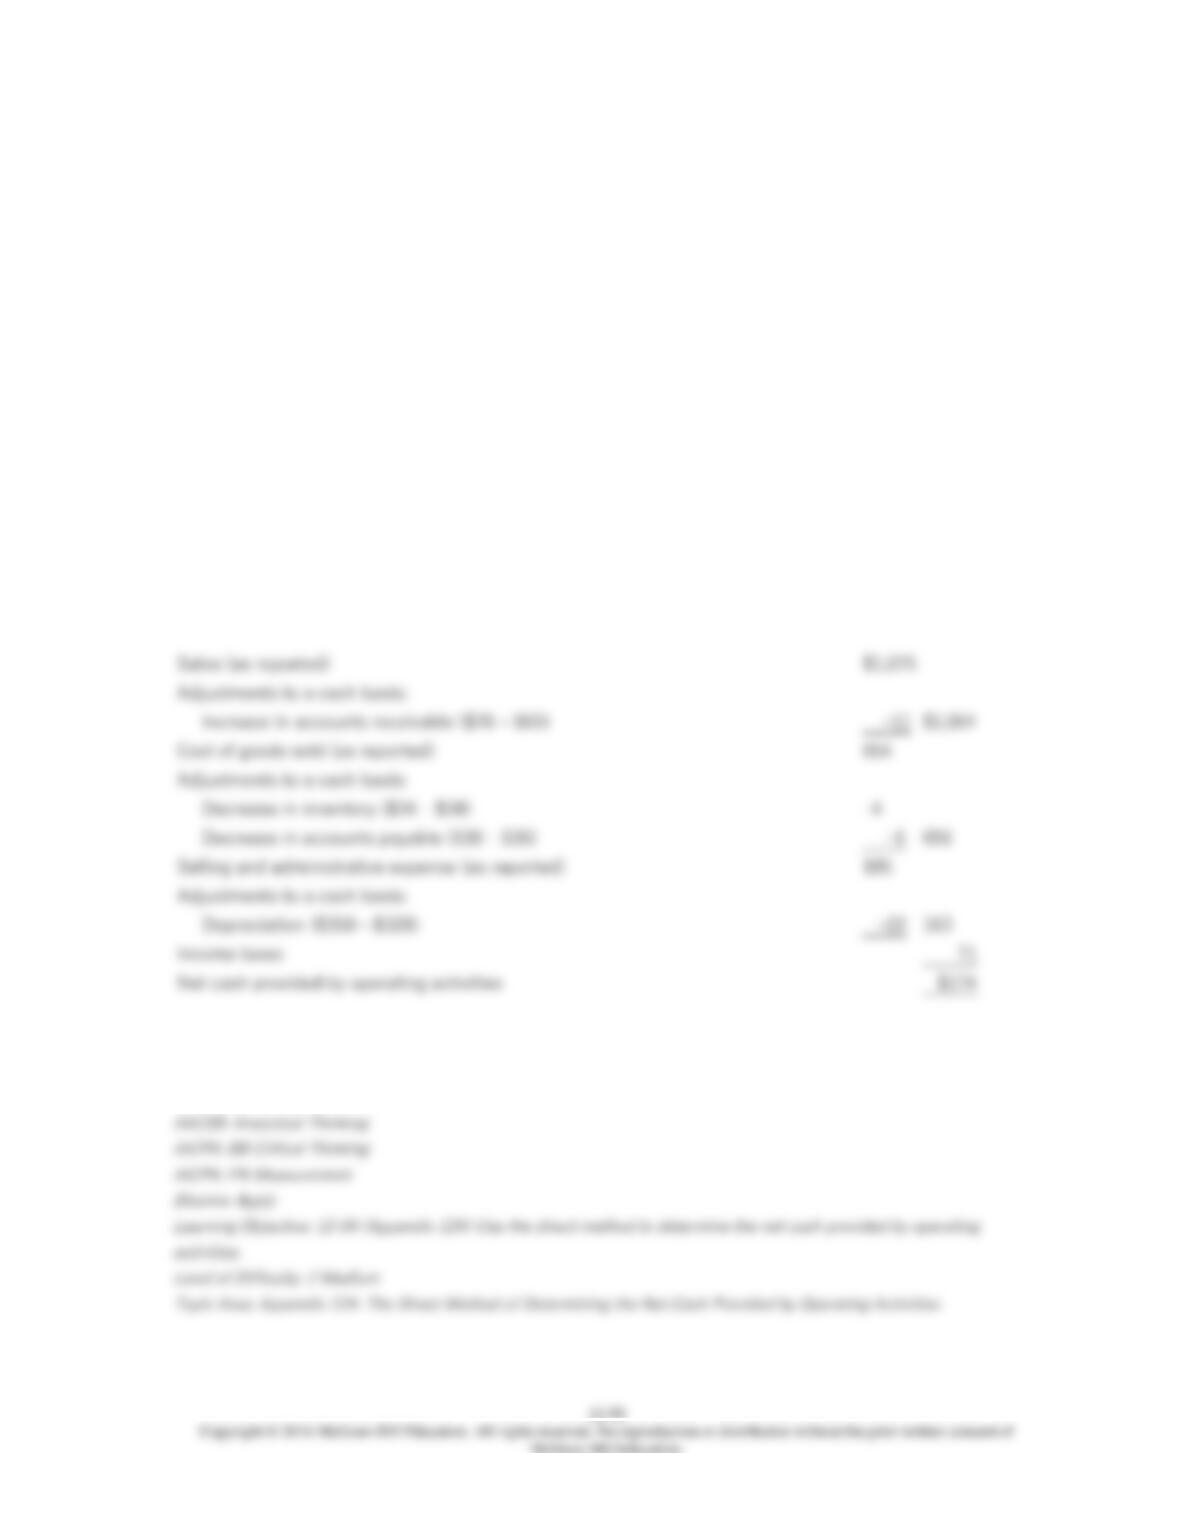
Sales $300,000
Cost of goods sold 200,000
Gross margin 100,000
Selling and administrative expense 60,000
Income before income taxes 40,000
Income taxes 16,000
Net income $24,000
The beginning and ending balances for last year are available for the following selected accounts
(the company did not dispose of any property, plant, and equipment during the year):
Ending Balance Beginning Balance
Accounts receivable $32,000 $40,000
Inventory $60,000 $50,000
Prepaid expenses $12,000 $8,000
Accumulated depreciation $40,000 $30,000
Accounts payable $30,000 $45,000
Accrued liabilities $16,000 $10,000
Income taxes payable $2,000 $5,000
Required:
Using the direct method, prepare in good form the operating activities section of the statement
of cash flows.