128. Devlin Company
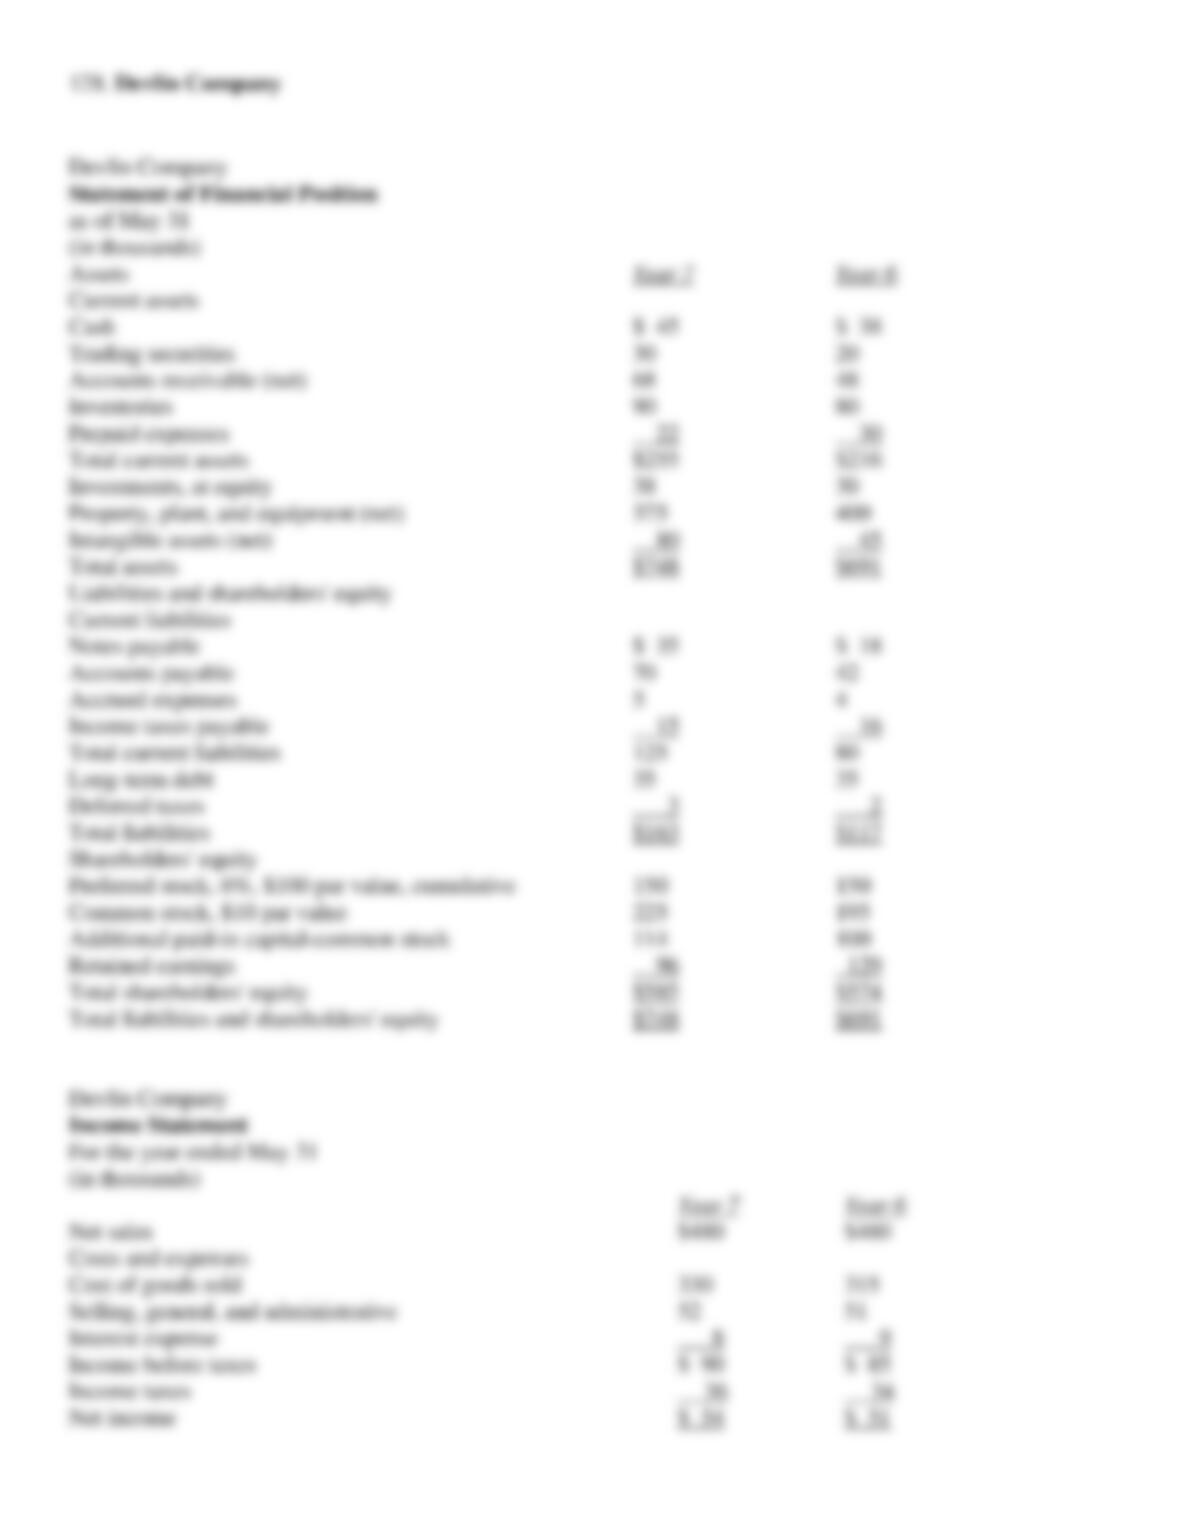
Devlin Company
Statement of Financial Position
as of May 31
(in thousands)
Assets
Year 7
Year 6
Current assets
Cash
$ 45
$ 38
Trading securities
30
20
Accounts receivable (net)
68
48
Inventories
90
80
Prepaid expenses
22
30
Total current assets
$255
$216
Investments, at equity
38
30
Property, plant, and equipment (net)
375
400
Intangible assets (net)
80
45
Total assets
$748
$691
Liabilities and shareholders’ equity
Current liabilities
Notes payable
$ 35
$ 18
Accounts payable
70
42
Accrued expenses
5
4
Income taxes payable
15
16
Total current liabilities
125
80
Long-term debt
35
35
Deferred taxes
3
2
Total liabilities
$163
$117
Shareholders’ equity
Preferred stock, 6%, $100 par value, cumulative
150
150
Common stock, $10 par value
225
195
Additional paid-in capital-common stock
114
100
Retained earnings
96
129
Total shareholders’ equity
$585
$574
Total liabilities and shareholders’ equity
$748
$691
Devlin Company
Income Statement
For the year ended May 31
(in thousands)
Year 7
Year 6
Net sales
$480
$460
Costs and expenses
Cost of goods sold
330
315
Selling, general, and administrative
52
51
Interest expense
8
9
Income before taxes
$ 90
$ 85
Income taxes
36
34
Net income
$ 54
$ 51

(CMA adapted, Jun 97 #16) Refer to the Devlin Company example. Devlin Company’s asset turnover for the
year ended May 31, Year 7, was
129. Devlin Company
Devlin Company
Statement of Financial Position
as of May 31
(in thousands)
Assets
Year 7
Year 6
Current assets
Cash
$ 45
$ 38
Trading securities
30
20
Accounts receivable (net)
68
48
Inventories
90
80
Prepaid expenses
22
30
Total current assets
$255
$216
Investments, at equity
38
30
Property, plant, and equipment (net)
375
400
Intangible assets (net)
80
45
Total assets
$748
$691
Liabilities and shareholders’ equity
Current liabilities
Notes payable
$ 35
$ 18
Accounts payable
70
42
Accrued expenses
5
4
Income taxes payable
15
16
Total current liabilities
125
80
Long-term debt
35
35
Deferred taxes
3
2
Total liabilities
$163
$117
Shareholders’ equity
Preferred stock, 6%, $100 par value, cumulative
150
150
Common stock, $10 par value
225
195
Additional paid-in capital-common stock
114
100
Retained earnings
96
129
Total shareholders’ equity
$585
$574
Total liabilities and shareholders’ equity
$748
$691
Devlin Company
Income Statement
For the year ended May 31
(in thousands)
Year 7
Year 6
Net sales
$480
$460
Costs and expenses
Cost of goods sold
330
315
Selling, general, and administrative
52
51
Interest expense
8
9
Income before taxes
$ 90
$ 85
Income taxes
36
34
Net income
$ 54
$ 51
(CMA adapted, Jun 97 #17) Refer to the Devlin Company example. Devlin Company’s rate of return on assets
for the year ended May 31, Year 7, was
130. (CMA adapted, Jun 96 #18) The book value per share calculation of a corporation is usually significantly
different from the market value of the stock’s selling price due to the
131. A firm desires to increase its ratio of cash flow from operations divided by average current liabilities from
its anticipated level of 30 percent for the coming year to a more desirable level of 40 percent. Which of the
following actions is consistent with this increase?
132. A steel manufacturer experienced a decrease in its fixed asset turnover from .9 in Year 5 to .7 in Year 6.
This change is consistent with which of the following explanations?
133. Inventory turnover ratio
134. The numerator of the rate of return on common shareholders’ equity
135. The rate of return on common shareholders’ equity
136. Using lower cost borrowed funds and earning a higher rate of return on those funds than their cost
137. Financial leverage
138. Financial leverage
139. The capital structure leverage ratio
140. Earnings per share of common stock (assuming no convertible or other potentially dilutive securities
outstanding)
141. Firms with convertible preferred stock or other potentially dilutive securities outstanding
142. Various techniques are used in the analysis of financial data to emphasize the comparative and relative
importance of data presented and to evaluate the position of the firm. These techniques include
143. Concerning the analysis of financial data to emphasize the comparative and relative importance of data
presented and to evaluate the position of the firm, it is important to take into consideration
144. For each of the following independent situations, solve for the unknown amount.
CASE A
CASE B
CASE C
CASE D
Current ratio
A
1.14
2.0
0.67
Quick ratio
1.0
B
1.0
0.60
Current liabilities
400
175
100
360
Current assets
150
200
C
240
Highly liquid assets
400
75
100
D

145. Indicate the effects (increase, decrease, no effect) of the following independent transactions on (1) the
profit margin ratio, (2) the plant asset turnover, and (3) the inventory turnover.
Profit Margin
Plant Asset
Inventory
Ratio
Turnover
Turnover
a.
Payment of various repair expenses
__________
__________
__________
b.
Purchase of inventory on account
__________
__________
__________
c.
Purchase of equipment
__________
__________
__________
d.
Payment of bonds payable
__________
__________
__________
Profit Margin
Plant Asset
Inventory
Ratio
Turnover
Turnover
a.
Payment of various repair expenses
Decrease
No effect
No effect
b.
Purchase of inventory on account
No effect
No effect
Decrease
c.
Purchase of equipment
No effect
Decrease
No effect
d.
Payment of bonds payable
No effect
No effect
No effect
146. For each of the following independent situations, suggest what ratio would provide appropriate information
to answer the question.
a.
You need to determine the number of days outstanding for accounts receivable.
b.
You are considering investing in bonds of a publicly held company. You wish to analyze the
possibility of the company failing to meet required interest payments.
c.
You wish to measure and compare a firm’s performance in using assets independent of the financing
of the assets to the industry average.
d.
You wish to assess a company’s ability to meet immediate liabilities in an emergency.
e.
You would like to determine how much capital is provided by common shareholders.
f.
You wish to understand how long inventory remains on hand during the period.
g.
You are considering how much additional long-term debt a company may be able to take on.
h.
You are interested in how productive a company’s fixed assets have been.
a.
Accounts receivable turnover ratio or number of days’ sales in receivables
b.
Interest coverage ratio
c.
Rate of return on assets
d.
Quick ratio
e.
Leverage ratio
f.
Days inventory held or inventory turnover ratio
g.
Long-term debt ratio
h.
Fixed asset turnover ratio
147. Given the following information for the Quest Company, calculate the ratios as requested.
December 31,
December 31,
Year 1
Year 2
Current assets
$100,000
$150,000
Noncurrent assets
400,000
500,000
Current liabilities
50,000
100,000
Long-term debt
300,000
300,000
Common stock, 10,000 shares
100,000
100,000
Retained earnings
50,000
150,000
Year 2
Net income
$ 100,000
Interest expense
40,000
Income taxes
30,000
Total revenues
1,000,000
a.
Interest coverage ratio
b.
Long-term debt ratio at December 31, Year 2
c.
Total assets turnover
a.
4.25
= (100,000 + 40,000 + 30,000) / 40,000
b.
54.5%
= 300,000 / 550,000
c.
1.74
= 1,000,000 / ((500,000 + 650,000)/2)

148. Use the following comparative balance sheet to compute ratios as requested.
Buff Company
COMPARATIVE BALANCE SHEET
As of December 31, Year 1 and Year 2
Assets
Year 2
Year 1
Current assets
Cash
$10,000
$ 5,000
Accounts receivable
6,000
4,000
Merchandise inventory
20,000
15,000
Total Current assets
$36,000
$24,000
Property, plant, and equipment
Building
30,000
30,000
Total Assets
$66,000
$54,000
Liabilities and Shareholders’ Equity
Current liabilities
Advance from customer
$ 400
$ 500
Accounts payable
1,000
1,000
Rent payable
2,000
1,500
Utilities payable
200
200
Salaries payable
1,000
800
Total Current liabilities
$ 4,600
$ 4,000
Shareholders’ Equity
Common stock, 2,000 shares
5,000
5,000
Additional paid-in capital
40,000
40,000
Retained earnings
16,400
5,000
Total Shareholders’ equity
61,400
50,000
Total Liabilities and shareholders’ equity
$66,000
$54,000
Compute the following ratios at year end for Year 2 for Buff Company:
a.
Long-term debt ratio
b.
Debt-equity ratio
c.
Current ratio
d.
Leverage ratio
Assume that a bank loans $10,000 cash (due in 5 years) to the company on December 31, Year 2. Make the
appropriate adjustments to the financial statements and compute the following ratios:
e.
Long-term debt ratio
f.
Debt-equity ratio
g.
Current ratio
h.
Leverage ratio

a.
0
= 0 / (61,400 + 0)
b.
6.97%
= 4,600 / 66,000
c.
7.8
= 36,000 / 4,600
d.
1.077
= ((54,000 + 66,000)/2) / ((50,000 + 61,400)/2)
e.
14%
= 10,000 / (61,400 + 10,000)
f.
19.2%
= 14,600 / 76,000
g.
10
= 46,000 / 4,600
h.
1.16
= ((54,000 + 76,000)/2) / ((50,000 + 61,400)/2)
149. (CMA adapted, Jun 90 #3) 2com Company is a manufacturer of highly specialized products for networking
video-conferencing equipment. Production of specialized units are, to a large extent, under contract, with
standard units manufactured to marketing projections. Maintenance of customer equipment is an important area
of customer satisfaction. With the recent downturn in the computer industry, the video-conferencing equipment
segment has suffered, causing a slide in 2com’s performance. 2com’s Income Statement for the fiscal year ended
October 31, Year 3, is presented below.
2com Company
Income Statement
For the Year Ended October 31, Year 3
($000 omitted)
Net sales
Equipment
$6,000
Maintenance contracts
1,800
Total net sales
$7,800
Expenses
Cost of goods sold
4,600
Customer maintenance
1,000
Selling expense
600
Administrative expense
900
Interest expense
150
Total expenses
$7,250
Income before income taxes
$ 550
Income taxes
220
Net income
$ 330

2com’s return on sales before interest and taxes was 9 percent in fiscal Year 3 while the industry average was 12
percent. 2com’s total asset turnover was three times, and its return on average assets before interest and taxes
was 27 percent, both well below the industry average. In order to improve performance and raise these ratios
nearer to, or above, industry averages, Bill Hunt, 2com’s president, established the following goals for fiscal
Year 4.
·
Return on sales before interest and taxes 11 percent
·
Total asset turnover 4 times
·
Return on average assets before interest and taxes 35 percent
To achieve Hunt’s goals, 2com’s management team took into consideration the growing international
video-conferencing market and proposed the following actions for fiscal Year 4.
·
Increase equipment sales prices by 10 percent.
·
Increase the cost of each unit sold by 3 percent for needed technology and quality improvements, and
increased variable costs.
·
Increase maintenance inventory by $250,000 at the beginning of the year and add two maintenance
technicians at a total cost of $130,000 to cover wages and related travel expenses. These revisions are
intended to improve customer service and response time. The increased inventory will be financed at an
annual interest rate of 12 percent; no other borrowings or loan reductions are contemplated during fiscal
Year 4. All other assets will be held to fiscal Year 3 levels.
·
Increase selling expenses by $250,000 but hold administrative expenses at Year 3 levels.
·
The effective rate for Year 4 federal and state taxes is expected to be 40 percent, the same as Year 3.
It is expected that these actions will increase equipment unit sales by 6 percent, with a corresponding 6 percent
growth in maintenance contracts.
Required:
a.
Prepare a Pro Forma Income Statement for 2com Company for the fiscal year ending October 31, Year
4, on the assumption that the proposed actions are implemented as planned and that the increased sales
objectives will be met. (All numbers should be rounded to the nearest thousand, i.e., $000 omitted.)
b.
Calculate the following ratios for 2com Company for fiscal Year 4 and determine whether Bill Hunt’s
goals will be achieved.
1. Return on sales before interest and taxes.
2. Total asset turnover.
3. Return on average assets before interest and taxes.
c.
Discuss the limitations and difficulties that can be encountered in using ratio analysis, particularly
when making comparisons to industry averages.
a. The Pro Forma Income Statement for 2com Company for the fiscal year ended October 31,
Year 4, assuming all of management’s proposed actions are implemented and the increased sales
objectives are met, is presented below.
2com Company
Pro Forma Income Statement
For the Year Ending October 31, Year 4
($000 omitted)
Net sales
Equipment ($6,000 ´ 1.06 ´ 1.10)
Maintenance ($1,800 ´ 1.06)
Total net sales
Expense
Cost of goods sold ($4,600 ´ 1.03 ´ 1.06)
Customer maintenance ($1,000 + $130)
Selling expense ($600 + $250)
Administrative expense
Interest [$150 + ($250 ´ .12) ]
Total expenses
Income before income taxes
Income taxes
Net income
b.
1.
Return on sales before interest and taxes = (Income before interest taxes) / Sales
= ($493 +329 +180) / $8,904 = 11.25%
The goal of 11 percent return on sales before interest and taxes would be exceeded by .25%.
2.
Total asset turnover = Sales / Average assets
= [$8,904 / ($2,600* + 250)] = 3.12
*
Year 3 average assets = Year 3 sales / Year 3 turnover of average assets
= $7,800 / 3 = $2,600
The goal of total asset turnover of four times would not be achieved (3.12 is less than 4).
3.
Return on average assets before interest and taxes = (Income before interest and taxes) / Average assets
= ($493 + 329 + 180) / ($2,600 + 250) = 35.15%
The goal of thirty-five percent return on average assets before interest and taxes would be exceeded by
.15%.
c.
The limitations and difficulties that can be encountered in using ratio analyses include the following:

·
Various techniques are used in the analysis of financial data to emphasize the comparative and relative
importance of data presented and to evaluate the position of the firm. These techniques include ratio
analysis, common size analysis, examination of relative size among firms, etc. The information derived
from these types of analyses should be blended. No one type of analysis is best or sufficient to support
overall findings or to serve all types of users.
·
The nature of the general business environment and direct competition in a company’s geographical area
can result in special situations not encountered throughout the industry which creates deviations from
the industry norm.
·
Identical companies may use different valuation or expense methods (e.g., LIFO, FIFO, average cost,
standard costs, different depreciation methods, etc.). Consequently, footnotes to the financial statements
must be carefully analyzed to determine comparability.
150. The financial statements of the Press Company appear below. Calculate the following ratios:
a.
Rate of return on assets
b.
Rate of return on common shareholders’ equity
c.
Earnings per share of common stock
d.
Current ratio (both dates)
e.
Cash flow from operations to current liabilities
f.
Debt-equity ratio (both dates)
g.
Cash flow from operations to total liabilities
h.
Interest coverage
January 1
December 31
Current assets
$180,000
$210,000
Noncurrent assets
255,000
275,000
Current liabilities
85,000
78,000
Long-term liabilities
30,000
75,000
Common stock, 10,000 shares
300,000
300,000
Retained earnings
20,000
32,000
Operations
Net income
$84,000
Interest expense
3,000
Income taxes (30 percent rate)
36,000
Cash provided by operations
30,970
Dividends declared
72,000

a.
$84,000 + (1-0.30)$3,000 / 0.5($435,000 + $485,000) = 18.7 percent
b.
$84,000 / 0.5($320,000 + $332,000) = 25.8 percent
c.
$84,000 / 10,000 shares = $8.40 per share
d.
January 1 $180,000 / $85,000 = 2.12:1
December 31 $210,000 / $78,000 = 2.69:1
e.
$30,970 / 0.5($85,000 + $78,000) = 38.0 percent
f.
January 1 $115,000 / $435,000 = 26.4 percent
December 31 $153,000 / $485,000 = 31.5 percent
g.
$30,970 / 0.5($115,000 + $153,000) = 23.1 percent
h.
($84,000 + $36,000 + $3,000) / $3,000 = 41.0 times per year
151. (CMA Jun 96 #6) All-Things Inc. manufactures a variety of consumer products. The company’s founders
have managed the company for thirty years and are now interested in retiring. Consequently, they are seeking to
sell the company. Trial Associates is looking into the acquisition of All-Things and has requested the latest
financial statements and selected financial ratios in order to evaluate All-Things‘ financial stability and
operating efficiency. The summary information provided by All-Things is presented below.
All-Things Inc.
Income Statement
For the Year Ended May 31,Year 6
(in thousands)
Sales (net)
$30,500
Interest income
500
Total revenue
$31,000
Costs and expenses:
Cost of goods sold
17,600
Selling and administrative expense
3,550
Depreciation and amortization expense
1,890
Interest expense
900
Total costs and expenses
$23,940
Income before taxes
7,060
Income taxes
2,900
Net income
$ 4,160

Selected Financial Ratios
5-Year
All-Things
Industry
Year 4
Year 5
Average
Current ratio
1.62
1.61
1.63
Acid-test ratio
.63
.64
.68
Total asset turnover
1.83
1.84
1.84
Inventory turnover
3.21
3.17
3.18
Times interest earned
8.50
8.55
8.45
Total debt to net worth (Total debt / Total shareholders’
equity)
1.02
.86
1.03
Net profit margin
12.1%
13.2%
13.0%
All-Things Inc.
Comparative Statement of Financial Position
As of May 31
(In thousands)
Year 6
Year 7
Cash
$ 400
$ 500
Marketable securities (at cost)
500
200
Accounts receivable (net)
3,200
2,900
Inventory
5,800
5,400
Total current assets
$ 9,900
$ 9,000
Property, plant, and equipment (net)
7,100
7,000
Total assets
$17,000
$16,000
Accounts payable
$ 3,700
$ 3,400
Income taxes payable
900
800
Accrued expenses
1,700
1,400
Total current liabilities
$ 6,300
$ 5,600
Long-term debt
2,000
1,800
Total liabilities
$ 8,300
$ 7,400
Common stock ($1 par value)
2,700
2,700
Paid-in-capital in excess of par
1,000
1,000
Retained earnings
5,000
4,900
Total shareholders’ equity
$ 8,700
$ 8,600
Total liabilities and shareholders’ equity
$17,000
$16,000
Required:
a.
Calculate a new set of ratios for the fiscal Year 6 for All-Things Inc. based on the financial statements
presented.
b.
Briefly explain the analytical use of each of the seven ratios presented, describing what the investors
can learn about All-Things Inc.’s financial stability and operating efficiency.
c.
Identify two limitations of ratio analysis.

a.
The calculation of selected financial ratios for All-Things Inc. for the fiscal Year 6 is as follows.
Current ratio = Current assets / Current liabilities =~ $9,900 / $6,300 = 1.57
Acid-test ratio = (Cash + Marketable securities + Net receivables) / Current liabilities = ($400 + $500 +
$3,200) / $6,300 = 0.65
Total asset turnover = Net sales / Average total assets = $30,500 / ($17,000+$16,000)/2 = 1.85 times
Inventory turnover = Cost of goods sold / Average inventory = $17,600 / ($5,800 + $5,400)/2 = 3.14
times
Times interest earned = Income before interest & taxes / Interest expense = ($7,060 + $900) / $900 =
8.84
Total debt to net worth = Total debt / Total shareholders’ equity = $8,300 / $8,700 = 0.95
Net profit margin = Net income / Net sales = $4,160 / $30,500 = 13.64%

b.
The analytical use of each of the seven ratios and what investors can learn about All-Things Inc.’s
financial stability and operating efficiency is presented below.
Current ratio
·
Measures the ability to meet short-term obligations using short-term assets.
·
All-Things’ ratio has declined over the last three years from 1.62 to 1.57. This declining trend, coupled
with the fact that it is below the industry average, is not yet a major concern; however, the company
should be watched in the future.
Acid-test ratio
·
Measures the ability to meet short-term debt using the most liquid (quick) assets; i.e., excluding the
amount invested in inventory.
·
All-Things has improved its acid-test ratio over the last three years, but it is still below the industry
average. Furthermore, an acid-test ratio below 1.0 indicates that All-Things may have difficulty meeting
its short-term obligations if inventory does not turn over fast enough.
Total asset turnover
·
Measures the efficiency of resource use, i.e., the ability to generate sales through the use of assets. This
ratio can be significantly affected by the depreciation method used by the company, as well as the age
of assets
·
All-Things has been steadily improving and is slightly above the industry average.
Inventory turnover
·
Measures how quickly inventory is sold as well as how effectively investment in inventory is used and
managed. This ratio can be significantly affected by the inventory costing method used.
·
All-Things’ ratio has been steadily declining and is below the industry average. This slower than
average situation may indicate a decline in operating efficiency, hidden obsolete inventory, or
overpriced stock items.
Times interest earned
·
Measures the ability to meet interest commitments from current earnings. The higher the ratio, the more
safety there is for long-term creditors.
·
All-Things’ ratio has been improving over the last three years and is above the industry average. This
indicates that All-Things has been paying down or refinancing debt, or increasing sales and profits,
which is a sign of long-term stability.
Total debt to net worth
·
Measures the level of protection creditors have in the case of possible insolvency. Measures the degree
of financial leverage and whether or not the firm will be able to obtain additional financing through
borrowing.
·
All Things’ ratio has deteriorated slightly in Year 6, but has been below the industry average over the
last three years. This indicates that All-Things should be able to raise additional financing through debt
and still remain below the industry average, indicating long-term stability.
Net profit margin
·
Measures the net income generated by each dollar of sales. The net profit margin ratio provides some
indication of the ability of the firm to absorb cost increases or sales declines.
·
All-Things’ net profit margin has been improving and is currently above the industry average.
Furthermore, this improving net profit margin indicates the ability of the firm to weather soft economic
periods, pay down debt, or take on additional debt for expansion.

c.
At least two limitations of ratio analysis include the following.
·
It is often difficult to make comparisons among firms within an industry due to accounting differences.
Different numbers can be shown in the financial statements for the same economic event because of
different accounting methods, such as straight-line depreciation versus accelerated methods, LIFO
versus FIFO inventory valuations. etc.
·
Ratios represent conditions that existed in the past, and may not be an indication of the future trend.
152. Hewlett-Packard Company (HP) designs, manufactures, and services computers and related products for a
variety of industries worldwide. Economic characteristics of the computer industry include:
1.
High rate of research and development spending and technological change.
2.
Increasing use of outsourcing for the manufacture of computer components.
3.
Reduced levels of product differentiation on computer hardware, with companies attempting to
differentiate themselves on software, networking capabilities, service, and other capabilities.
4.
Low financial leverage.

HP distributes its printers primarily through independent distributors and retailers.
Below are the various financial ratios for HP for Year 3 to Year 5.
Exhibit 4
Financial Statement Ratios for Hewlett-Packard
Year 3
Year 4
Year 5
Rate of Return on Assets (ROA)
8.0%
9.1%
11.4%
Profit Margin for ROA (before interest effects)
6.2%
6.8%
8.1%
Total Assets Turnover
1.3
1.3
1.4
Rate of Return on Common Shareholders’ Equity
(ROCE)
14.7%
17.3%
22.4%
Profit Margin for ROCE (after interest effects)
5.8%
6.4%
7.7%
Leverage Ratio
2.0
2.0
2.1
Cost of Goods Sold/Sales
59.7%
62.0%
63.5%
Selling & Admin. Expense/Sales
22.4%
19.7%
17.9%
Research & Development Expense/Sales
8.7%
8.1%
7.3%
Income Tax Expense (excluding tax effects of
interest)/Sales
3.2%
3.5%
4.0%
Accounts Receivable Turnover
5.3
5.4
5.4
Days Accounts Receivable Outstanding
69
68
68
Inventory Turnover
3.9
3.9
3.9
Days Inventory Held
94
94
94
Plant Asset Turnover
4.5
5.2
6.2
Current Ratio
1.5
1.5
1.5
Quick Ratio
.9
.9
.9
Accounts Payable Turnover
12.2
11.8
11.1
Days Accounts Payable Outstanding
30
31
33
Cash Flow from Operations/Average
Current Liabilities
19.1%
29.5%
16.8%
Long-term Debt Ratio
13.1%
9.5%
9.3%
Debt-Equity Ratio
51.0%
50.5%
52.6%
Cash Flow from Operations/Average
Total Liabilities
14.7%
23.4%
13.9%
Times Interest Charges Earned
15.7
16.6
18.6
Sales Growth Rate
23.8%
23.0%
26.1%
Capital Expenditures Growth Rate
40.2%
(18.8%)
35.3%
Required:
Each of these questions can be answered in two to three sentences.
a.
Give two likely reasons for the increasing cost of goods sold to sales percentage.
b.
Give two likely reasons for the decreasing selling and administrative expense to sales percentages.
c.
What is the likely reason for the increase in the income tax expense (excluding tax effects of interest) to
sales percentage?
d.
What is the likely reason for the increase in the plant asset turnover during the three years?
e.
Did financial leverage work to the advantage of the common shareholders during the three years?
Explain.
f.
What is the likely reason for the decrease in the cash flow from operations to average current liabilities
ratio between Year 4 and Year 5?
153. Financial statement analysis often assess the profitability and risk of an organization. Specific ratios target
each of these areas to answer questions such as “How profitable is this company?” or “How risky (liquid) is an
investment in this company?”
Required:
a.
Discuss three ratios that address how profitable a company might be.
b.
Discuss three ratios that address how risky (liquid) a company might be.