Operations Management: Processes and Supply Chains, 12e (Krajewski)
Chapter 8 Forecasting
1) The repeated observations of demand for a product or service in their order of occurrence form a
pattern known as a time series.
2) One of the basic time series patterns is random.
3) A water ski manufacturer believes they can double their sales by producing snow skis during the other
half of the year. This approach to demand management is an example of complementary products.
4) A weary traveler shows up at a hotel desk at midnight without a reservation. The desk clerk informs
him that there is a room available, but sadly it is marked up 80% higher than the usual price. This is an
example of promotional pricing.
5) Which one of the following basic patterns of demand is difficult to predict because it is affected by
national or international events or because of a lack of demand history reflecting the stages of demand
from product development to decline?
A) horizontal
B) seasonal
C) random
D) cyclical
6) The electricity bill at Padco was driven solely by the lights throughout the office; everything else was
driven by alternative energy sources. The office was open roughly 8 hours a day, five days a week and
the cleaning crew spent about the same amount of time in the offices each week night. The kilowatt hour
usage for the office was best described as a:
A) horizontal demand pattern.
B) random demand pattern.
C) seasonal demand pattern.
D) cyclical demand pattern.
7) A regression equation with a coefficient of determination near one would be most likely to occur when
the data demonstrated a:
A) seasonal demand pattern.
B) trend demand pattern.
C) cyclical demand pattern.
D) random demand pattern.
8) Professor Willis noted that the popularity of his office hours mysteriously rose in the middle and the
end of each semester, falling off to virtually no visitors throughout the rest of the year. The demand
pattern at work is:
A) cyclical.
B) random.
C) seasonal.
D) trend.
9) There are historically three 32-month periods of generally rising prices in the stock market for every
one 9-month period of falling prices. This observation leads you to conclude that the stock market
exhibits a:
A) random pattern.
B) trend pattern.
C) seasonal pattern.
D) cyclical pattern.
10) Polly Prognosticator was the greatest quantitative forecaster in recorded history. A skillful user of all
techniques in your chapter on forecasting, she knew better than to try and develop a forecast for data that
exhibited a:
A) random pattern.
B) horizontal pattern.
C) seasonal pattern.
D) cyclical pattern.
11) Which one of the following statements about the patterns of a demand series is false?
A) The five basic patterns of most business demand series are the horizontal, trend, seasonal, cyclical, and
random patterns.
B) Estimating cyclical movement is difficult. Forecasters do not know the duration of the cycle because
they cannot predict the events that cause it.
C) The trend, over an extended period of time, always increases the average level of the series.
D) Every demand series has at least a random component.
12) One aspect of demand that makes every forecast inaccurate is:
A) trend variation.
B) random variation.
C) cyclical variation.
D) seasonal variation.
13) A weary traveler shows up at a hotel desk at midnight without a reservation. The desk clerk informs
him that there is a room available, but sadly it is marked up 80% higher than the usual price. This is an
example of:
A) promotional pricing.
B) yield management.
C) backlogs.
D) backorder.
14) “Well if you’re out of Duff I’ll just take my business elsewhere!” the customer shouted as he stomped
out of the Quickie Mart. This unfortunate incident could be described as:
A) a stockout.
B) a backorder.
C) a backlog.
D) yield management.
15) What is the difference between a reservation and an appointment?
A) There is no difference between the two terms.
B) The term reservation implies that the customer has paid in advance.
C) The term appointment implies that the customer has paid in advance.
D) The term reservation is issued when the customer occupies the facility to receive service.
16) In the winter, Handyman Negri repaired snowblowers and in the summer he earned extra money by
repairing lawnmowers, a classic example of:
A) promotional pricing.
B) complementary products.
C) mixed model service.
D) yield management.
17) A systematic increase or decrease in the mean of the series over time is a(n) ________.
18) Variations in demand that cannot be predicted are said to be a(n) ________ pattern.
19) Nathan managed to level the customer requests for his valuable services by offering reservations,
deploying some promotional pricing, and engaging in yield management, all forms of ________.
20) Draw a curve that represents four out of the five demand patterns for time series as discussed in this
chapter. Clearly label both dependent and independent axis and the salient features of your graph that
demonstrate your chosen patterns. Select a product or service and discuss what influences might cause it
to exhibit each of these patterns.
1) Aggregation is the act of clustering several similar products or services.
2) Aggregating products or services together generally decreases the forecast accuracy.
3) Which one of the following statements about forecasting is false?
A) Causal methods of forecasting use historical data on independent variables (promotional campaigns,
competitors’ actions, etc.) to predict demand.
B) Three general types of forecasting techniques are used for demand forecasting: time-series analysis,
causal methods, and judgment methods.
C) Time series express the relationship between the factor to be forecast and related factors such as
promotional campaigns, economic conditions, and competitor actions.
D) A time series is a list of repeated observations of a phenomenon, such as demand, arranged in the
order in which they actually occurred.
4) When forecasting total demand for all their services or products, few companies err by more than:
A) one to four percent.
B) five to eight percent.
C) nine to twelve percent.
D) thirteen to sixteen percent.
5) Which one of the following statements about forecasting is true?
A) The five basic patterns of demand are the horizontal, trend, seasonal, cyclical, and the subjective
judgment of forecasters.
B) Judgment methods are particularly appropriate for situations in which historical data are lacking.
C) Casual methods are used when historical data are available and the relationship between the factor to
be forecast and other external and internal factors cannot be identified.
D) Focused forecasting is a technique that focuses on one particular component of demand and develops
a forecast from it.
6) ________ methods of forecasting translate the opinions of management, experts, consumers, or
salesforce into quantitative estimates.
7) ________ methods use historical data on independent variables to predict demand.
8) ________ analysis is a statistical approach that relies heavily on historical demand data to project the
future size of demand, and it recognizes trends and seasonal patterns.
9) Why are forecasts for product families typically more accurate than forecasts for the individual items
within a product family?
8.3 Forecast Error
1) Forecasts almost always contain errors.
2) Forecast error is found by subtracting the forecast from the actual demand for a given period.
3) A bias error results from unpredictable factors that cause the forecast to deviate from actual demand.
4) Bias error causes the greatest disruption to planning efforts.
5) Which one of the following is most useful for measuring the bias in a forecast?
A) cumulative sum of forecast errors
B) standard deviation of forecast errors
C) mean absolute deviation of forecast errors
D) percentage forecast error in period t

6) A tracking signal greater than zero and a mean absolute deviation greater than zero imply that the
forecast has:
A) no bias and no variability of forecast error.
B) a nonzero amount of bias and a nonzero amount of forecast error variability.
C) no bias and a nonzero amount of forecast error variability.
D) a nonzero amount of bias and no variability of forecast error.
7) Assume that a time-series forecast is generated for future demand and subsequently it is observed that
the forecast method did not accurately predict the actual demand. Specifically, the forecast errors were
found to be:
Mean absolute percent error = 10%
Cumulative sum of forecast errors = 0
Which one of the statements concerning this forecast is true?
A) The forecast has no bias but has a positive standard deviation of errors.
B) The forecast has a positive bias and a standard deviation of errors equal to zero.
C) The forecast has no bias and has a standard deviation of errors equal to zero.
D) The forecast has a positive bias and a positive standard deviation of errors.

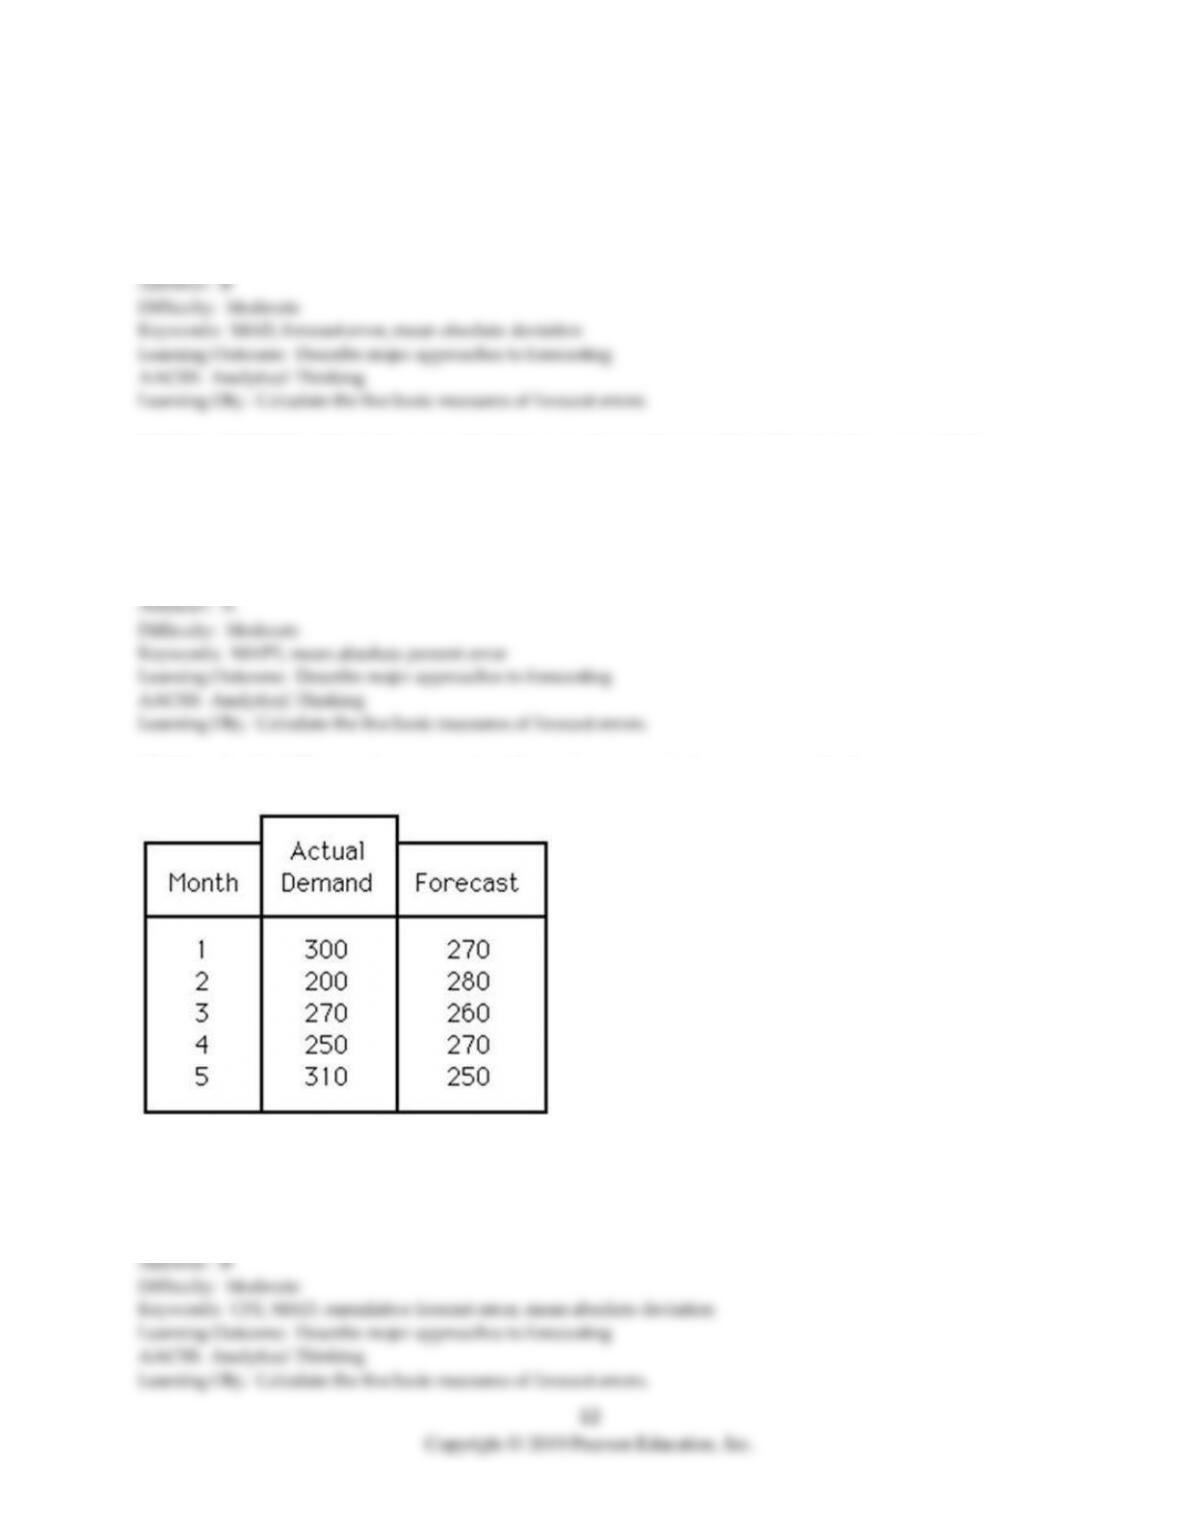
Table 8.1
The management of an insurance company monitors the number of mistakes made by telephone service
representatives for a company they have subcontracted with. The number of mistakes for the past several
months appears in this table along with forecasts for errors made with three different forecasting
techniques. The column labeled Exponential was created using exponential smoothing with an alpha of
0.30. The column labeled MA is forecast using a moving average of three periods. The column labeled
WMA uses a 3-month weighted moving average with weights of 0.65, 0.25, and 0.10 for the most–to-least
recent months.
Month
Mistakes
Exponential
MA
WMA
1
55
2
61
3
71
4
77
71
62
67
5
88
73
70
74
6
100
77
79
84
7
109
84
88
95
8
122
92
99
105
9
126
101
110
117
10
126
108
119
123
8) Using Table 8.1, what is the CFE for months 6-10 for the exponential smoothing technique?
A) less than or equal to 120
B) greater than 120 but less than or equal to 123
C) greater than 123 but less than or equal to 126
D) greater than 126
9) Using Table 8.1, what is the MSE for months 6-10 for the exponential smoothing technique?
A) less than 591
B) greater than or equal to 591 but less than 595
C) greater than or equal to 595 but less than 599
D) greater than 599
10) Using Table 8.1, what is the MAD for months 6-10 for the exponential smoothing technique?
A) less than 23
B) greater than or equal to 23 but less than 25
C) greater than or equal to 25 but less than 27
D) greater than or equal to 27
11) Using Table 8.1, what is the mean absolute percent error for months 6-10 using the exponential
smoothing forecasts?
A) less than 22%
B) greater than or equal to 22% but less than 24%
C) greater than or equal to 24% but less than 26%
D) greater than 26%
12) Consider the following data concerning the performance of a forecasting method.
A) The CFE is greater than 100, and the MAD is less than 50.
B) The CFE is less than 100, and the MAD is less than 50.
C) The CFE is less than 100, and the MAD is greater than 50.
D) The CFE is greater than 100, and the MAD is greater than 50.

13
13) The dispersion of forecast errors is measured by both MAD and MSE, which behave differently in the
way they emphasize errors. ________ gives larger weight to errors and ________ gives smaller weight to
errors.
14) What is the difference between mean absolute deviation (MAD) and mean squared error (MSE)?
15) What are reasonable criteria for selecting one time-series method over another?
Answer: Forecast error measures provide important information for choosing the best forecasting
method for a service or product. They also guide managers in selecting the best values for the parameters
14
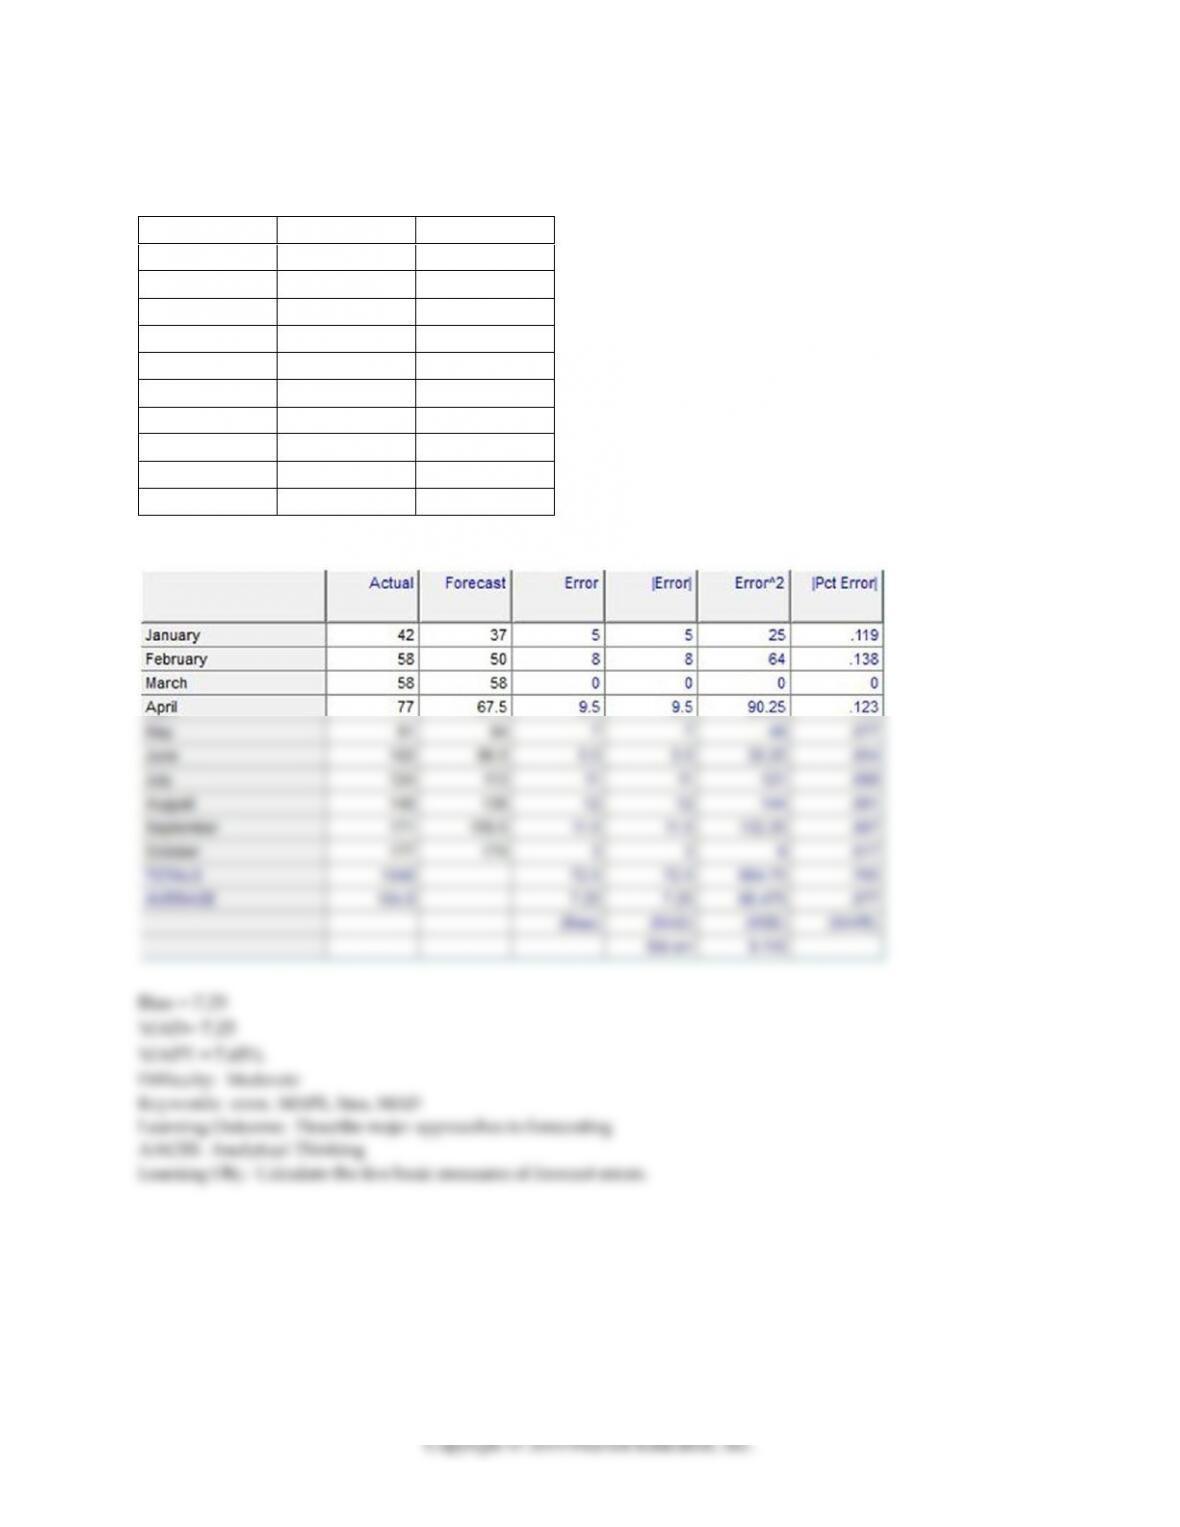
16) Ten months of data and the forecasts for those same periods are in the table below. Use mean bias,
MAD, and MAPE to analyze the accuracy of the forecasts.
Month
Actual
Forecast
January
42
37
February
58
50
March
58
58
April
77
67.5
May
91
84
June
102
96.5
July
124
113
August
148
136
September
171
159.5
October
177
174
Answer:
15
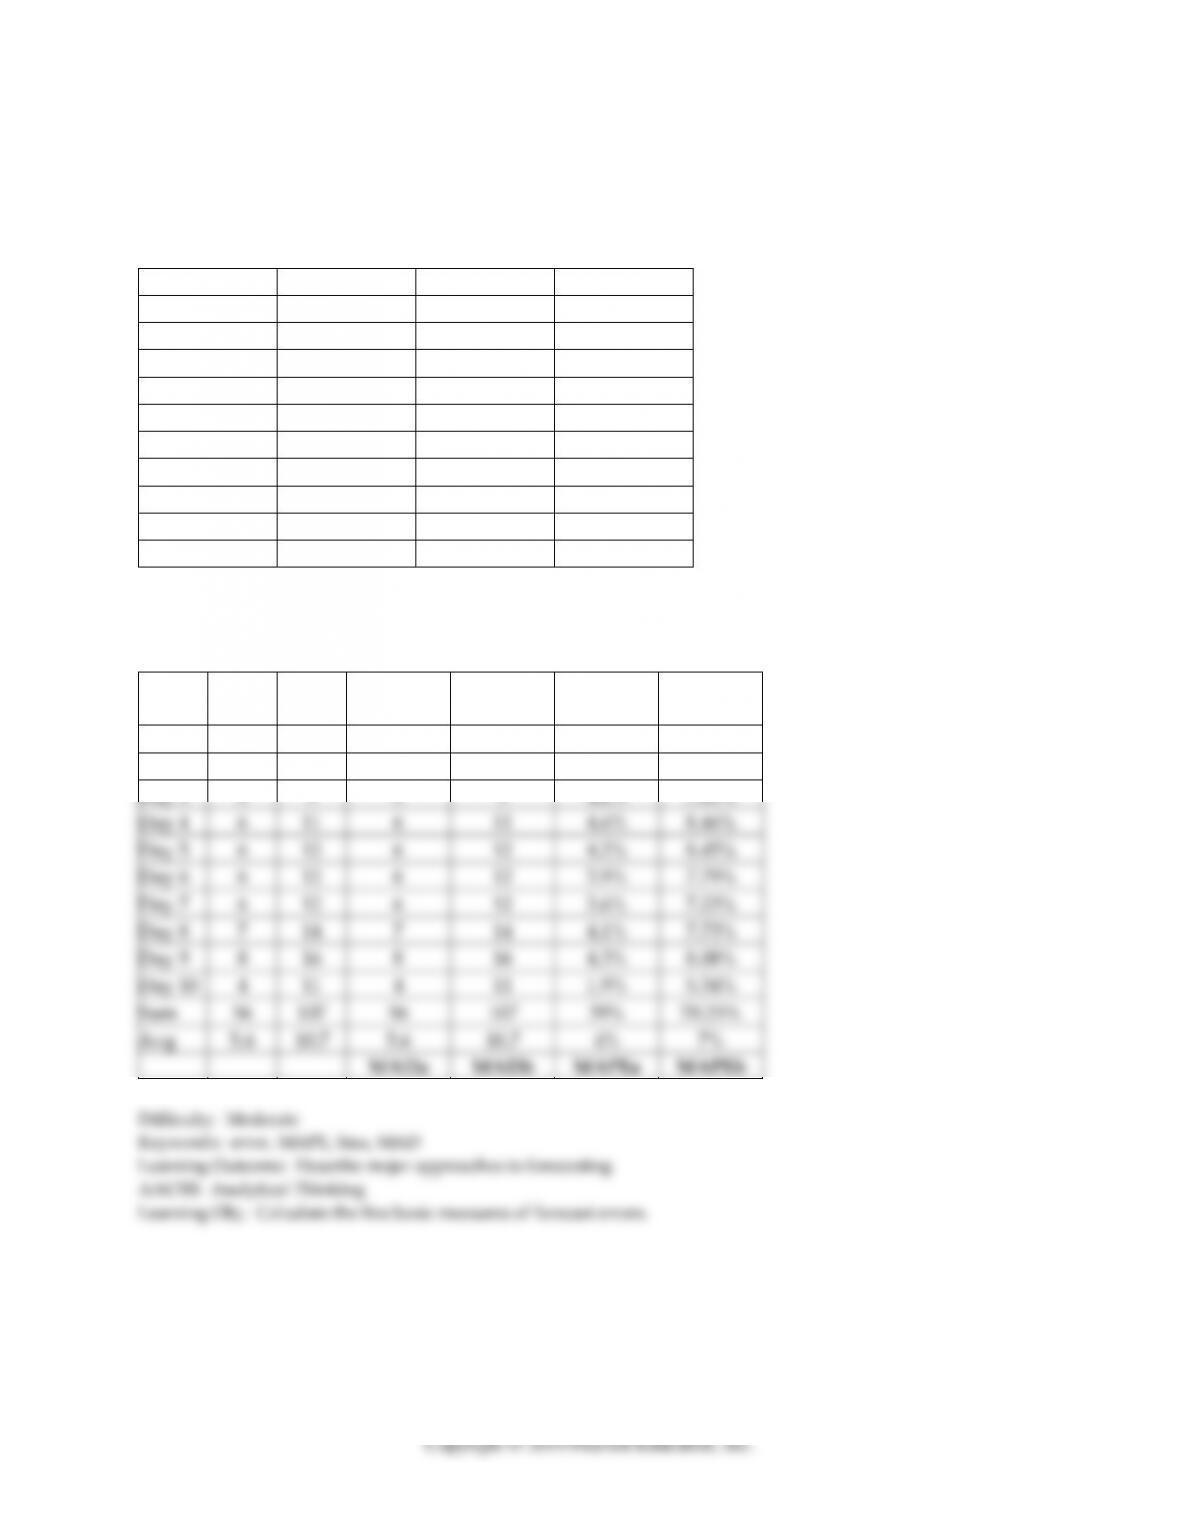
17) Two mercenary forecasters dueled for the lucrative Surreal Farms egg production forecasting job. The
farmer provided them with output levels from ten day’s production and had them forecast the next ten
days. The combatant’s forecasts and the actual egg production are shown in the table. Which forecaster
was more accurate and should be hired as a result of his performance on this trial?
Actual
Forecast A
Forecast B
Day 1
102
97
107
Day 2
108
105
113
Day 3
118
113
109
Day 4
130
124
119
Day 5
142
136
130
Day 6
154
148
142
Day 7
166
160
154
Day 8
181
174
167
Day 9
198
190
182
Day 10
206
202
195
Answer: Based on mean absolute deviation and mean absolute percent error; Forecaster A is more
accurate than Forecaster B.
Period
Error A
Error B
Absolute
Error A
Absolute
Error B
Abs %
Error A
Abs %
Error B
Day 1
5
-5
5
5
4.9%
4.9%
Day 2
3
-5
3
5
2.8%
4.63%
Day 3
5
9
5
9
4.2%
7.63%
Day 4
6
11
6
11
4.6%
8.46%
Day 5
6
12
6
12
4.2%
8.45%
Day 6
6
12
6
12
3.9%
7.79%
Day 7
6
12
6
12
3.6%
7.23%
Day 8
7
14
7
14
4.1%
7.73%
Day 9
8
16
8
16
4.3%
8.08%
Day 10
4
11
4
11
1.9%
5.34%
Sum
56
107
56
107
39%
70.25%
Avg
5.6
10.7
5.6
10.7
4%
7%
MADa
MADb
MAPEa
MAPEb
8.4 Judgment Methods
1) Judgment methods of forecasting are quantitative methods that use historical data on independent
variables to predict demand.
2) Technological forecasting is an application of executive opinion to keep abreast of the latest advances
in technology.
3) Market research is a systematic approach to determine consumer interest by gaining consensus from a
group of experts while maintaining their anonymity.
4) Judgment methods of forecasting should never be used with quantitative forecasting methods.
5) The Delphi method is a process of gaining consensus from a group of experts by face–to-face, non-
anonymous, debate and voting throughout several rounds of group discussion led by a moderator.
6) Using salesforce estimates for forecasting has the advantage that:
A) no biases exist in the forecasts.
B) statistical estimates of seasonal factors are more precise than any other approach.
C) forecasts of individual sales force members can be easily combined to get regional or national sales
totals.
D) confusion between customer “wants” (wish list) and customer “needs” (necessary purchases) is
eliminated.
7) The judgment methods of forecasting are to be used for purposes of:
A) making adjustments to quantitative forecasts due to unusual circumstances.
B) generating data for use in time-series approaches.
C) providing the calculations necessary for quantitative forecasts.
D) calculating the forecast error for quantitative methods.
8) The Delphi method of forecasting is useful when:
A) judgment and opinion are the only bases for making informed projections.
B) a systematic approach to creating and testing hypotheses is needed and the data are usually gathered
by sending a questionnaire to consumers.
C) historical data are available and the relationship between the factor to be forecast and other external or
internal factors can be identified.
D) historical data is available and the best basis for making projections is to use past demand patterns.
9) The manufacturer developed and tested a questionnaire, designed to assist them in gauging the level
of acceptance for their new product, and identified a representative sample as part of their:
A) salesforce estimate.
B) market research.
C) executive opinion.
D) Delphi method.
10) It would be most appropriate to combine a judgment approach to forecasting with a quantitative
approach by:
A) having a group of experts examine each historical data point to determine whether it should be
included in the model.
B) combining opinions about the quantitative models to form one forecasting approach.
C) adjusting a forecast up or down to compensate for specific events not included in the quantitative
technique.
D) developing a trend model to predict the outcomes of judgmental techniques in order to avoid the cost
of employing the experts.
11) The ________ is a process of gaining consensus from a group of experts while maintaining their
anonymity.
12) ________ is a systematic approach to determine consumer interest in a product or service by creating
and testing hypotheses through data-gathering surveys.

13) Which forecasting technique would you consider for technological forecasts?
14) Your team has been asked to develop a forecast for the need for storage in the company’s
communication devices ten years from now. What method would develop the best forecast? Why? How
would you execute this method?
1) The causal method of forecasting uses historical data on independent variables (such as promotional
campaigns and economic conditions) to predict the demand of dependent variables (such as sales
volume).
2) The closer the value of the sample correlation coefficient is to -1.00, the worse the predictive ability of
the independent variable for the dependent variable.
3) A linear regression model results in the equation Y = 15 – 23X. If the coefficient of determination is a
perfect 1.0, the correlation coefficient must be –1.
4) A linear regression model is developed that has a slope of -2.5 and an intercept of 10. The sample
coefficient of determination is 0.50. Which of the following statements is true?
A) The sample correlation coefficient must be 0.250.
B) The sample correlation coefficient must be -0.707.
C) The sample correlation coefficient must be -0.250.
D) The sample correlation coefficient must be 1.00.
5) The number of #2 pencils the bookstore sells appears to be highly correlated with the number of
student credit hours each semester. The bookstore manager wants to create a linear regression model to
assist her in placing an appropriate order. In this scenario:
A) the dependent variable is student credit hours.
B) there are two independent variables.
C) there are two dependent variables.
D) the independent variable is student credit hours.