Unlock document.
This document is partially blurred.
Unlock all pages and 1 million more documents.
Get Access
41
55) Use the data in Table 5.4. What would be the best chart to construct to monitor how consistent the
production process is?
A) p-chart
B) c-chart
C) x-bar chart
D) R-chart
56) If an x-bar chart is constructed using the data in Table 5.4, what conclusion can be reached?
A) The process is in control.
B) The process is out of control.
C) The process is capable.
D) The process is both capable and in control.
57) A hotel tracks the number of complaints per month. When the process is in control, there is an
average of 35 complaints per month. Assume that a 2-sigma control limit is used. What is the lower
control limit?
A) less than or equal to 15
B) more than 15 but less than or equal to 20
C) more than 20 but less than or equal to 25
D) more than 25
42
58) A hotel tracks the number of complaints per month. When the process is in control, there is an
average of 35 complaints per month. Assume that a 2-sigma control limit is used. What is the upper
control limit?
A) less than or equal to 35
B) more than 35 but less than or equal to 45
C) more than 45 but less than or equal to 55
D) more than 55
59) A hotel tracks the number of complaints per month. When the process is in control, there is an
average of 35 complaints per month. Assume that a 2-sigma control limit is used. The next four months
have 33, 27, 29, and 43 complaints. What should management do?
A) Look for assignable causes because the process is in control.
B) Look for assignable causes because the process is out of control.
C) Look for common causes because the process is out of control.
D) Do nothing; the process is in control.
60) ________ of variation are the purely random, unidentifiable sources of variation that are unavoidable
with the current process.
61) ________ of variation include any variation-causing factors that can be identified and eliminated.
43
62) A(n) ________ specifies the sample size, the time between successive samples, and decision rules that
determine when action should be taken.
63) Jerry watched in awe as Warren went to 2 sigma limits from the company-mandated 3 sigma limits,
thereby increasing the likelihood of a type ________ error.
64) The poultry farmer was aghast when the grocery store revealed their new weapon in the war on poor
quality. They planned to use a(n) ________ to monitor the rotten eggs found in the cartons of farm fresh
free range eggs that he supplied. The poultry farmer was well-versed in quality and knew their choice to
be the right one; nevertheless he was upset about this level of scrutiny and what he perceived as a lack of
trust.
65) When is it advantageous to use sampling rather than complete inspection?
44
66) What is the relationship between type I and type II errors and the width of the upper and lower
control limits on SPC charts? Propose a mechanism for determining SPC chart limit widths based upon
the financial consequences of type I and type II errors.
Answer: Type I and type II errors move in opposite directions, that is, as the chance of a type I error
increases, the chance of a type II error decreases. As the width of SPC control limits increases, the chance
of a type I error decreases (and the chance of a type II error increases). The width of control limits might
67) The UCL and LCL for an chart are 100 ounces and 95 ounces, respectively. The sample size is 5. The
inspector looks at the very next unit and finds that it is 108 ounces. What can you conclude? Why?
of statistical control.
68) Discuss the situations under which each of the following charts would be best: chart, p-chart, and c-
chart.
69) Hassan was the company plotter. Give him any data set and he could plot a graph that was not only
accurate, but also aesthetically pleasing. One afternoon he took some attribute data and plotted it as a p-
chart. When Saba, his supervisor, saw the plot he insisted it be discarded and in its place a c-chart should
be constructed. Hassan made the c-chart and noticed that when he placed the two charts one on top of the
other, the lines created by the data points were exactly the same shape. Has our plotting colleague made a
70) How does SPC help companies implement continuous improvement programs?
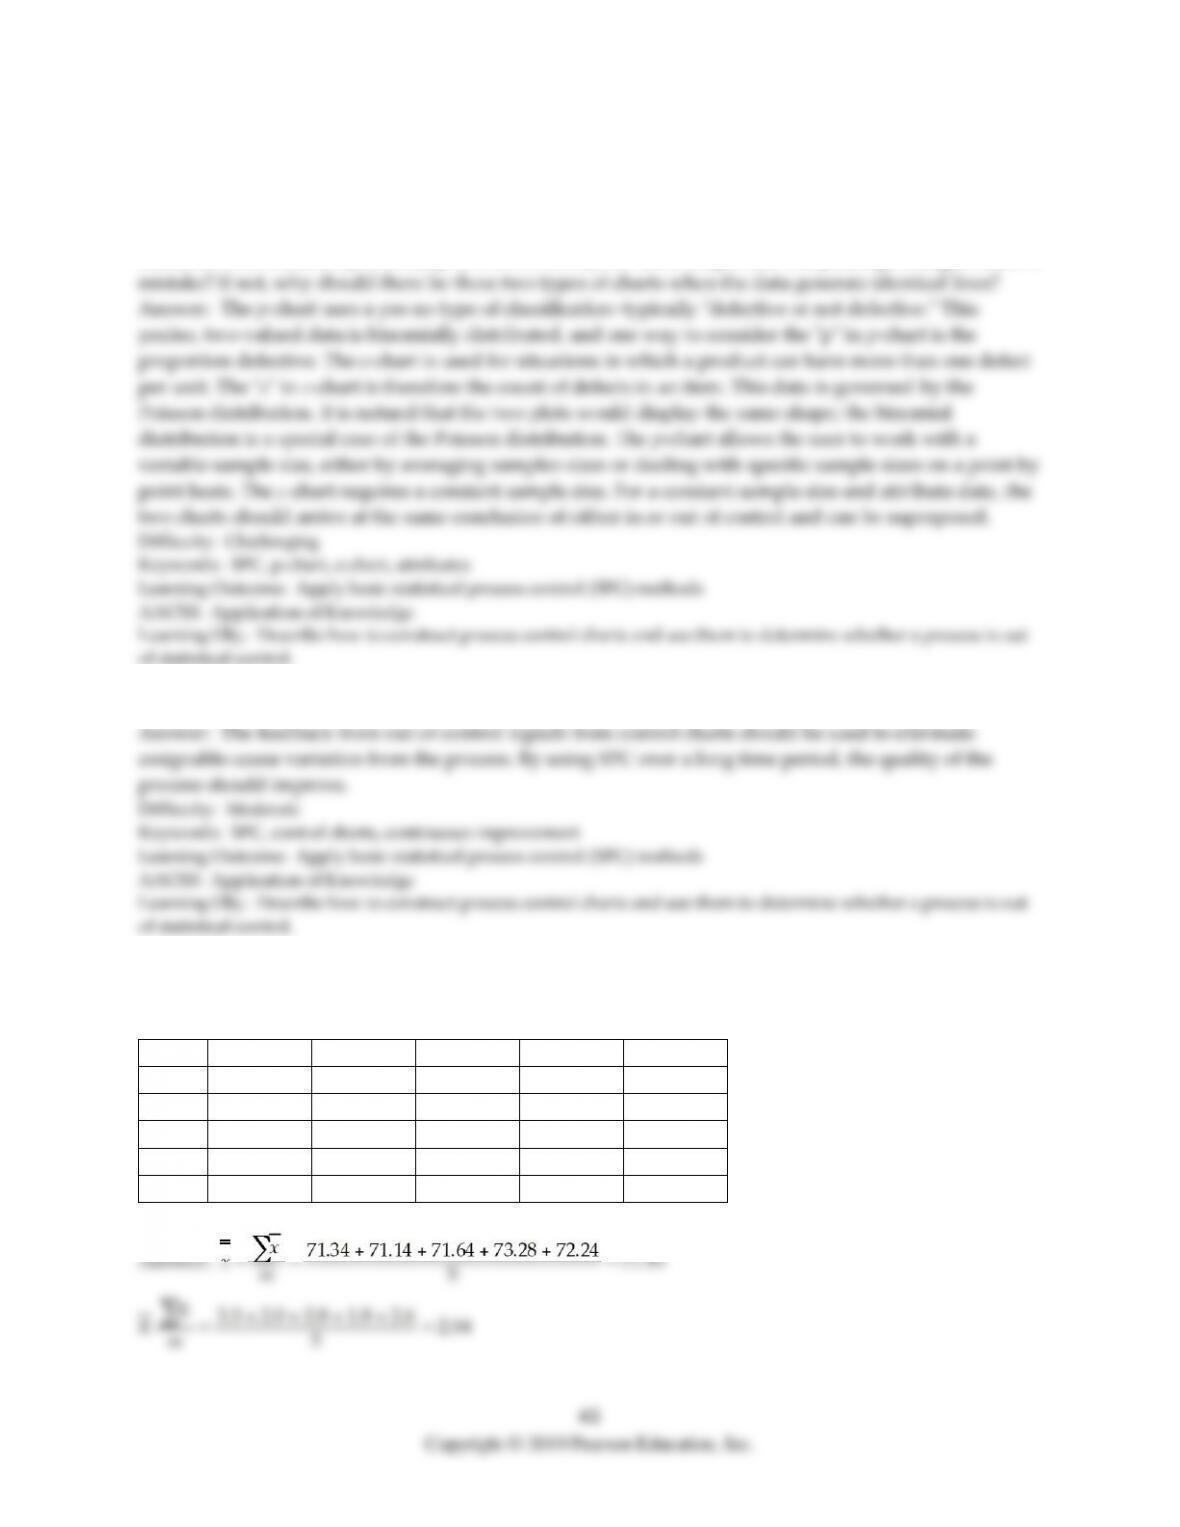
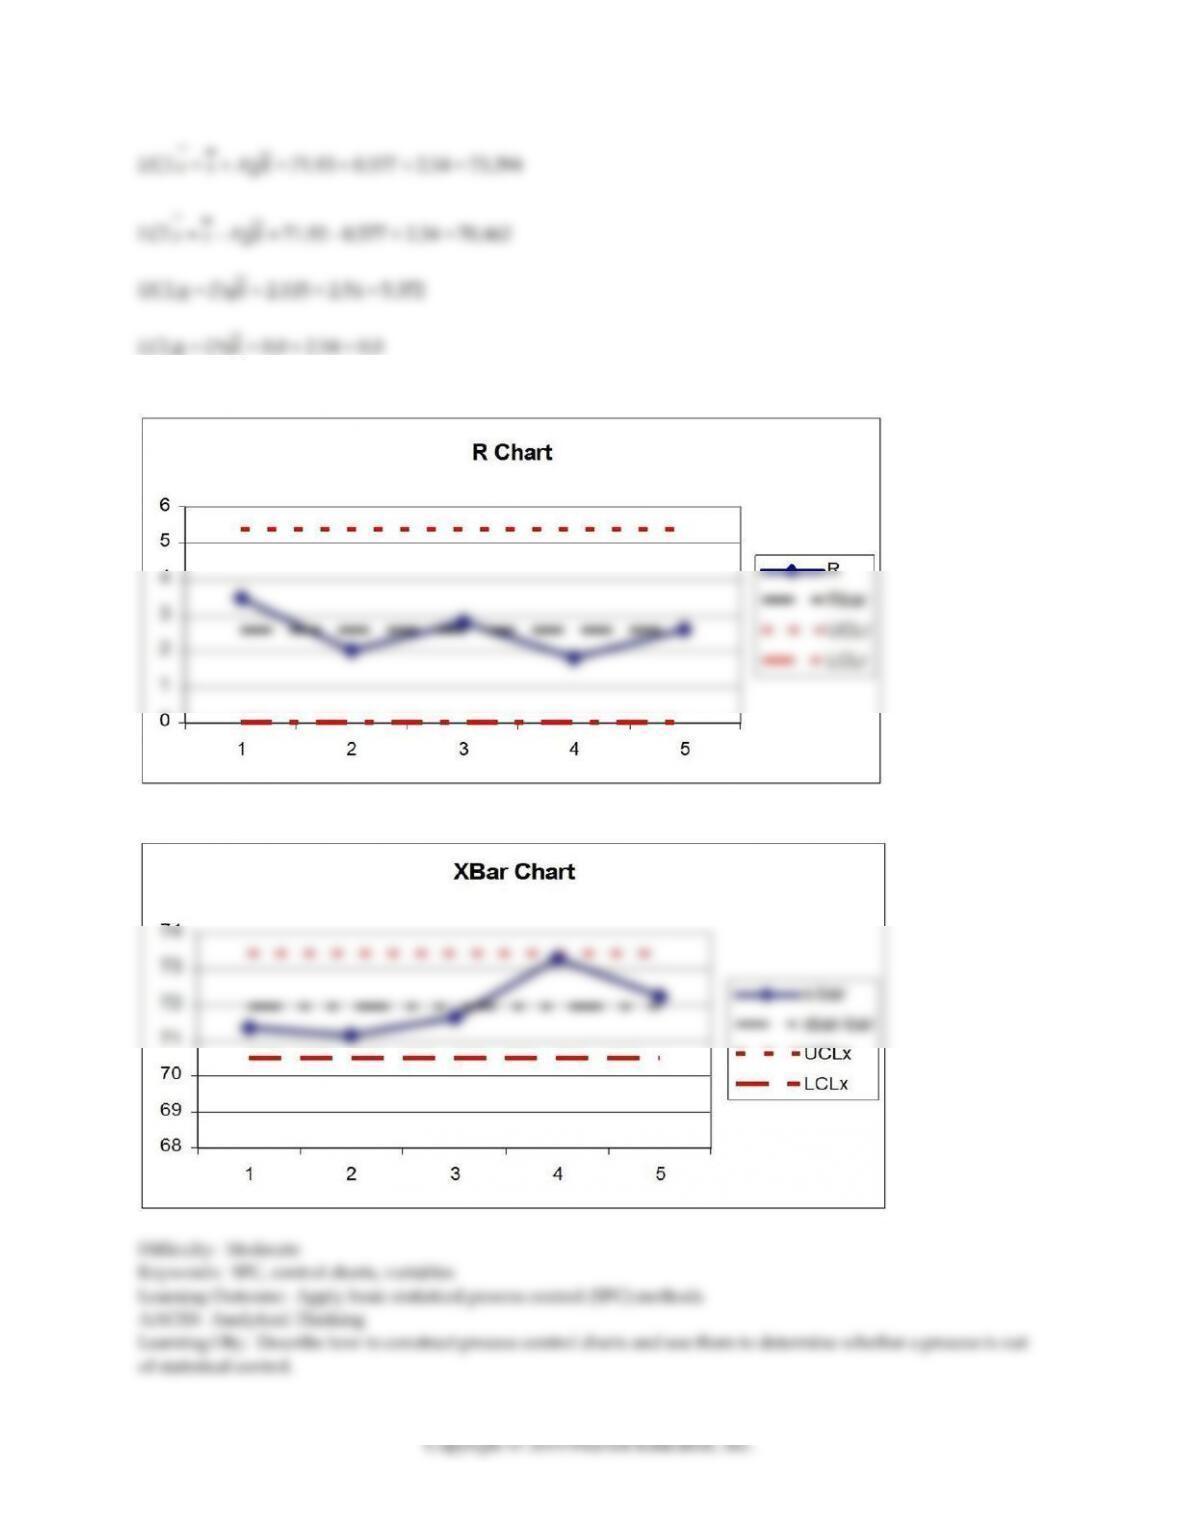
71) Thermostats are subjected to rigorous testing before they are shipped to air conditioning technicians
around the world. Results from the last five samples are shown in the table. Is the process under control?
Unit #
Sample 1
Sample 2
Sample 3
Sample 4
Sample 5
1
73.5
70.8
72.2
73.6
71.0
2
71.3
71.0
73.1
72.7
72.2
3
70.0
72.6
71.9
72.4
73.3
4
71.1
70.6
70.3
74.2
73.6
5
70.8
70.7
70.7
73.5
71.1
46
Copyright © 2019 Pearson Education, Inc.
UCL = + A2 = 71.93 + 0.577 × 2.54 = 73.394
LCL = - A2 = 71.93 - 0.577 × 2.54 = 70.462
UCLR = D4 = 2.115 × 2.54 = 5.372
LCLR = D3 = 0.0 × 2.54 = 0.0
R-chart is in control
x-bar chart is in control
47
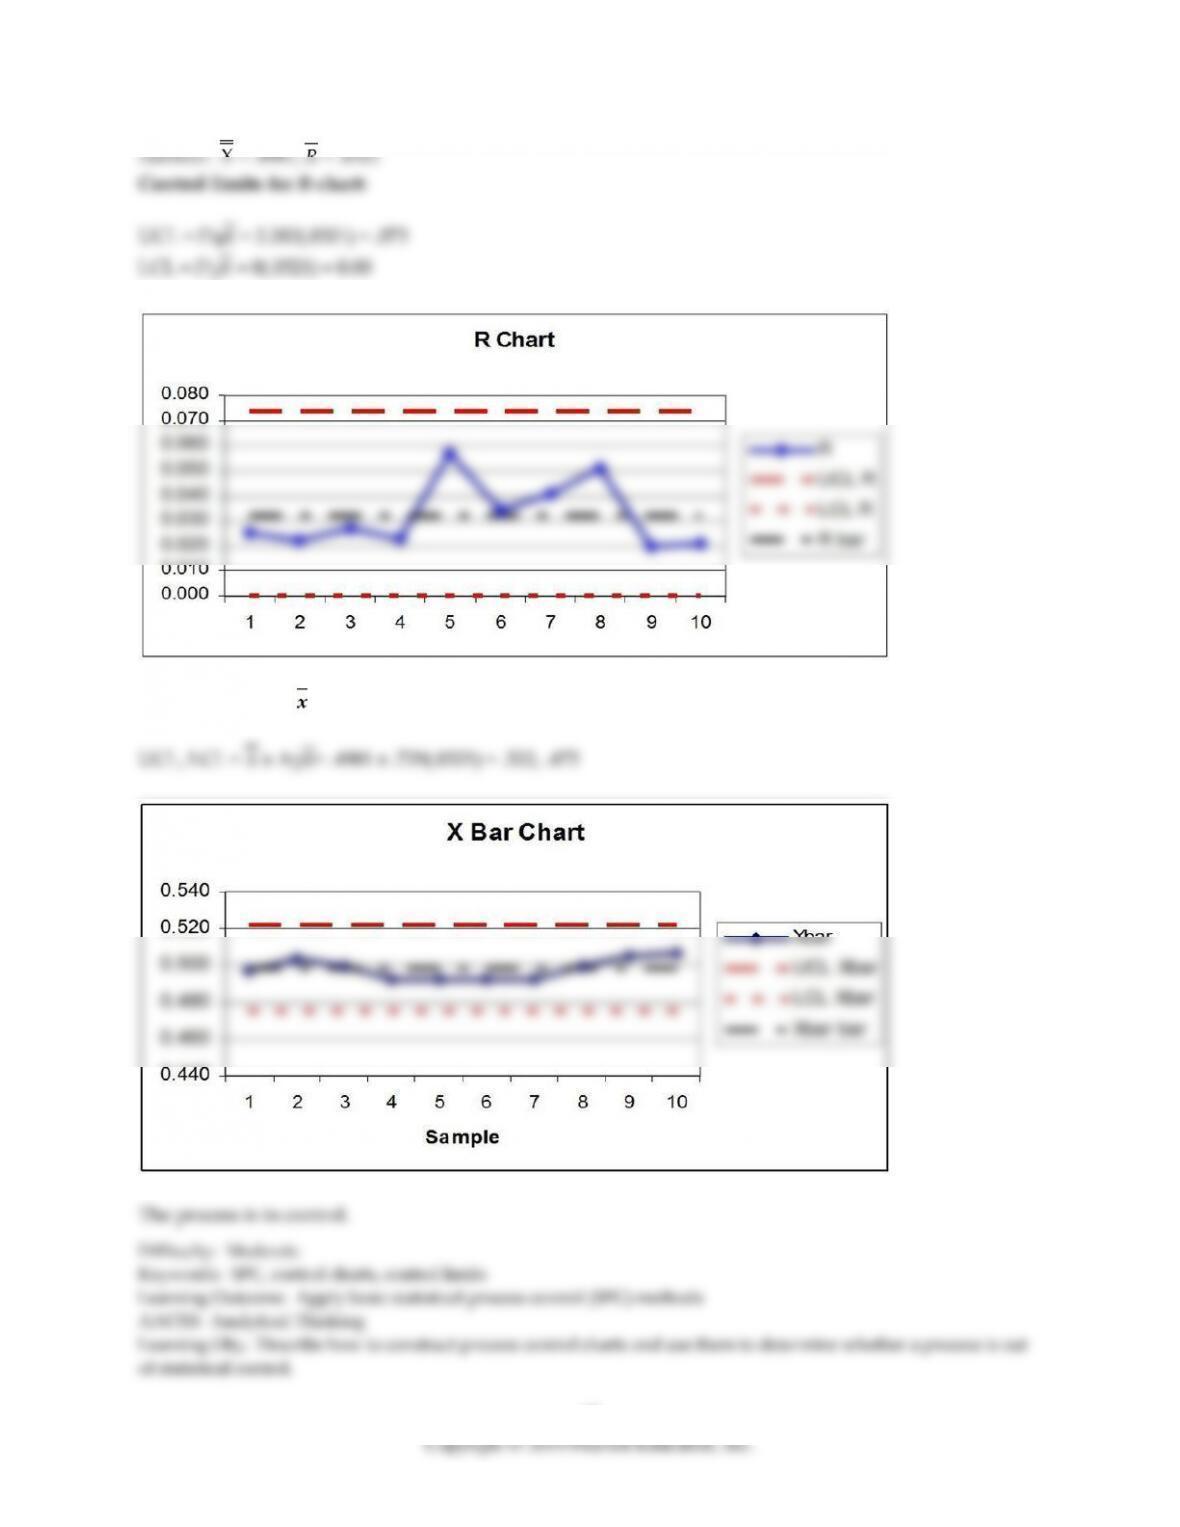
72) Construct a 3-sigma and R-chart for the length in centimeters of a part from the following table.
Sample #
Observation 1
Observation 2
Observation 3
Observation 4
1
0.486
0.499
0.493
0.511
2
0.499
0.506
0.516
0.494
3
0.496
0.5
0.515
0.488
4
0.495
0.506
0.483
0.487
5
0.472
0.502
0.526
0.469
6
0.473
0.495
0.507
0.493
7
0.495
0.512
0.49
0.471
8
0.525
0.501
0.498
0.474
9
0.497
0.501
0.517
0.506
10
0.495
0.505
0.516
0.511
48
Copyright © 2019 Pearson Education, Inc.
Answer: = .4981, = .0321
Control limits for R-chart:
UCL = D4 = 2.282(.0321) = .073
LCL = D3 = 0(.0321) = 0.00
Control limits for chart:
49
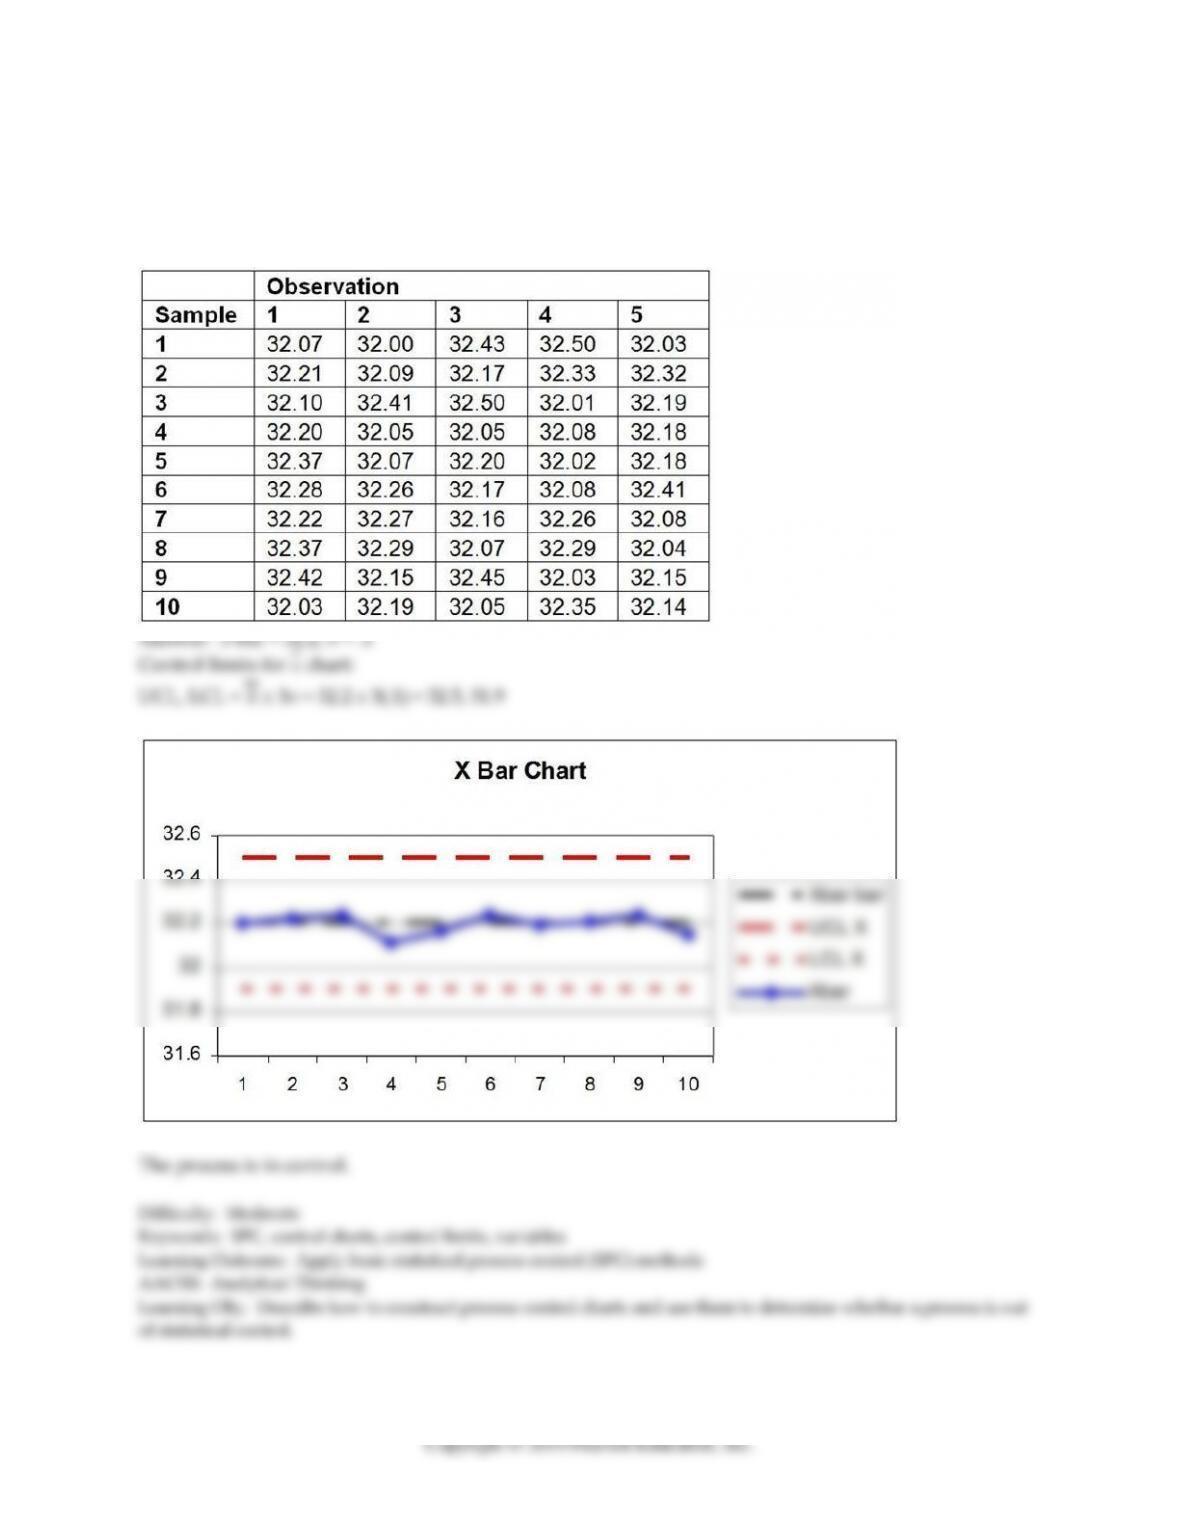
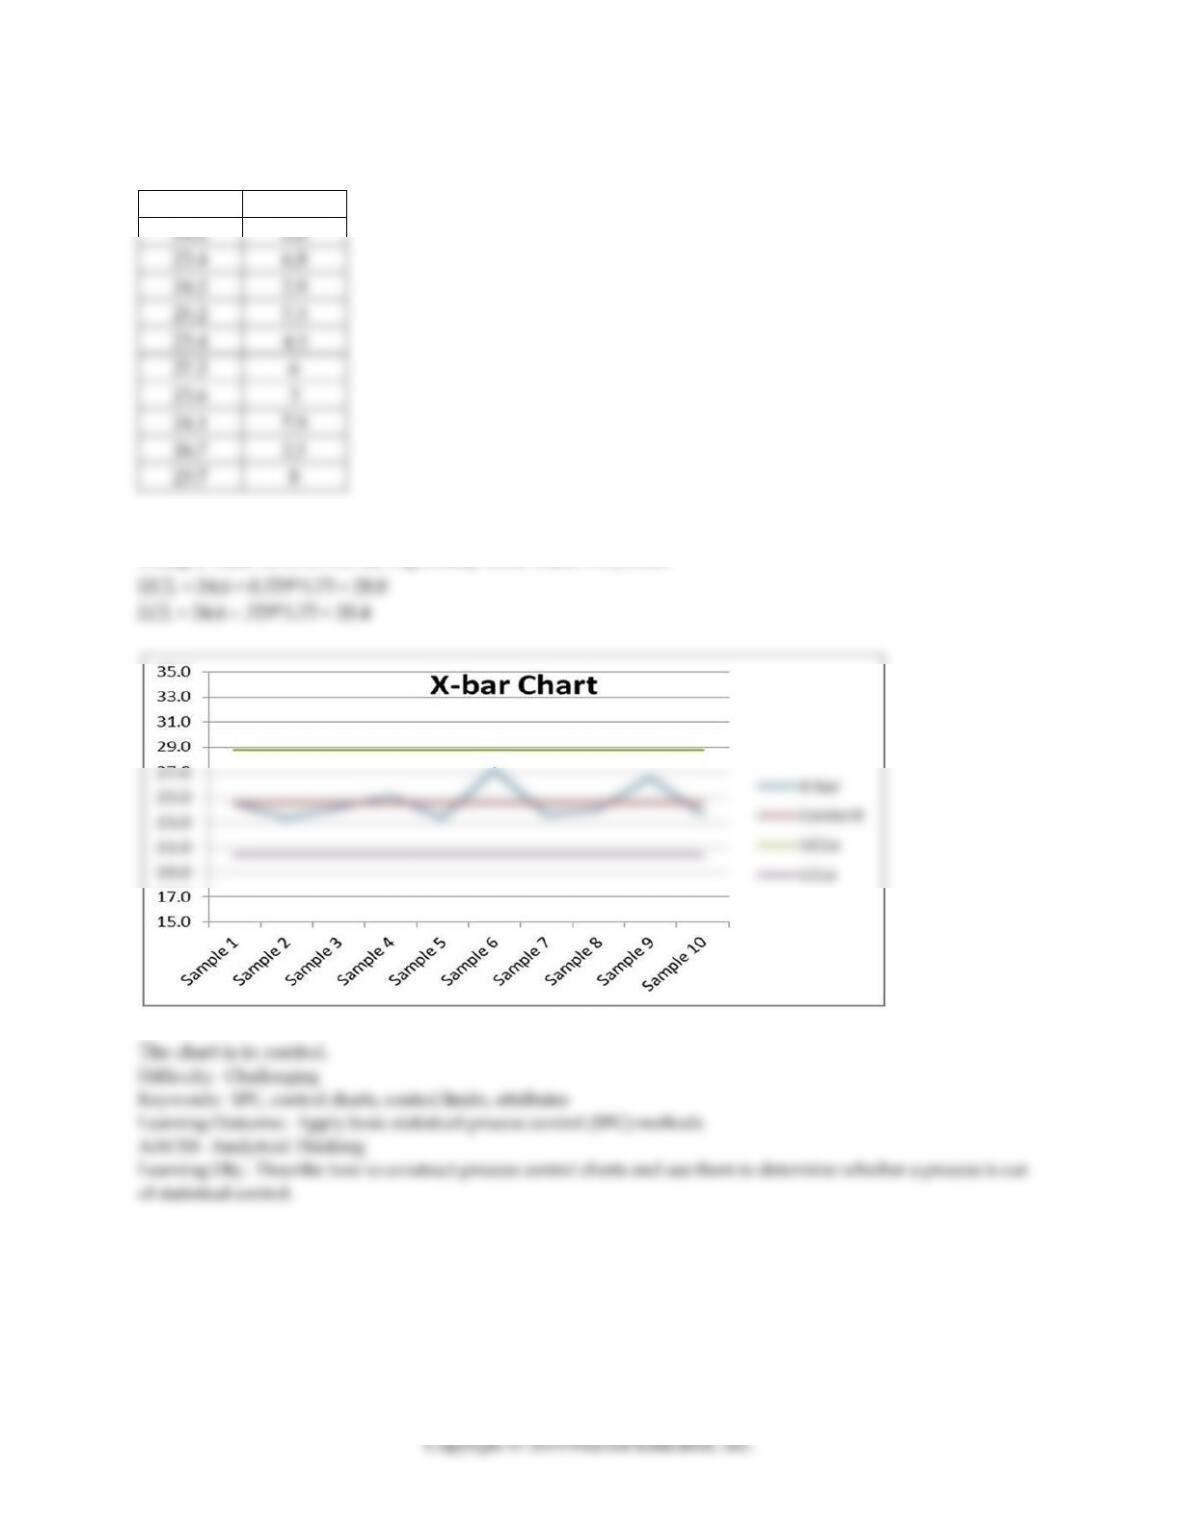
73) The management of a line that fills cereal boxes wants the box filled at 32.2 ounces. When the process
is in control, the standard deviation is .1 ounces.
a. Construct the upper and lower control limits for a 3-sigma x-bar chart using a sample size of five.
b. The results from the last 10 samples follow. Is the process in control?
50
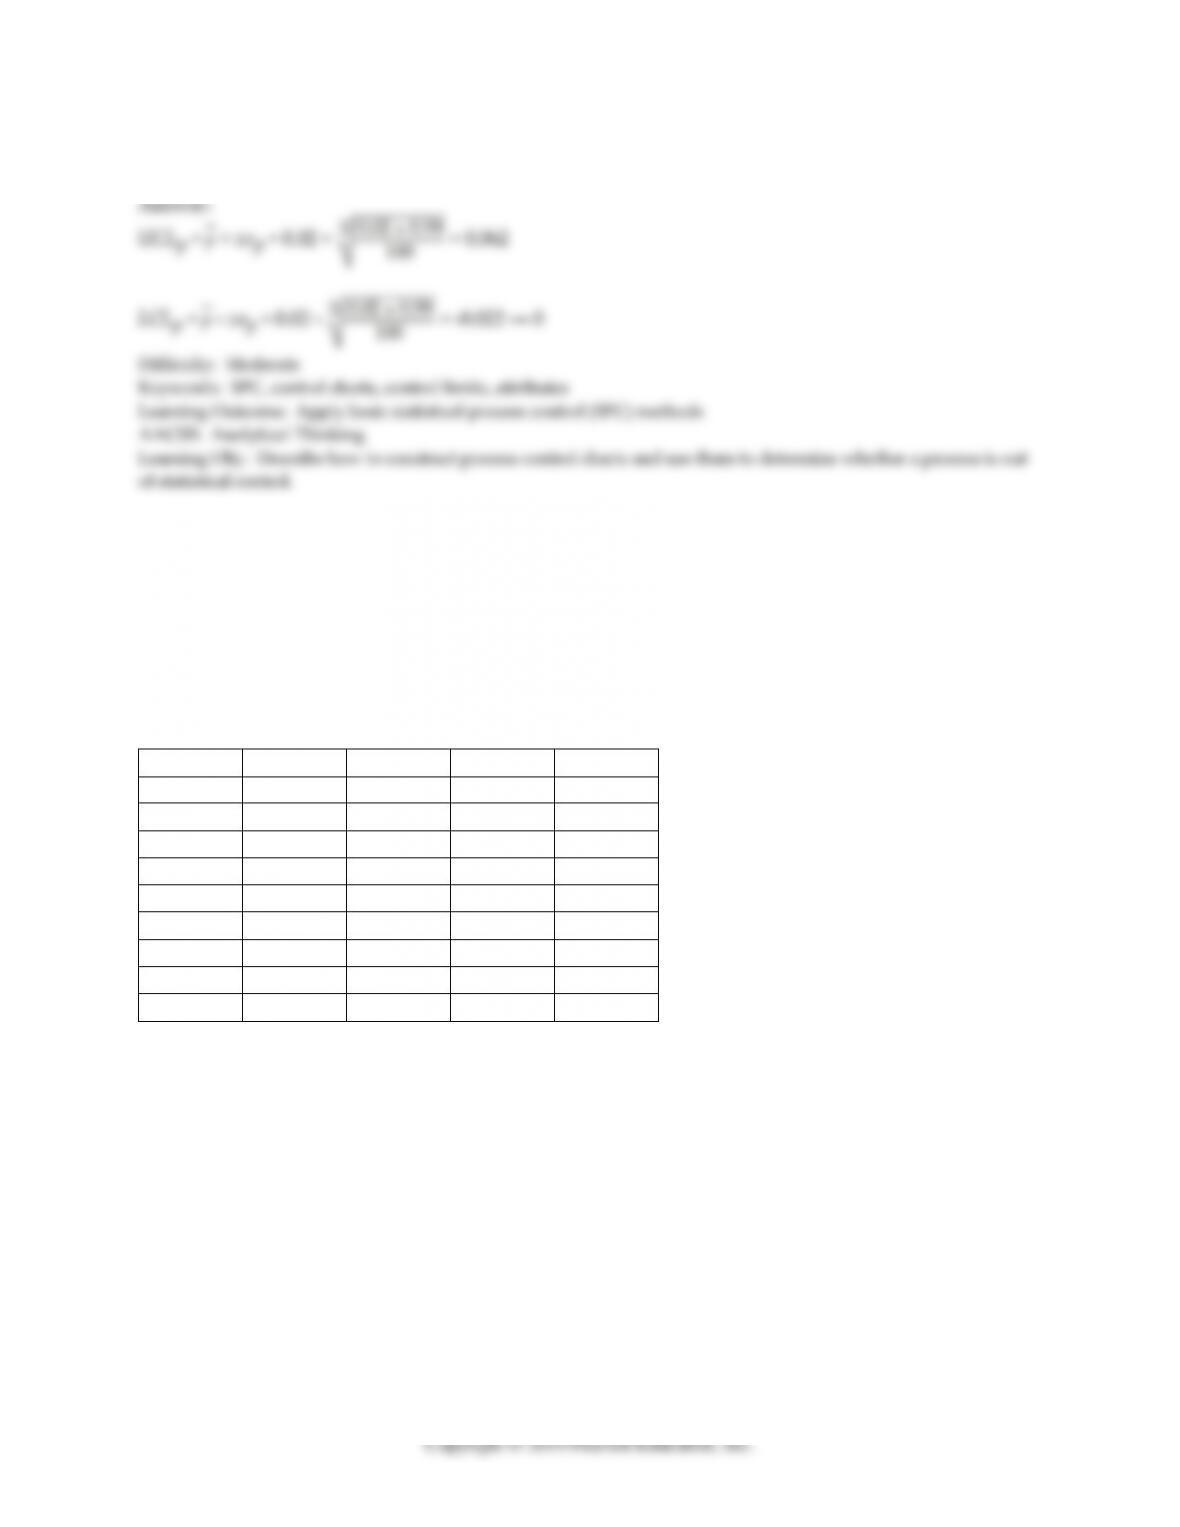
74) The defect rate for a product has historically been about 2.0%. What are the upper and lower control
chart limits if you wish to use a sample size of 100 and 3-sigma limits?
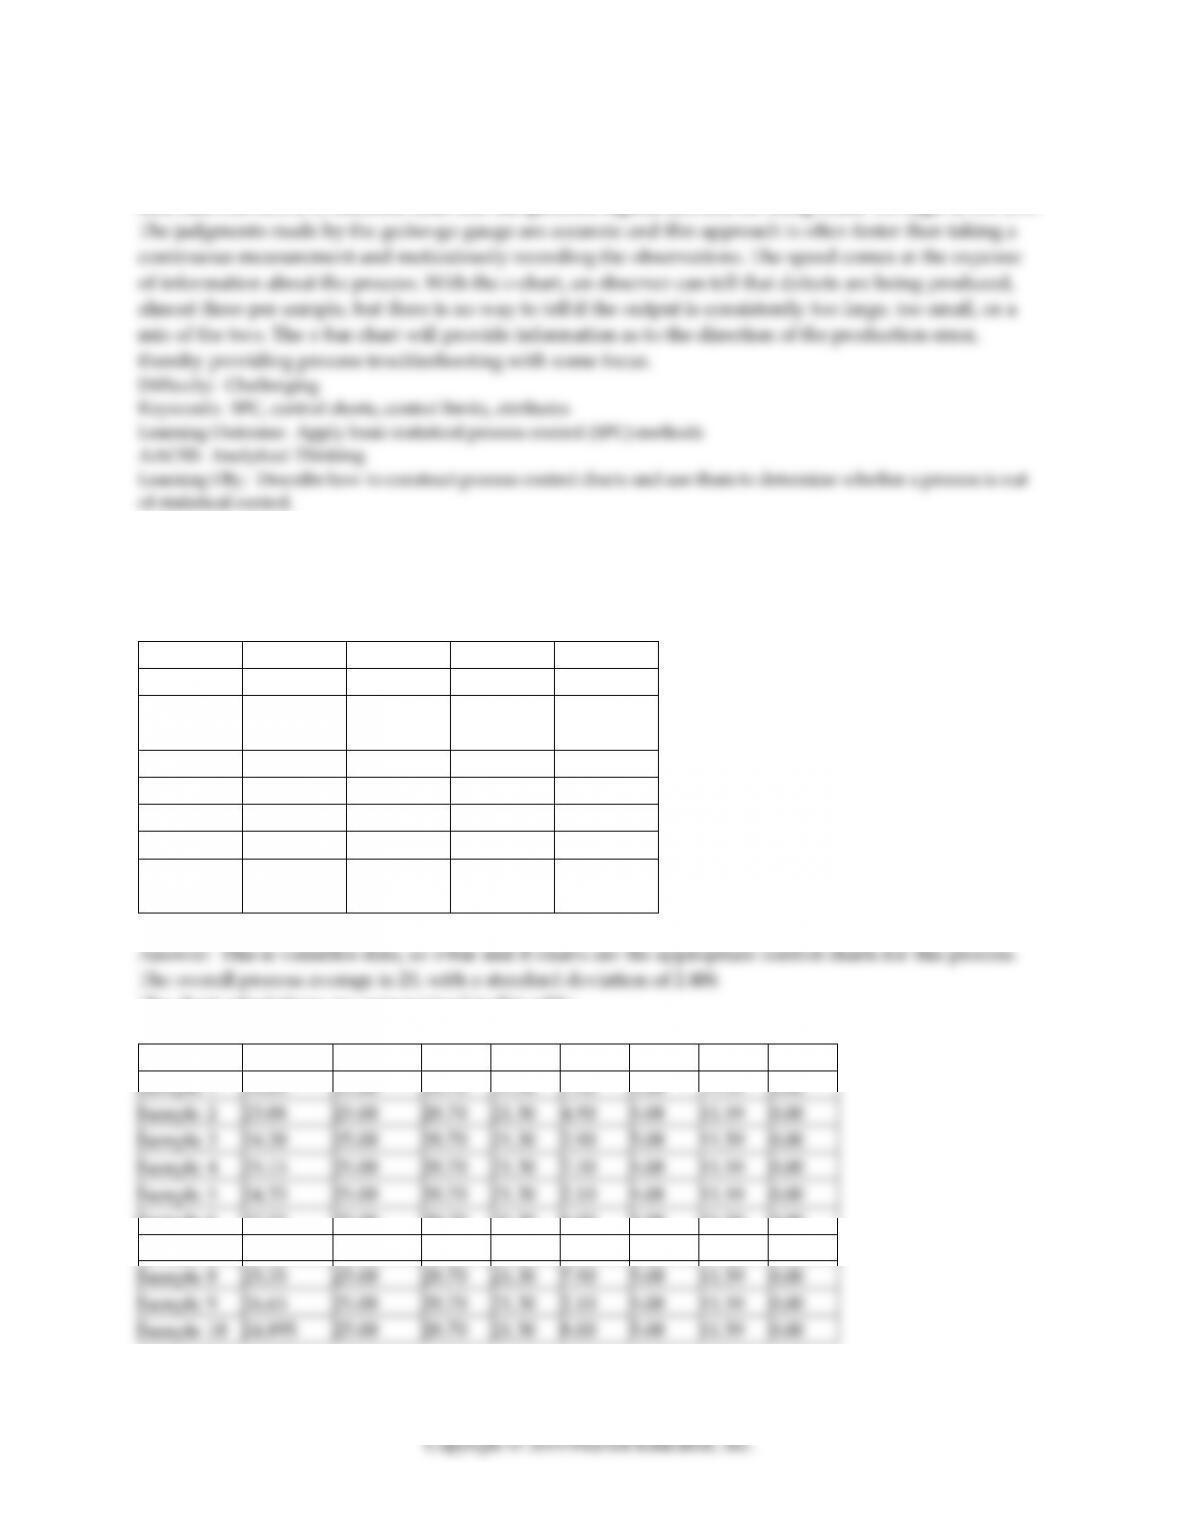
75) The quality control technician grew weary of measuring pistons that came off the line, so he decided
to make a fixture that would tell him whether the piston fell within product specifications. The fixture
had two holes, one the exact width of the upper specification (24 cm) and one slightly smaller than the
lower specification (21 cm). If the piston fit through the smaller hole, it would be too small and therefore
rejected. If the piston didn't fit through the larger hole, it was too large and would be rejected. Just to test
his idea, he used the traditional measurement system and his new system on the next eight samples. The
data and the two charts he constructed are shown below. Why aren't the plotted points forming similar
shapes between the two graphs? Evaluate the advantages and disadvantages of his proposed system.
Sample 1
29.5
23
20.9
24.9
Sample 2
22.9
20.1
23.7
26.9
Sample 3
25.9
23.6
23
24.3
Sample 4
25.3
23.2
29.8
22.3
Sample 5
24.7
25.1
20.6
23
Sample 6
28.4
29.7
27.1
23.7
Sample 7
21.9
23.5
24.9
24.2
Sample 8
26.9
21.1
28.1
20.2
Sample 9
25.5
27.6
26.3
27.2
Sample 10
23.9
28.6
21.7
20.6
51
52
Answer: The points don't form similar shapes due to the nature of the data generating functions. The x-
bar chart is from a process that creates a continuous random variable stream. The c-chart takes the same
data and converts it to attribute data that can generate signals (errors) for being either too high or too low.
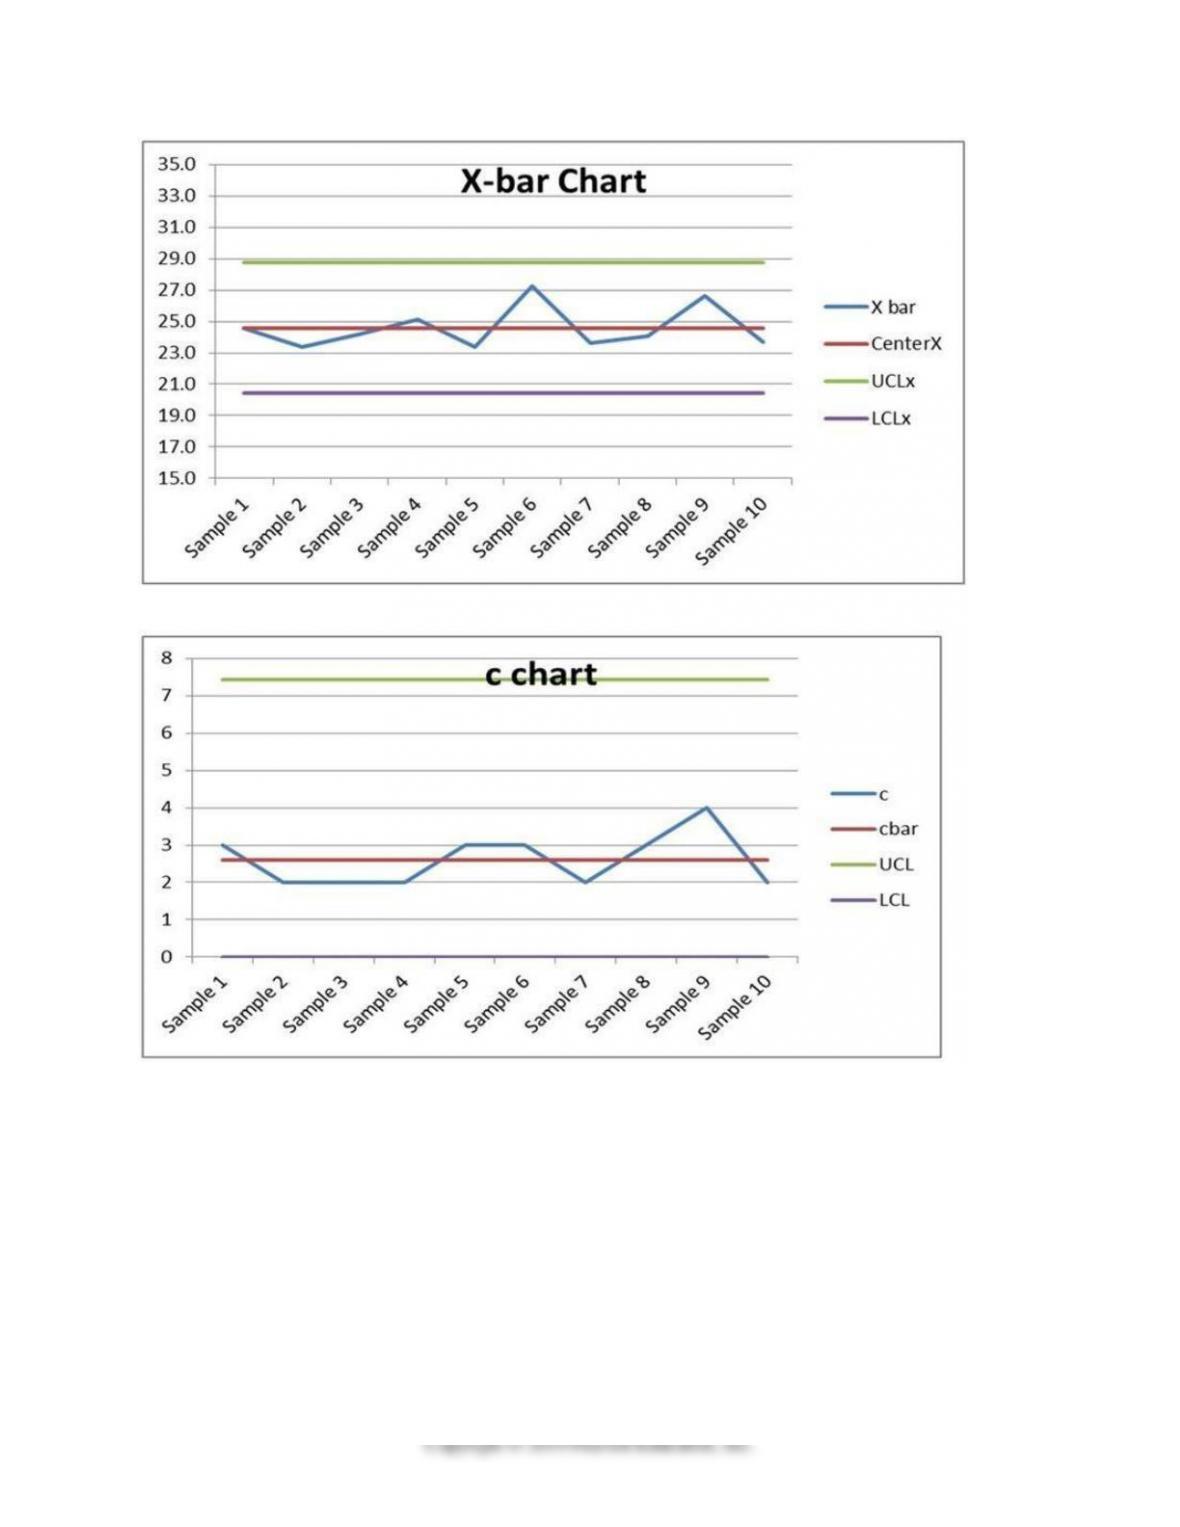
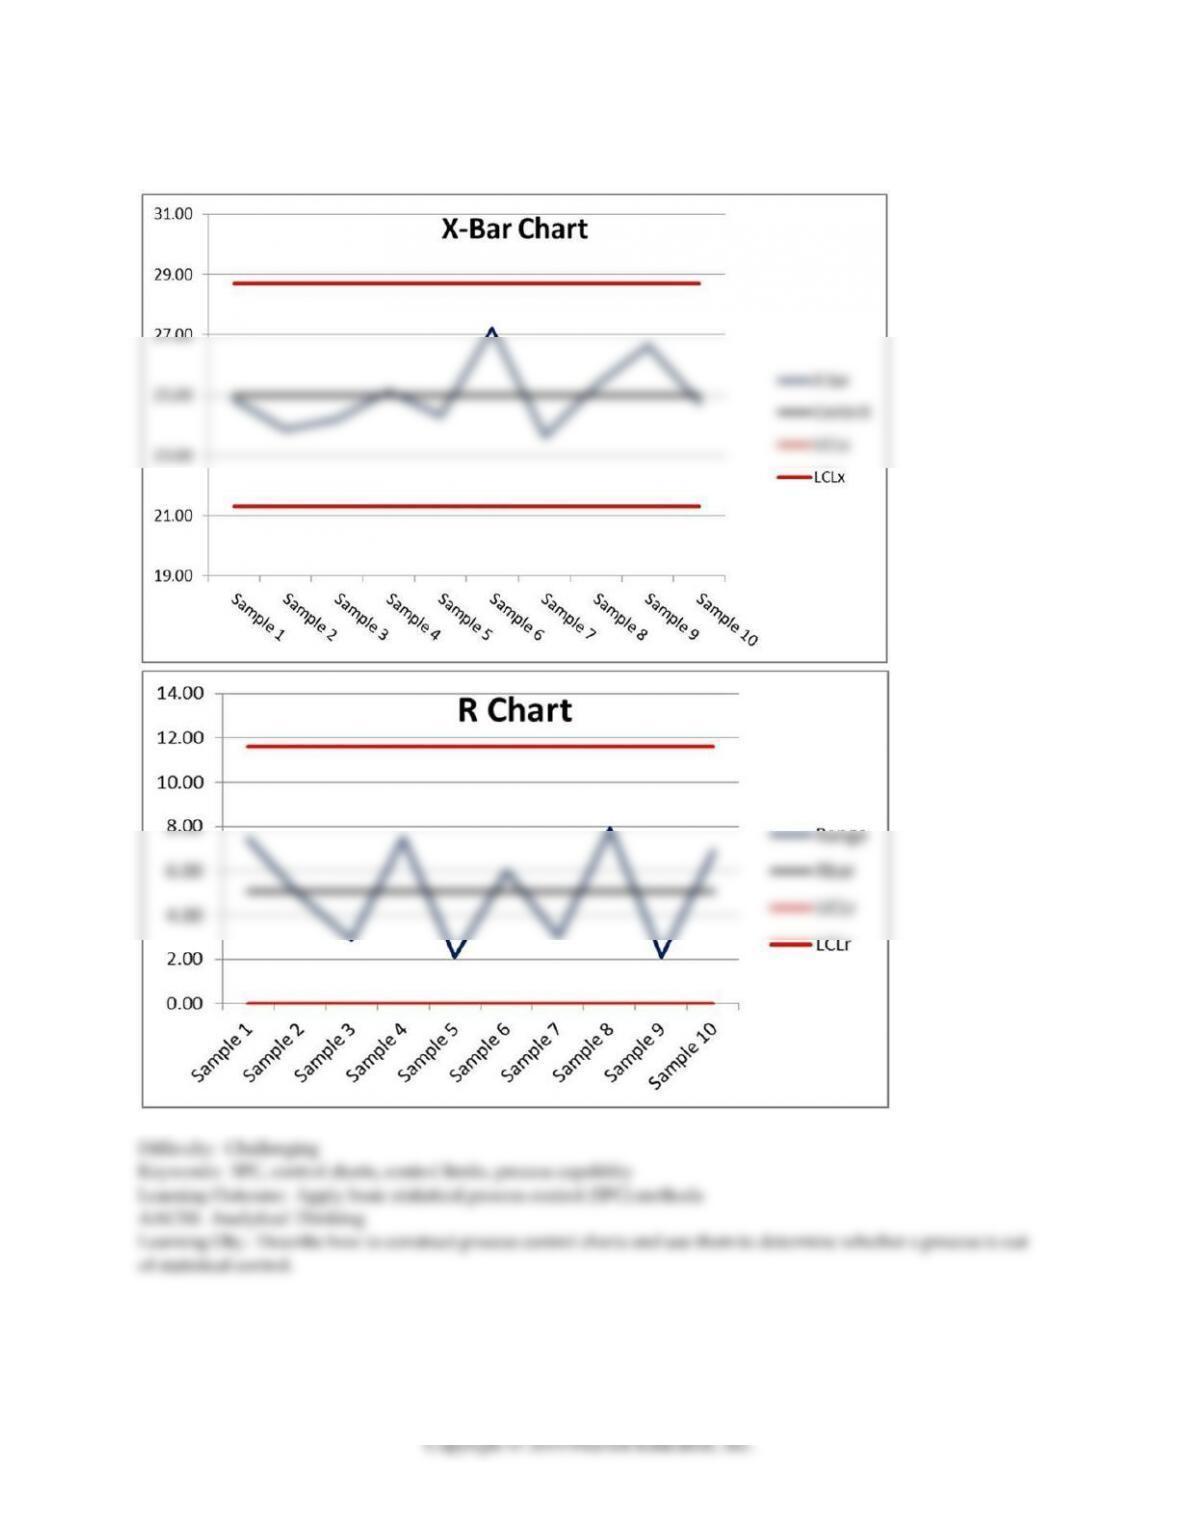
76) Samples of size 4 were taken from a process that had a target of 25 ounces with upper and lower
specification limits of 30 ounces and 20 ounces respectively. Create the appropriate control charts and
determine whether the process is in control.
Sample 1
29.5
23.0
22.0
24.9
Sample 2
22.9
22
23.7
26.9
Sample 3
25.9
23.6
23.0
24.3
Sample 4
25.3
23.2
29.8
22.3
Sample 5
24.7
25.1
24.5
23.0
Sample 6
28.4
29.7
27.1
23.7
Sample 7
21.9
23.5
24.9
24.2
Sample 8
26.9
26.2
28.1
20.2
Sample 9
25.5
27.6
26.3
27.2
Sample 10
23.9
28.6
21.7
20.6
The chart calculations are summarized in this table:
X bar
CenterX
UCLx
LCLx
Range
Rbar
UCLr
LCLr
Sample 1
24.85
25.00
28.70
21.30
7.50
5.08
11.59
0.00
Sample 2
23.88
25.00
28.70
21.30
4.90
5.08
11.59
0.00
Sample 3
24.20
25.00
28.70
21.30
2.90
5.08
11.59
0.00
Sample 4
25.15
25.00
28.70
21.30
7.50
5.08
11.59
0.00
Sample 5
24.33
25.00
28.70
21.30
2.10
5.08
11.59
0.00
Sample 6
27.23
25.00
28.70
21.30
6.00
5.08
11.59
0.00
Sample 7
23.63
25.00
28.70
21.30
3.00
5.08
11.59
0.00
Sample 8
25.35
25.00
28.70
21.30
7.90
5.08
11.59
0.00
Sample 9
26.65
25.00
28.70
21.30
2.10
5.08
11.59
0.00
Sample 10
24.895
25.00
28.70
21.30
8.00
5.08
11.59
0.00
53
Both charts reflect a process that is in control.

54
77) A process with a target of 25 was used to generate the following data points. Is the process properly
centered?
Sample 1
29.5
23
20.9
24.9
Sample 2
22.9
20.1
23.7
26.9
Sample 3
25.9
23.6
23
24.3
Sample 4
25.3
23.2
29.8
22.3
Sample 5
24.7
25.1
20.6
23
Sample 6
28.4
29.7
27.1
23.7
Sample 7
21.9
23.5
24.9
24.2
Sample 8
26.9
21.1
28.1
20.2
Sample 9
25.5
27.6
26.3
27.2
Sample 10
23.9
28.6
21.7
20.6
55
Answer: The sample means and ranges are contained in this table
X bar
Range
24.6
8.6
23.4
6.8
24.2
2.9
25.2
7.5
23.4
4.5
27.2
6
23.6
3
24.1
7.9
26.7
2.1
23.7
8
The overall average is 24.6, and the average range is 5.73., so the process is not centered.
Using a value of 0.729 for the A2 lookup from Table 5.1 yields:
56
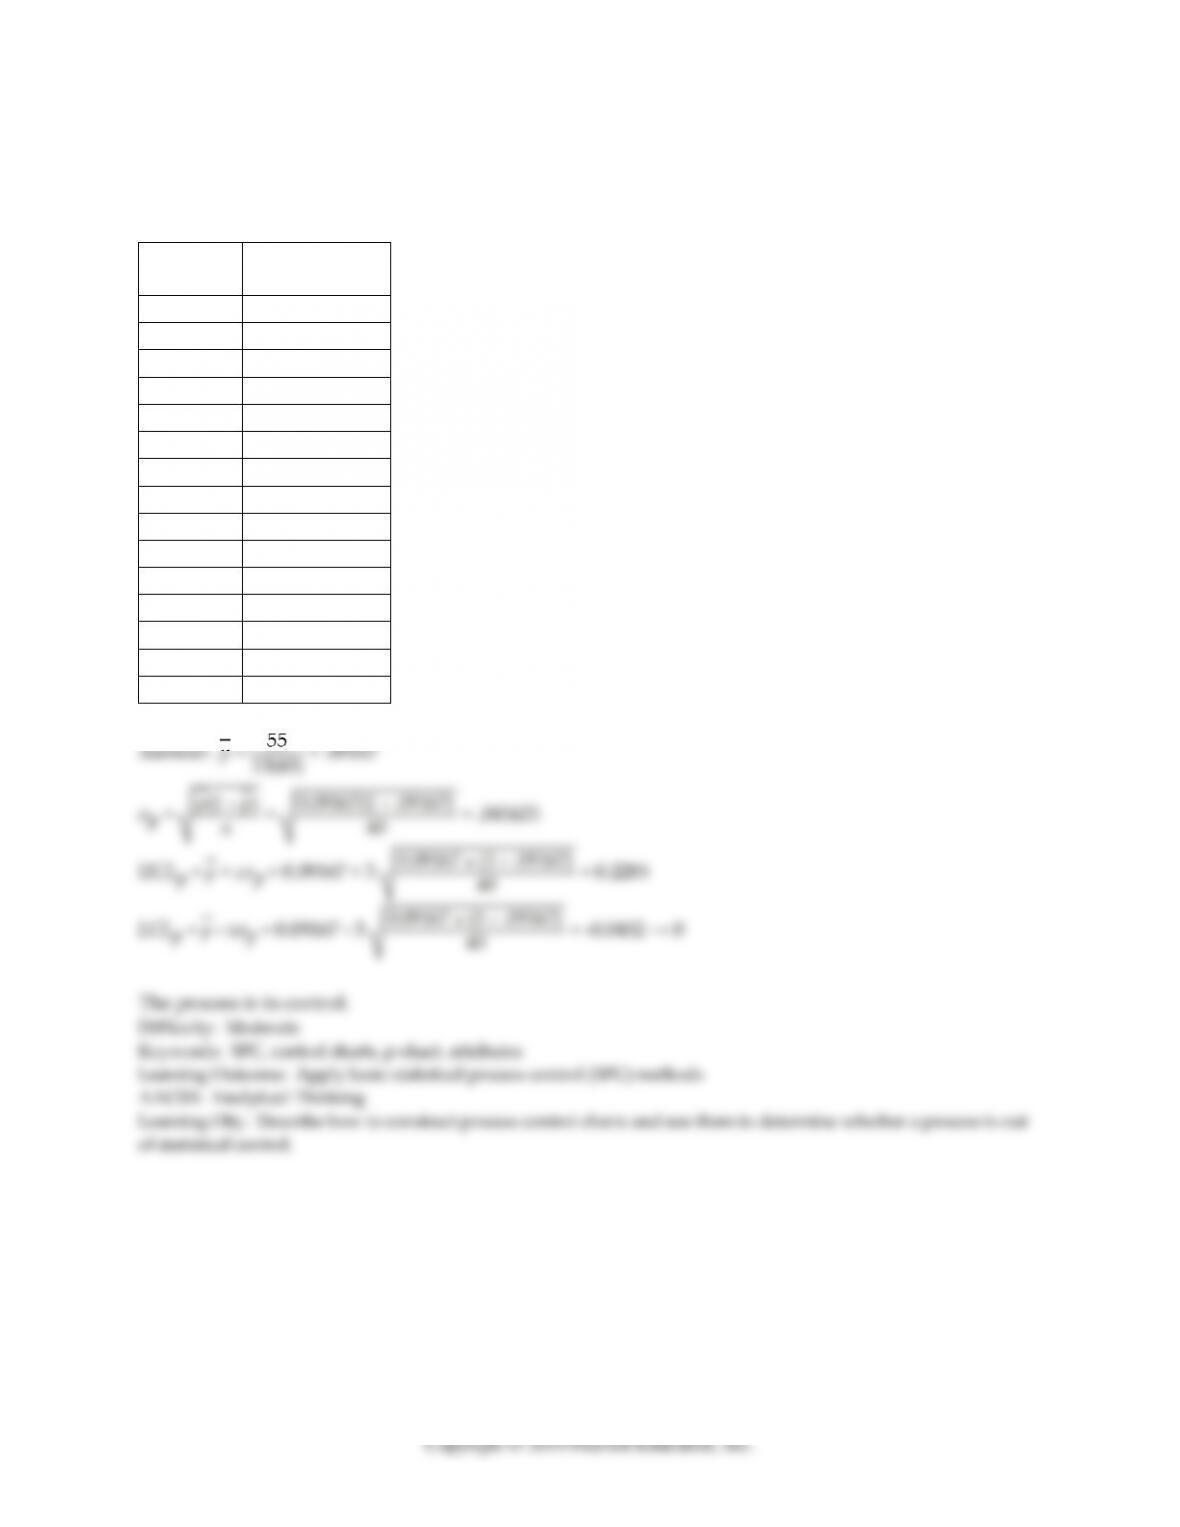
78) A professor records the number of students who complain each week throughout the semester. If the
class size is forty students, what are 3-sigma control limits for this class? Construct a control chart and
interpret the data.
Week
number
Complaints
1
5
2
2
3
7
4
1
5
3
6
2
7
8
8
1
9
3
10
5
11
4
12
6
13
3
14
1
15
4


