TEST QUESTIONS & PROBLEMS – CHAPTER #11
Short Answer Questions
1. Identify the difference between hydrology and hydraulics.
2. (T or F) Hydraulics is a science dealing with the properties, distribution, and circulation of
the earth’s water.
3. All of the following are primarily transport phases (rather than storage phases) of the
hydrologic cycle except:
a) precipitation b) interception c) rivers d) evaporation e) surface runoff
1. Define interception.
2. All of the following are primarily storage phases (as opposed to transport phases) of the
hydrologic cycle except:
a) evaporation b) interception c) oceans d) aquifer e) depression storage
1. What happens to precipitation that is infiltrated?
2. The two phases of the hydrologic cycle that are easiest to quantify are:
a) evaporation b) interception c) precipitation d) infiltration e) runoff
1. Define transpiration.
2. (T or F) Because the continuous simulation approach for generating a design runoff is time-
consuming and costly, the single-event design-storm method is widely used in the practice.
3. Two fundamentally different approaches are used to generate the design runoff from rainfall
when runoff records are unavailable. Which of the following are the two approaches used?
a) statistical b) single event c) measurement d) continuous simulation e) rainfall-runoff
101

1. (T or F) Other terms used for a watershed include catchment and drainage basin.
2. Define watershed.
3. (T or F) Watershed boundaries on topographic maps will pass through contour lines in a
perpendicular fashion.
4. Identify four of the five components of a design storm.
5. A design storm is characterized in terms of:
a) return period b) total rainfall depth or average rainfall intensity c) storm duration
a) time distribution of rainfall e) spatial distribution of rainfall e) all of the above
1. What is the probability of a 20-year storm event being equaled or exceeded next year?
2. Define the term “return period.”
3. Hyetographs are plots of time vs.:
a) streamflow b) rainfall c) infiltration d) runoff e) rainfall intensity
1. A 10-yr, 30-minute storm has a rainfall intensity of 3.4 in./hr. What rainfall depth is produced?
2. Identify two factors that impact the selection of the design return period (i.e., 2-yr, 5-yr, 10-
yr, etc.) when designing urban hydraulic structures. .
3. Which of the following hydraulic structures are sized to accommodate a peak volume?
a) storm sewers b) culverts c) detention basins d) street gutters e) street inlets
4. Which of the following hydraulic structures are sized to accommodate a peak flow?
a) storm sewers b) culverts c) street gutters d) street inlets e) all of these structures
5. (T or F) The Soil Conservation Service (SCS) presented five dimensionless rainfall
distributions for different regions of the United States.
102
6. (T or F) The SCS dimensionless rainfall distributions are for 24-hour storms. However,
shorter and more intense rainfalls are nested within the
24-hr
duration, and therefore these
distributions are appropriate for both small and large watersheds.
7. Define the term interception.
8. (T or F) Rainfall excess or effective rainfall is the part of rainfall that becomes runoff and is
calculated as the total rainfall minus abstractions.
9. Identify three types of abstractions or losses from rainfall that do not produce runoff.
10. Define the term surface depression storage.
11. Which of the following abstractions is the dominant mechanism through which losses
from rainfall occurs.
a) infiltration b) evaporation c) interception d) surface depression e) transpiration
12. (T or F) The actual rate of infiltration is always equal to the infiltration capacity of
the soil.
13. (T or F) For the Green and Ampt model, it is assumed that the soil has a uniform
degree of saturation (i.e., the fraction of the pore volume containing water) when rainfall
begins.
14. Which two watershed characteristics are required to determine the SCS curve number (CN)?
a) hydraulic length b) slope c) hydrologic soil group d) land use e) drainage area
15. Define the term “rainfall excess.”
16. (T or F) The theoretical range of the SCS curve number (CN) is 40 to 100.
17. Sketch a typical total runoff hydrograph (TRH) and label the base flow and volume of direct
surface runoff.
Ans.
103
18. A plot of stream discharge vs. time is called a:
a) hydrograph b) hyetograph c) continuous simulation d) single event simulation
19. (T or F) The base flow component of a total runoff hydrograph corresponding to a
design storm is not generated by that particular storm.
20. Define the term “time of concentration.”
21. Sheet flow occurs when surface runoff moves across the ground toward defined
channels. Identify two surface flow features that produce resistance to sheet flow (Manning’s
n values).
22. According to SCS, the time of concentration is composed of which of the following times?
a) sheet flow b) shallow concentrated c) channel d) a and c only e) a, b, and c
23. One popular procedure for determining the time-of-concentration promoted by the NRCS
(formerly SCS) breaks down the flow time into three components. Name these components.
24. Define the term “hydraulic length.”
25. What is the difference between a one-hour and a two-hour unit hydrograph (i.e., UH1
and UH2)? (Hint: the answer is not one hour!)
26. (T or F) A unit hydrograph is a plot of flow over time at a stream location that results from
one inch (or one centimeter) of rainfall over a specified duration.
104
27. The “unit” in the term unit hydrograph (UH) refers to
a) one hour storm b) one inch of rainfall c) one inch of runoff d) one hour time increment
28. (T or F) A watershed has an infinite number of unit hydrographs.
29. (T or F) Synthetic unit hydrographs are useful design tools since most small watersheds do
not have stream gages.
30. Define “synthetic” in the term “synthetic unit hydrograph.”
31. (T or F) The SCS time-to-peak is the elapsed time from the beginning of the effective
(runoff-producing) rainfall to the time when the peak discharge occurs.
32. The effects of rainfall on a watershed can be separately accounted for and
accumulated. This concept is know as: a) superposition b) time-of-concentration c)
linearity d) none of these
33. What two principles are assumed in using a unit hydrograph to predict a watershed’s
response to a future (design) rainfall event?
34. (T or F) The total runoff hydrograph (TRH) or streamflow hydrograph produced by a
design storm is called the direct runoff hydrograph.
35. As a flood wave moves through a reservoir or pond, the
a) flood peak is reduced b) flood wave broadens c) flow volume is unchanged d) a, b, & c
36. Define the term “storage routing.”
37. Show all steps in the proof of the mass balance equation in going from dS/dt = I – O
to the following: Ii + Ij + (2S/Δt – O)i = (2S/Δt + O)j
105
38. (T or F) The orifice and mass balance equations are often used in elevation-outflow
determinations for stormwater management pond outlet devices.
39. To perform reservoir (storage) routing computations, all of the following are required except
a) inflow hydrograph b) outflow hydrograph c) elevation-storage relationship
d) elevation-outflow relationship e) routing time step
40. (T or F) The area in between the inflow and outflow hydrographs represents the storage of
water in a reservoir or pond.
41. Peak flows resulting from rainfall events are the only hydrologic requirement to design all of
the following hydraulic structures except:
a) stormwater inlets b) stormwater pipes c) drainage channels d) culverts e) drainage
ponds
42. Define the C term in the rational equation (Qp = CIA) and its units.
43. (T or F) Time of concentration does not equal the storm duration in the rational method.
Ans. False.
44. What information is needed before you can determine the storm intensity from an
IDF curve?
45. Which parameter is not needed in solving for peak flow using the rational equation?
a) hydrologic soil group b) return interval c) time of concentration d) drainage area
46. (T or F) The runoff coefficient (C) increases with increasing slope and imperviousness.
47. State the upper and lower limits of the runoff coefficient (C) value in the rational
equation and describe the meaning of each.
48. The runoff coefficient (C) in the rational equation decreases with all of the following except:
a) smaller slopes b) larger soil permeability c) less vegetative cover d) less imperviousness
49. Define the “I” term in the rational equation (Qp = CIA) and its units.
50. Define the term “pavement encroachment criteria.”
106
51. Locations that require the placement of a drainage inlet include all of the following except:
a) after an intersection b) in sumps where water collects without an outlet
a) upgrade of all bridges d) where the spread criteria is exceeded
1. (T or F) Inlet location design to limit street spread combines Manning’s equation for gutter
capacity and SCS pocedures for the rate of surface runoff.
2. Give three locations that require the placement of a drainage inlet.
3. Give three locations that require the placement of a manhole.
4. (T or F) Pipe slopes match overlying ground slopes when possible to minimize excavation.
5. Locations that require the placement of manholes include all of the following except:
a) pipe junctions b) changes of grade c) upgrade of intersections d) changes of
alignment
1. Why are pipe sizes not reduced downstream when increased slopes provide adequate
capacity?
2. (T or F) Peak flow calculations for stormwater inlets are used to size the subsequent pipes.
3. Maximum manhole spacing in straight reaches is usually specified (e.g.,
400 ft
). Why?
Problems
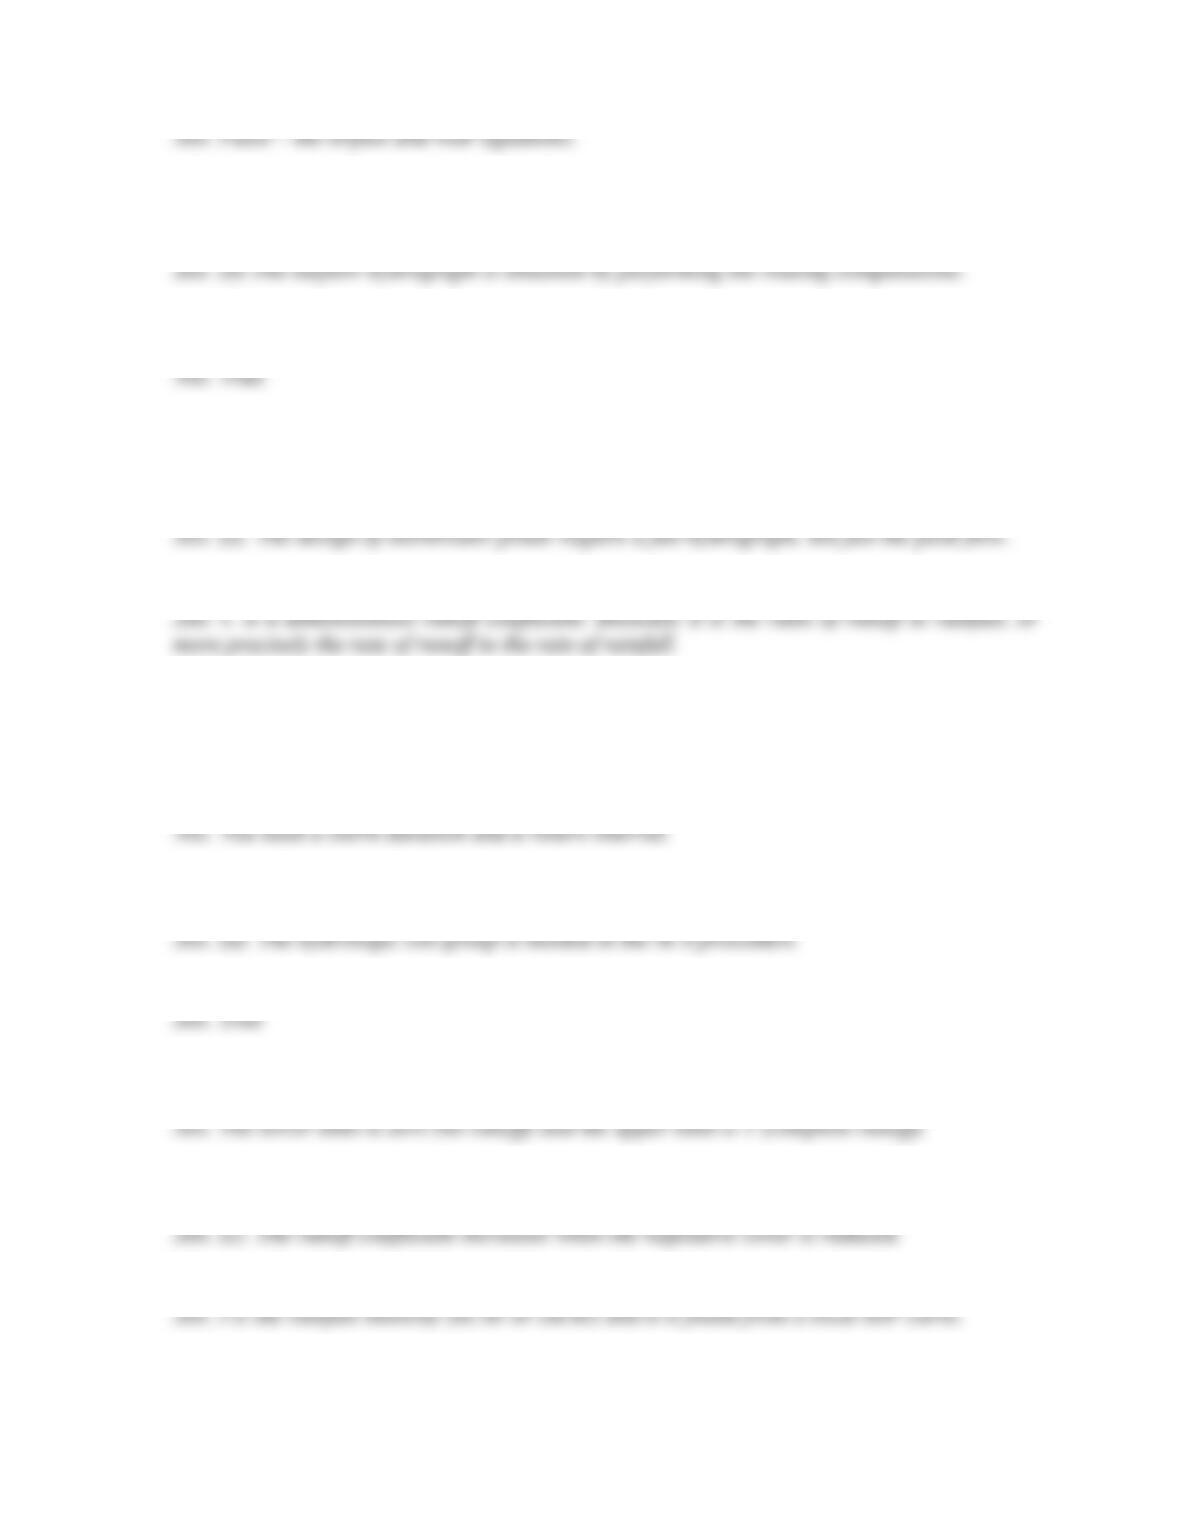
1. Delineate the watershed contributing flow from the tributary into Sugar Creek at the
design point (circle) on the topographic map shown below.
107
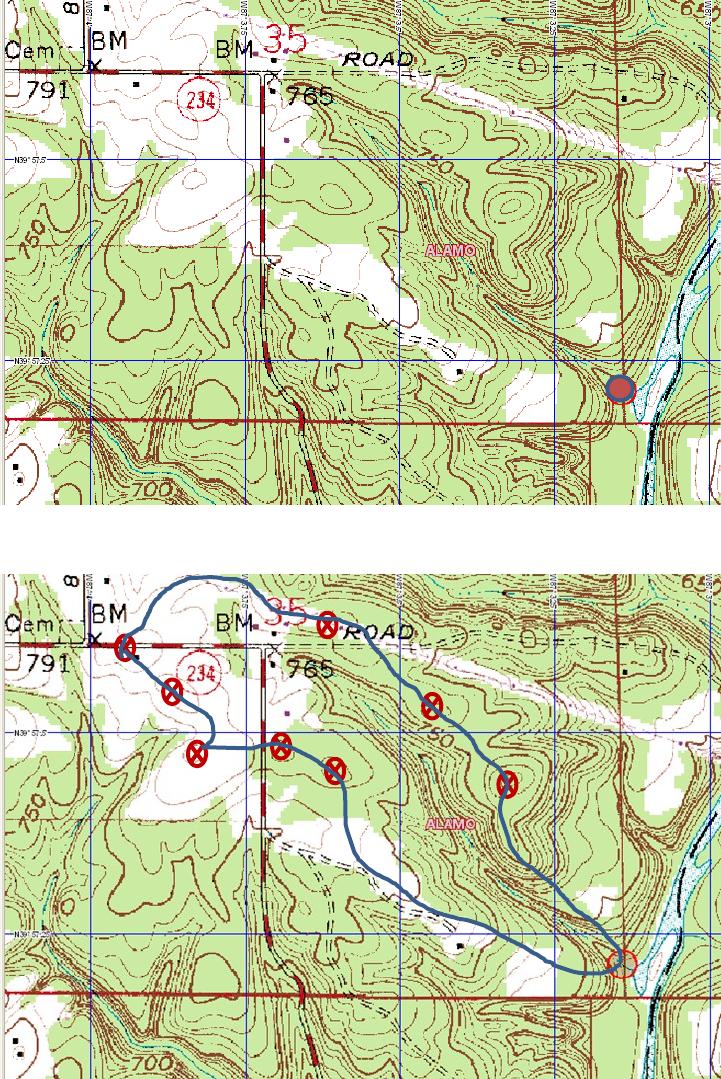
Ans.
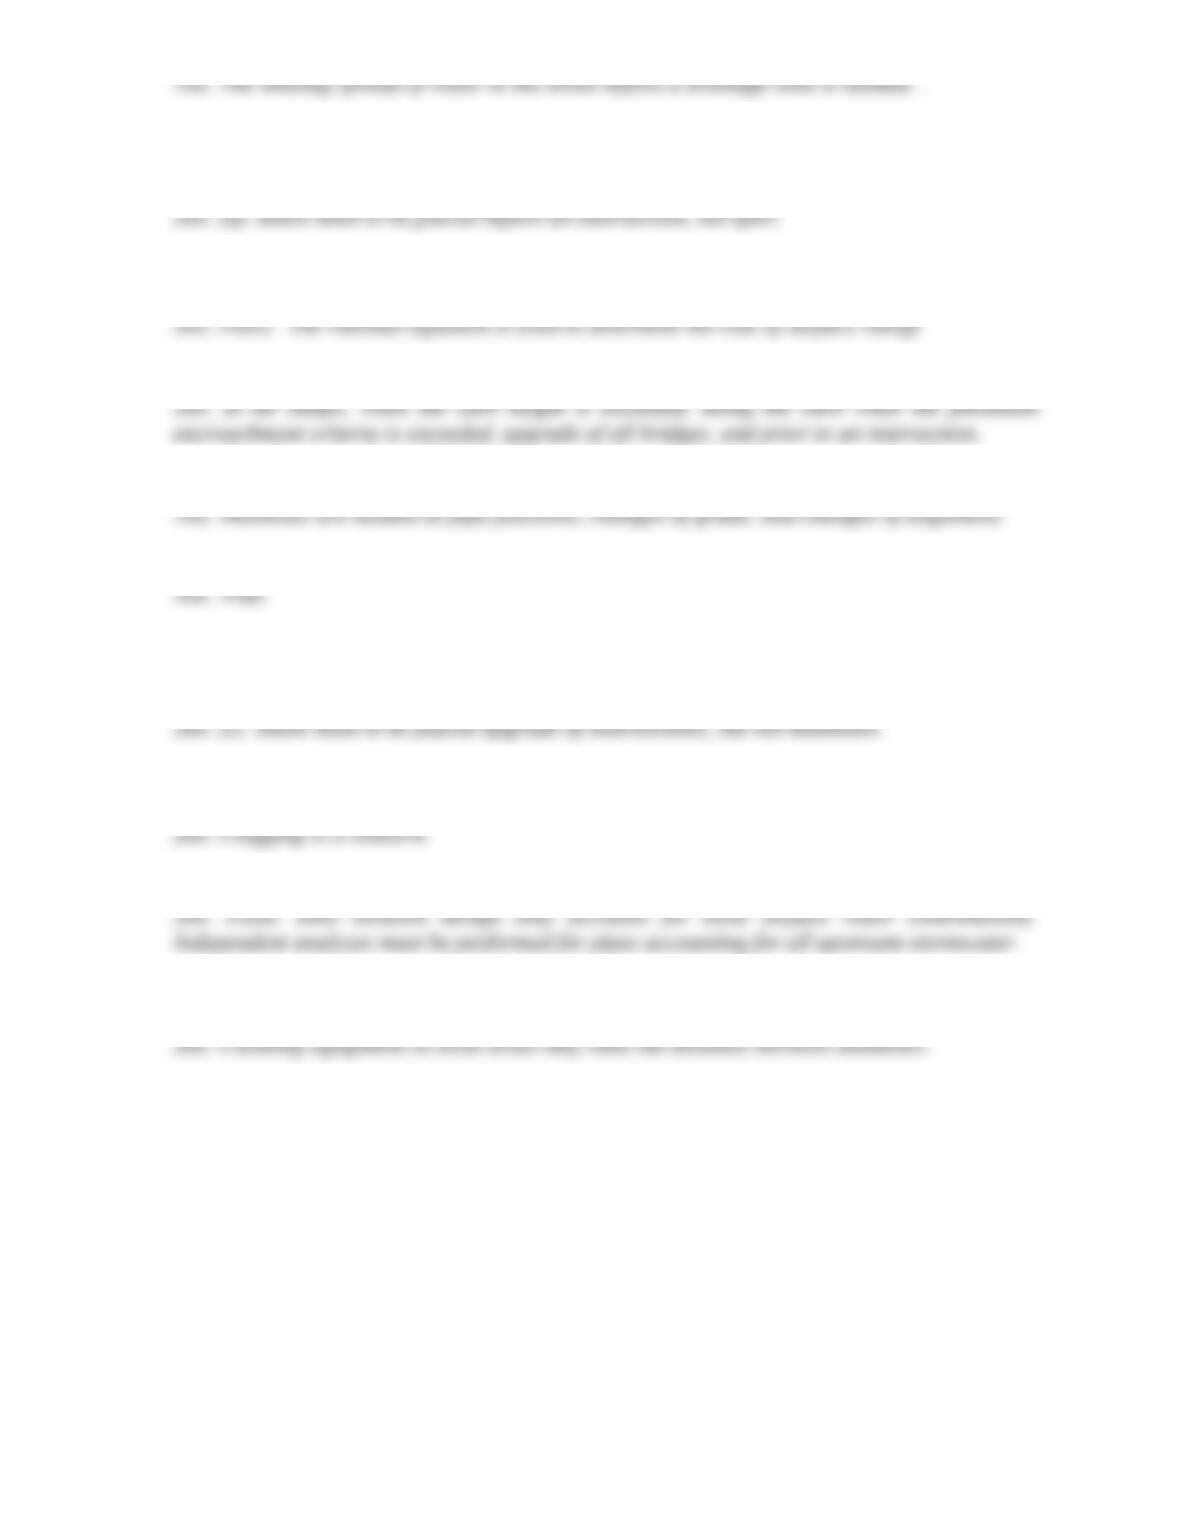
2. Delineate the two watersheds contributing flow to the tributary streams at the design
points (marked with X’s) on the topographic map shown below.
108
Ans.
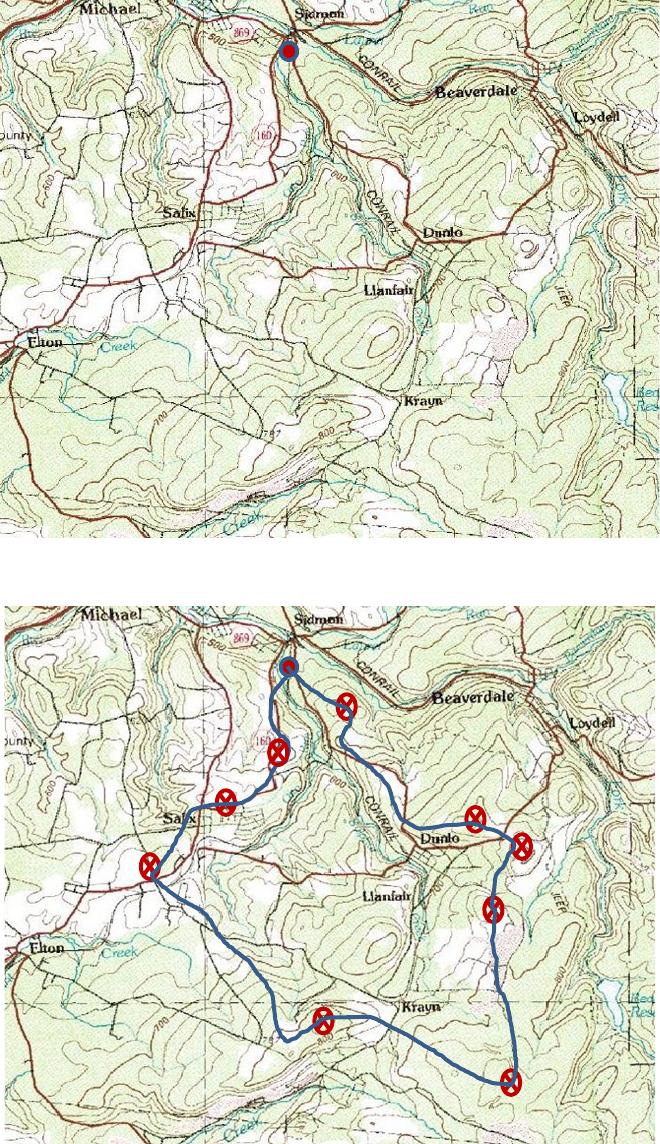
3. Delineate the two watersheds contributing flow to the tributary streams at the design
points (marked with X’s) on the topographic map shown below.
109
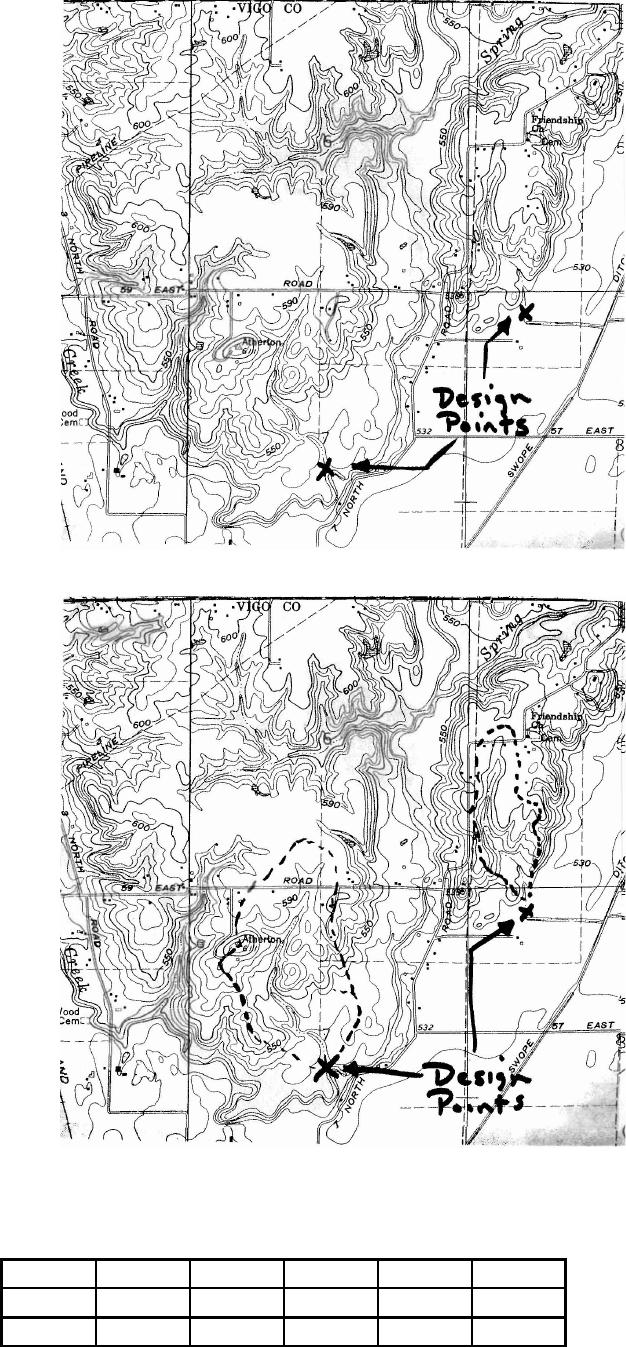
Ans.
4. Fill in the cells with question marks for the storm hyetograph table below.
t i ΔP P t/tdP/PT
(hr) (in./hr) (in.) (in.)
0 0.0 0.00 0.00
110
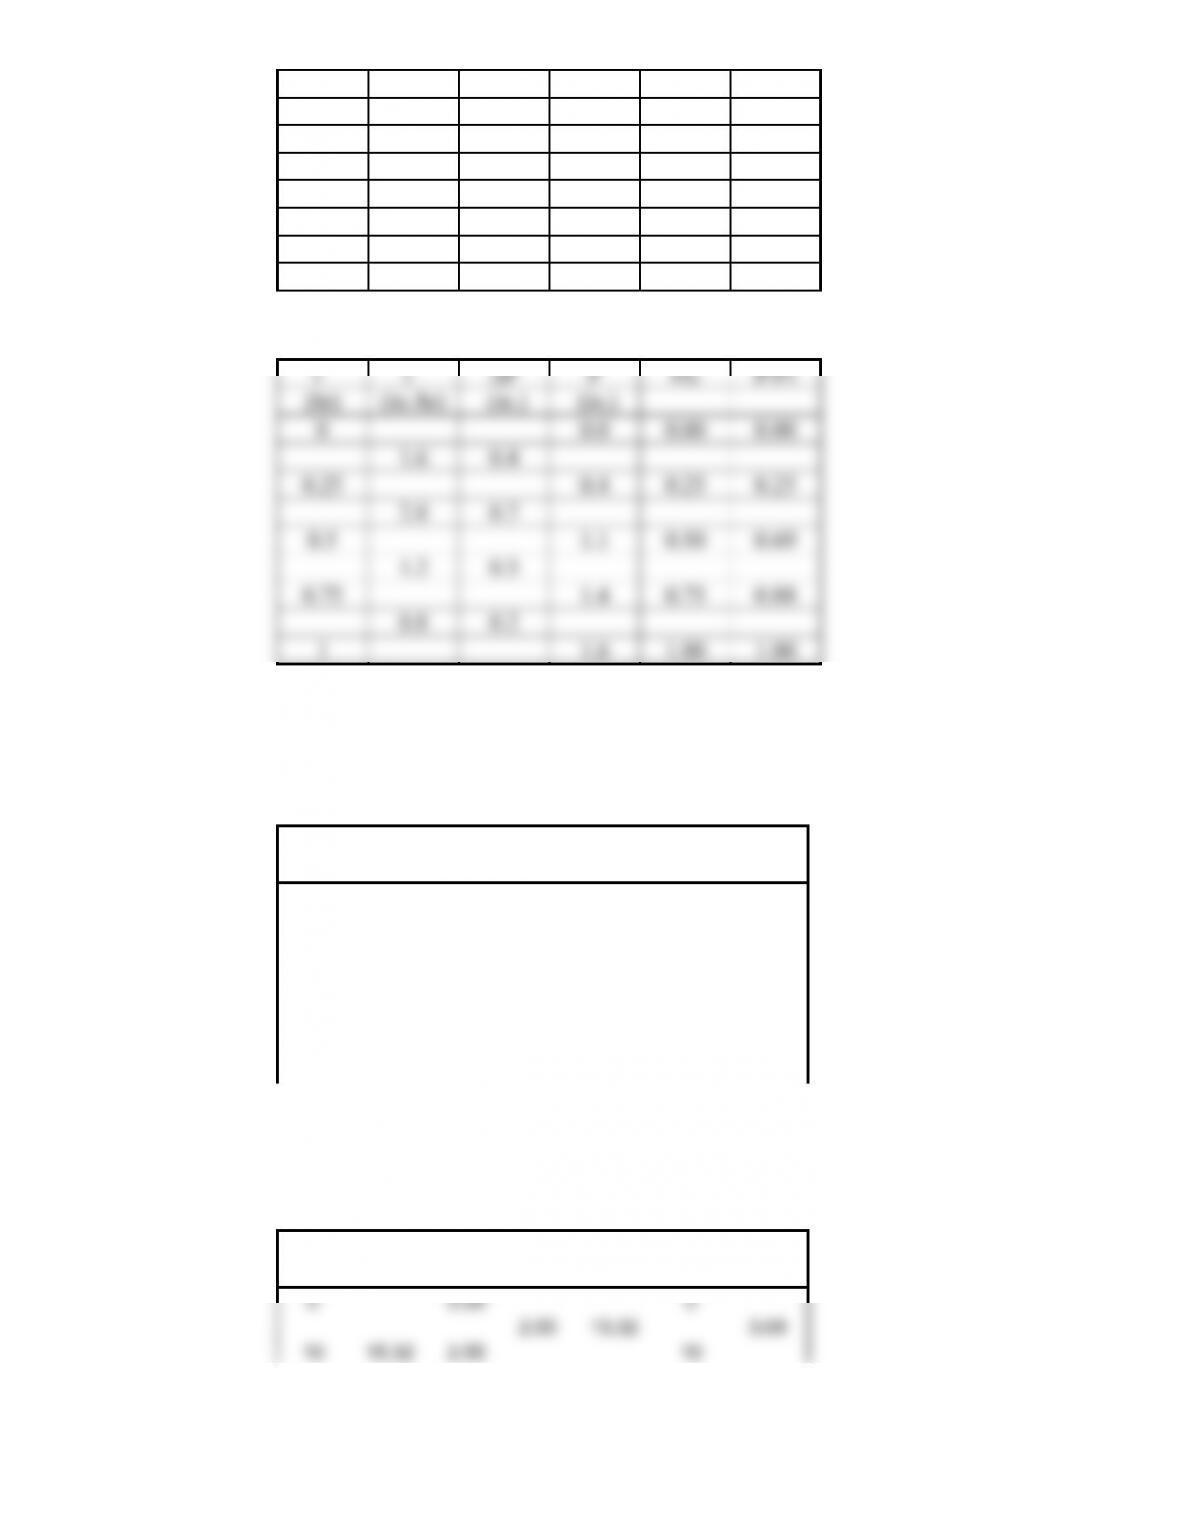
? 0.4
0.25 0.4 0.25 ?
2.8 0.7
? ? 0.50 0.69
1.2 ?
0.75 ? ? 0.88
0.8 0.2
1 1.6 1.00 ?
Ans.
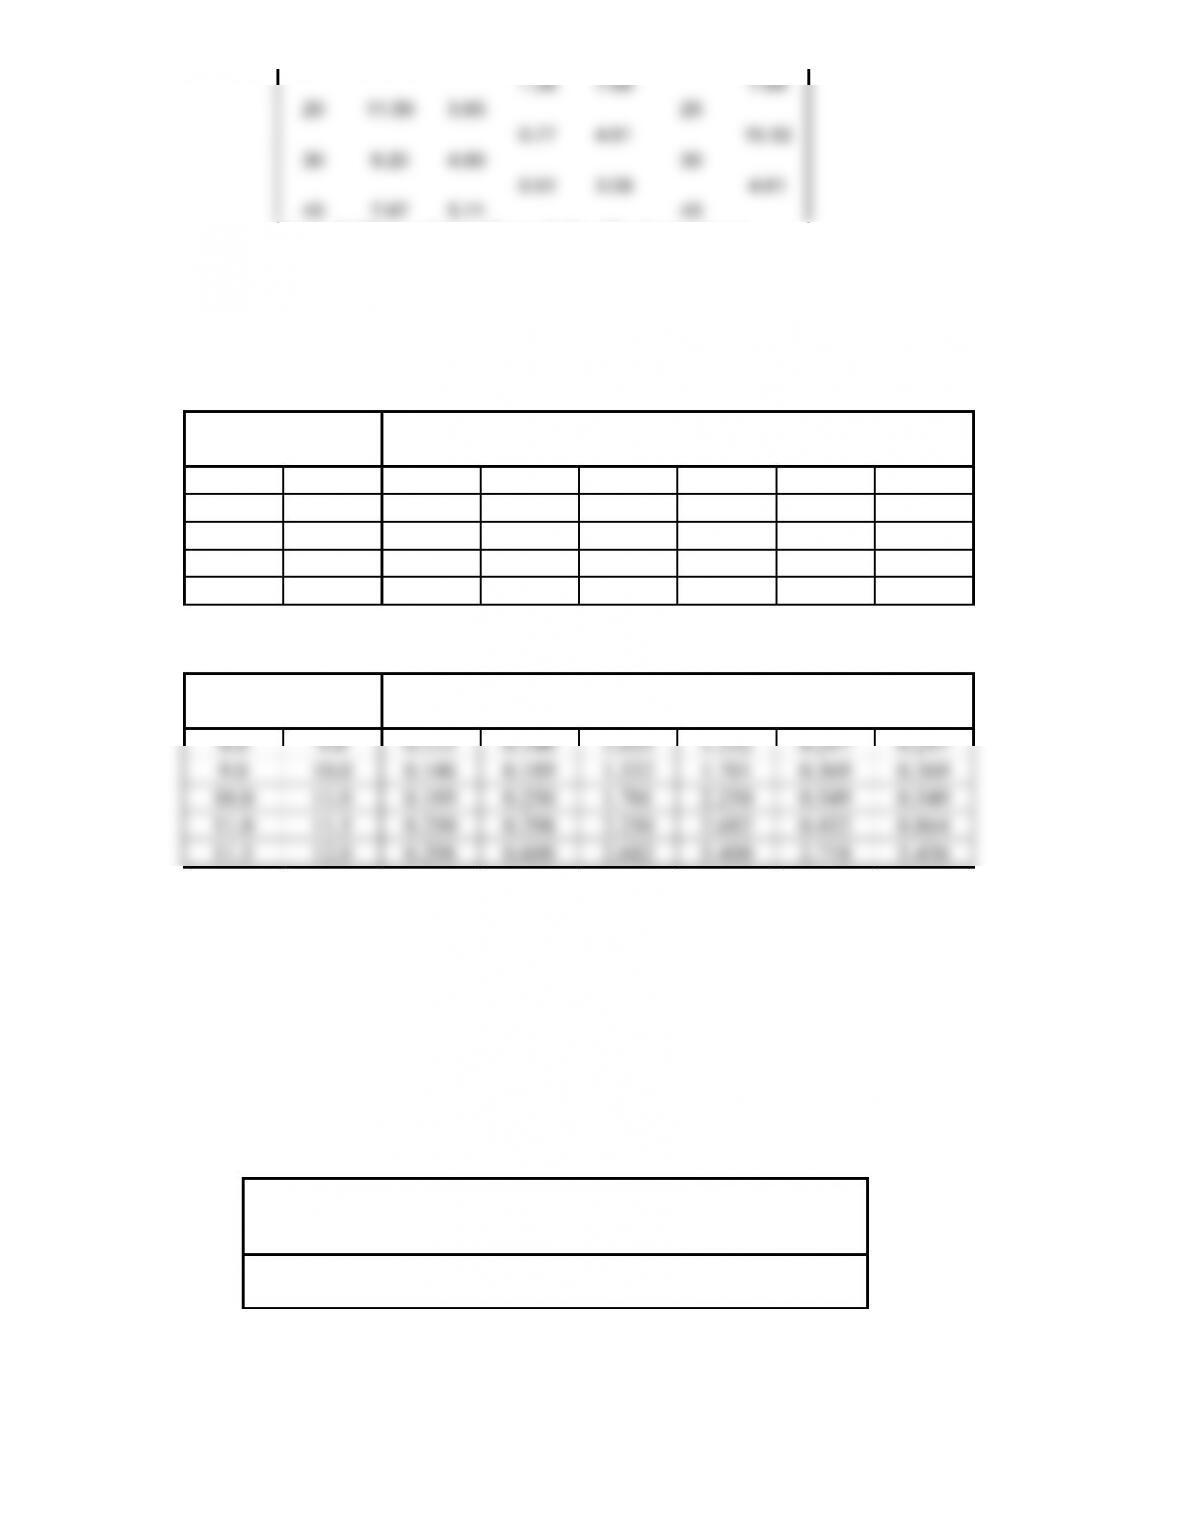
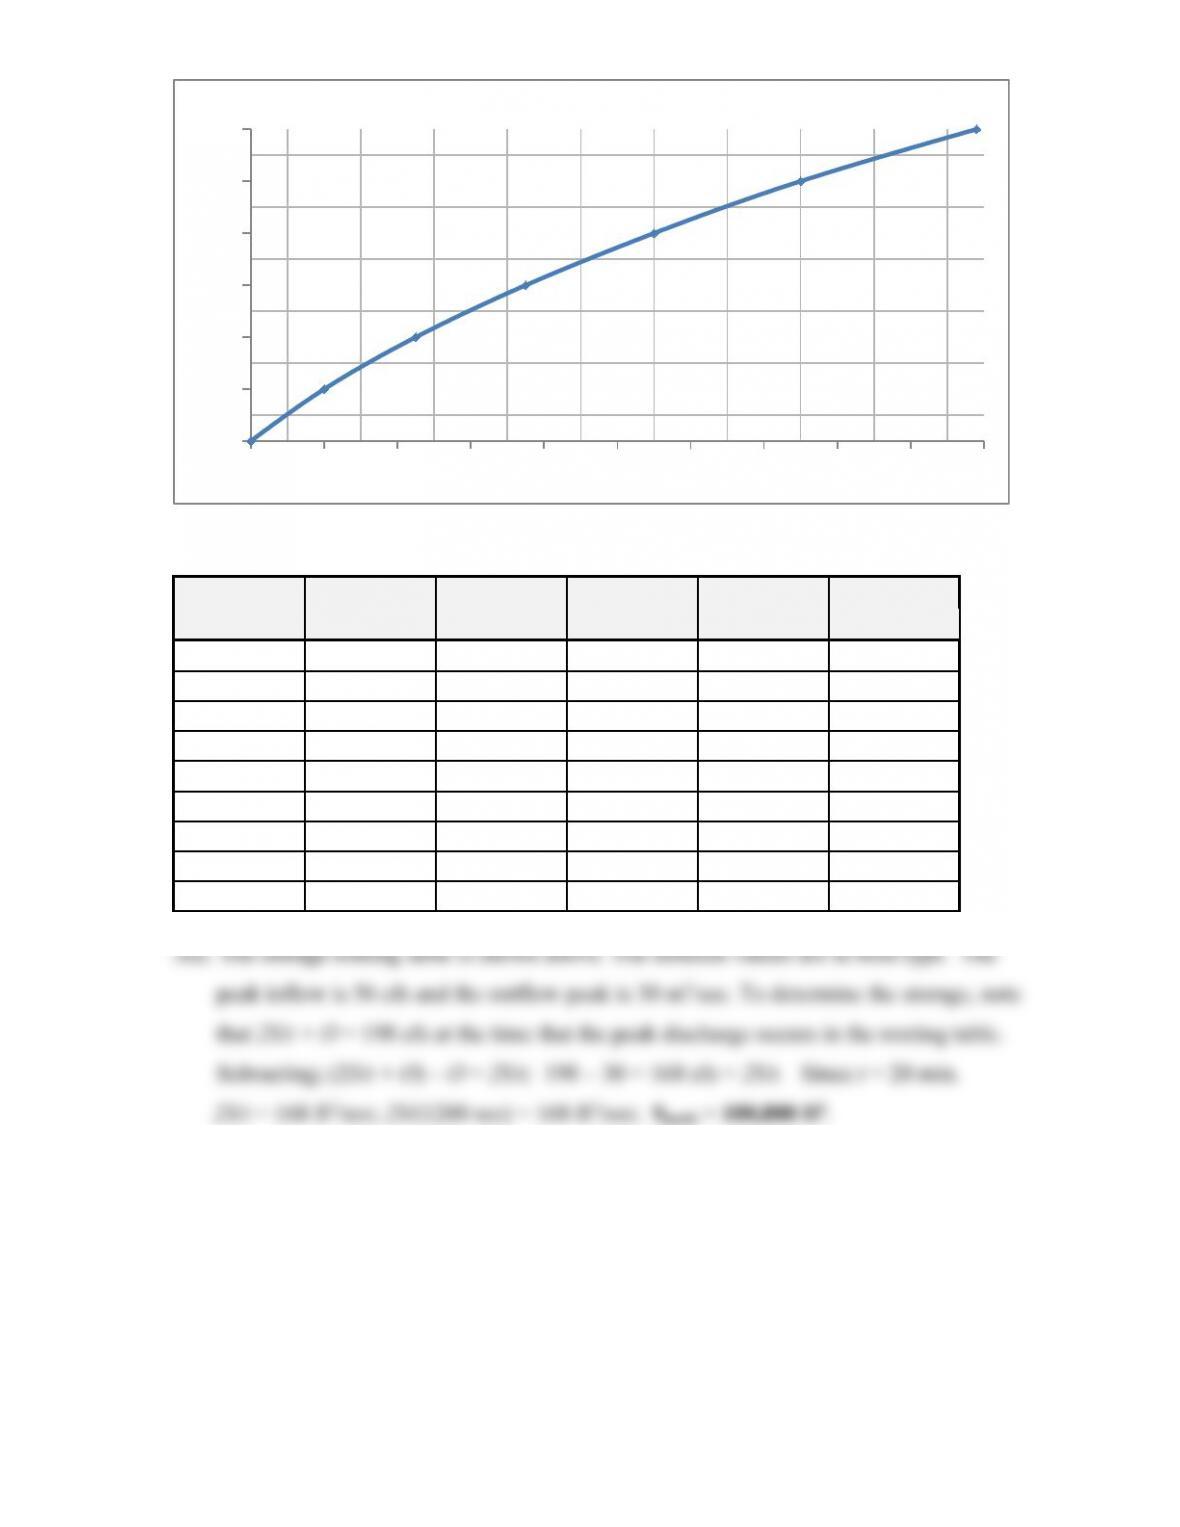
5. Fill in the cells with question marks for the storm (synthetic block) hyetograph table
below.
tdiavg P ΔPΔP/Δtt i
(min) (cm/hr) (cm) (cm) (cm/hr) (min) (cm/hr)
0 0.00 0
? ? 3.08
10 15.32 2.55 10
? 7.68 ?
20 ? 3.83 ?
0.77 4.61 15.32
30 9.20 ? 30
0.51 3.08 4.61
40 7.67 ? 40
Note: Table continues through the 60 minute storm.
Ans.
tdiavg P ΔPΔP/Δtt i
(min) (cm/hr) (cm) (cm) (cm/hr) (min) (cm/hr)
111
Note: Table continues through the 60 minute storm.
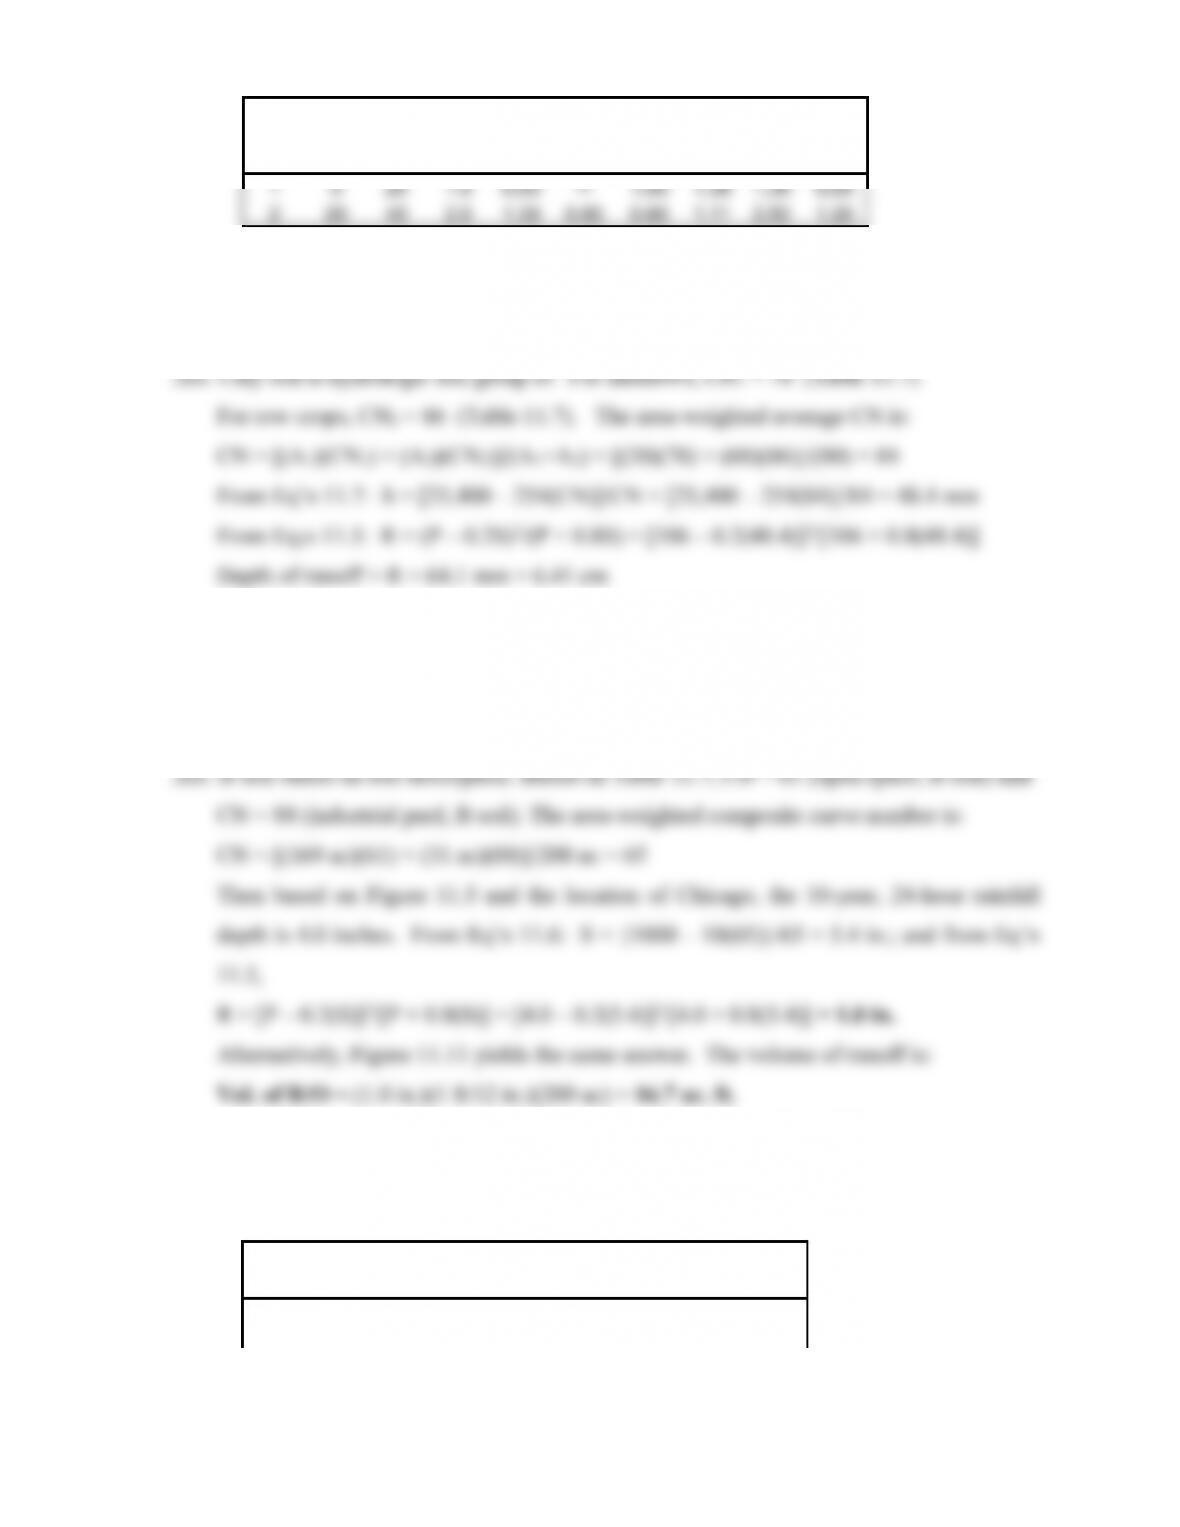
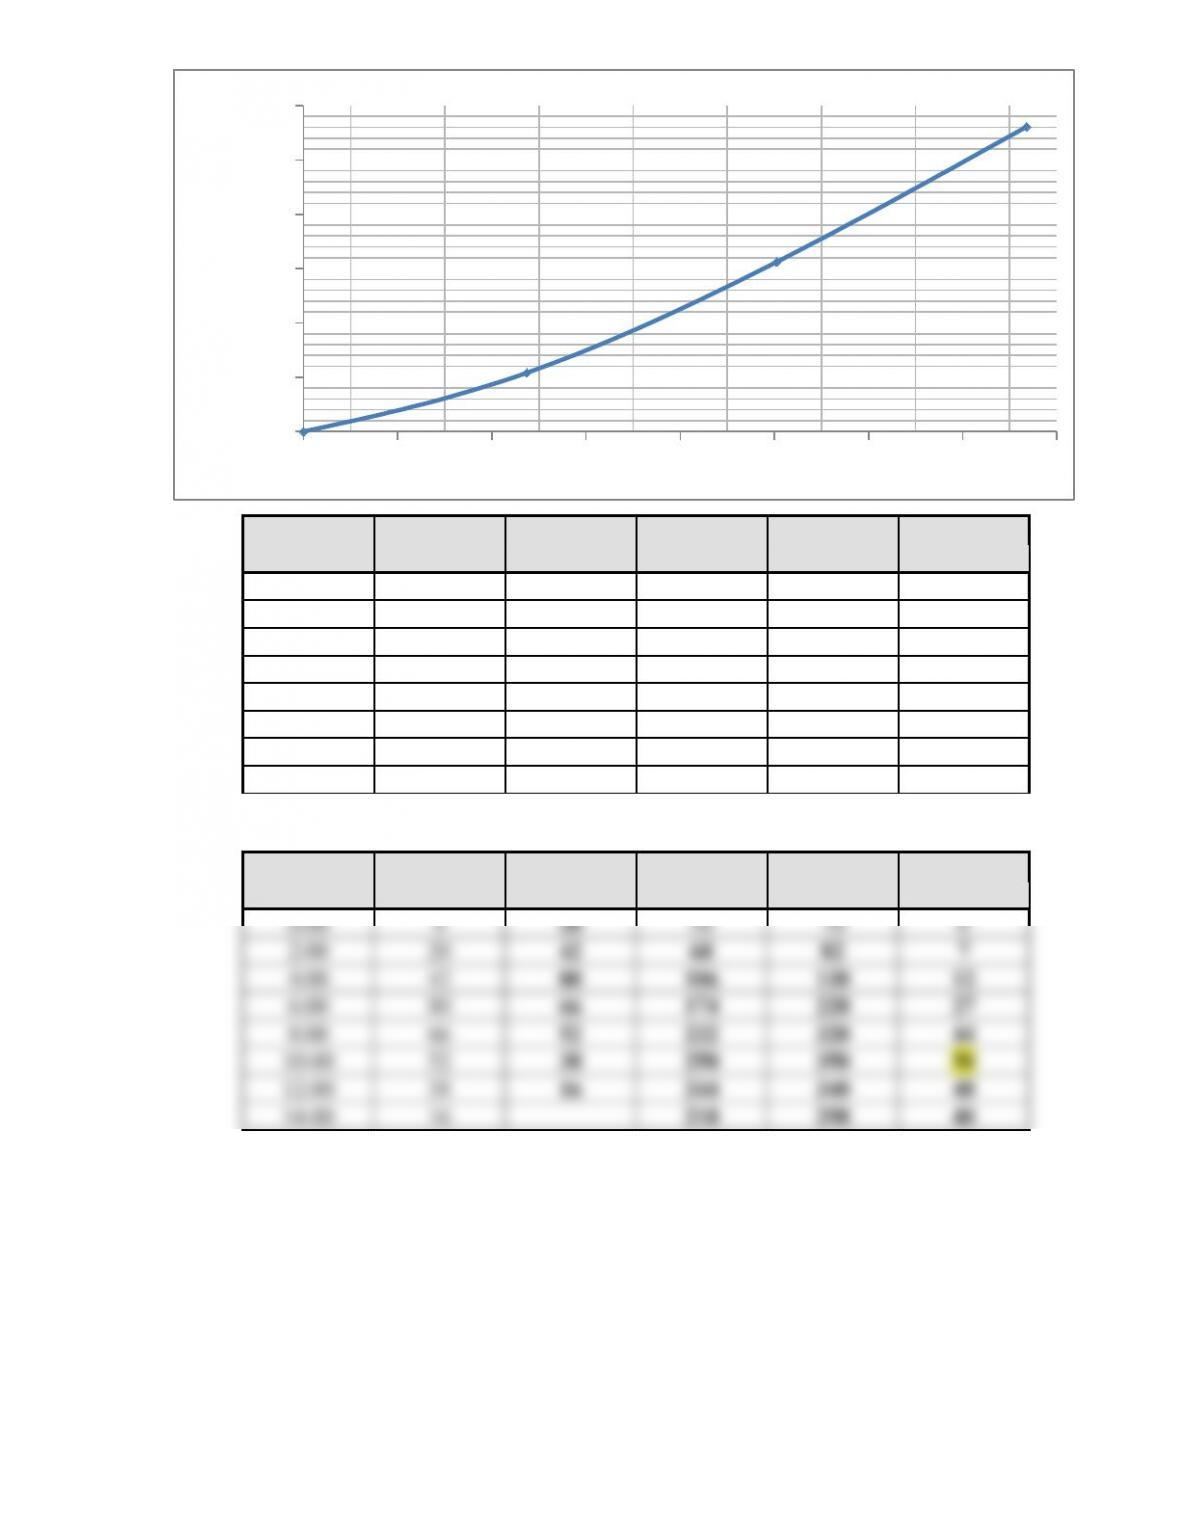
6. The 10-year, 24-hr precipitation for Miami, Florida is 9.0 inches. The table below
represents a solution procedure for determining the storm hyetograph. Fill out the rest of the
table.
t1t2P1/PTP2/PTP1P2∆P i
(hr) (hr) (in.) (in.) (in.) (in./hr)
8.0 9.0 0.115 0.148
9.0 10.0 0.148 0.189
10.0 11.0 0.189 0.250
11.0 11.5 0.250 0.298
11.5 12.0 0.298 0.600
Ans. The following table provides the solutions.
t1t2P1/PTP2/PTP1P2∆P i
(hr) (hr) (in.) (in.) (in.) (in./hr)
7. A rural watershed contains a soil with the following properties:
= 0.40, K = 0.12
in./hr, and Pf = 7.87 in. The initial degree of saturation is Si = 0.40 (i.e., 40% saturated). A
storm occurs over the watershed with rainfall rates tabulated in column 4 of the table below.
Determine the losses due to infiltration using the Green and Ampt method by filling in the
table. Also determine the rates of effective rainfall assuming that the losses occur due to
infiltration only.
1 2 3 4 5 6 7 8 9 10
Time t1t2i. Z1fpfΔZZ2ie
Step (min) (min) (in./hr) (in.) (in./hr) (in./hr) (in.) (in.) (in./hr)
1 0 20 1.0
2 20 40 2.0
Ans.
112
1 2 3 4 5 6 7 8 9 10
Time t1t2i. Z1fpfΔZZ2ie
Step (min) (min) (in./hr) (in.) (in./hr) (in./hr) (in.) (in.) (in./hr)
8. An 80 hectare agricultural watershed (clay soil) contains 20 hectares of meadows and
the remainder is in row crops. Determine the SCS depth of runoff (in cm) from a 5-year
storm that produces a total of 10.6 cm of rainfall.
9. A 200-acre watershed near Chicago, Illinois includes 169 acres of open space with
90% grass cover and a 31-acre industrial development park. The existing soil has course to
fine texture based on sieve tests. Determine the runoff depth (inches) and volume (acre-feet)
for the 10-year, 24-hour rainfall event.
10. A watershed in a industrial district possesses a CN of 91. Determine the rainfall
excess for the first 30 minutes of a 1-hour storm (i.e., fill in the blanks to the table below).
t1t2i ΔP P1P2R1R2ΔR
(min) (min) (in./hr) (in.) (in.) (in.) (in.) (in.) (in.)
0 15 2.8
15 30 3.6
Cont.
113
Ans.
t1t2i ΔP P1P2R1R2ΔR
(hr) (hr) (in./hr) (in.) (in.) (in.) (in.) (in.) (in.)
Cont.
11. A 40.5-hectare watershed (B soils) has been commercially developed. The longest
flow path is 915 meters and the average watershed slope is 2.5%. Determine the time of
concentration.
12. A new development is planned for a 250-acre watershed with a hydraulic length of
4500 feet. The predominant land use is woodlands (C soils) with an average land slope of
8%. However, the land use in the watershed is scheduled to change over the next two years to
single family residential (1/2-acre lots). Determine the SCS peak discharge after
development.
13. The 20-minute (1/3 hr) unit hydrograph (UH1/3) and base flow (BF) for an urban
watershed are provided in the table below. A 1 hour design storm produces 2 cm of runoff in
the first 20 minutes, 3 cm of runoff in the next 20 minutes, and 1 cm of runoff in the final 20
minutes. Determine the direct runoff hydrograph (DRF) and the total runoff hydrograph
(TRH) for the design storm by filling out the table.
Time UH1/3 DRH BF TRH
(min.) (m3/s) (m3/s) (m3/s) (m3/s)
114
0 0 2
20 6 2
40 14 1
60 30 2
80 24 3
100 18 4
120 12 5
140 6 5
160 0 5
180 5
Ans.
Time UH1/3 2×UH1/3 3×UH1/3 1×UH1/3 DRH BF TRH
(min.) (m3/s) (m3/s) (m3/s) (m3/s) (m3/s) (m3/s) (m3/s)
0 0 0 0 2 2
20 6 12 0 12 2 14
40 14 28 18 0 46 1 47
60 30 60 42 6 108 2 110
80 24 48 90 14 152 3 155
100 18 36 72 30 138 4 142
120 12 24 54 24 102 5 107
140 6 12 36 18 66 5 71
160 0 0 18 12 30 5 35
180 0 0 6 6 5 11
14. A 20-minute unit hydrograph (UH1/3) for an urban watershed (310 acres) is given
below. Determine the stream flow (TRH) that would result from a rainfall event on the
watershed if the runoff in a 40-minute storm is 1.5 inches in the first 20 minutes and 0.5
inches in the next 20 minutes. Assume a base flow of 20 cfs. Also determine the runoff
volume in acre feet.
Time (min) 0 10 20 30 40 50 60 70 80
Q (cfs) 0 140 320 500 420 280 160 60 0
Ans.
Time UH1/3 1.5×UH1/3 0.5×UH1/3 DRH BF TRH
20 min lag
(min) (cfs) (cfs) (cfs) (cfs) (cfs) (cfs)
115
15. Build a 2S/Δt + O vs. O relationship for a stormwater management pond by filling in
the blank spaces of the table below. The pond drains through a 2 ft by 2 ft box culvert that
behaves like an orifice (discharge coefficient of 0.6) with the invert elevation on the bottom
of the pond (stage = 0.0 feet). Assume a routing interval of 5 minutes and note that 1 ac-ft =
43,560 ft3.
Stage Outflow (O) Storage (S)2S/Δt (2S/Δt)+O
(ft) (ft3/sec) (ac-ft) (ft3/sec) (ft3/sec)
0.0 0 0.0 0 0
2.0 0.4
4.0 1.0
6.0 1.6
8.0 2.4
Ans. The outflow column is found using the orifice equation: Q = CdA(2gh)1/2
where Cd = 0.6, A = 4 ft2, g = 32.2 ft/sec2, and h = (stage – 1 ft)
(i.e., the difference between the stage and the middle of the culvert opening).
The remaining columns are just algebraic expressions with Δt = 300 seconds.
Stage Outflow (O) Storage (S)2S/Δt (2S/Δt)+O
(ft) (ft3/sec) (ac-ft) (ft3/sec) (ft3/sec)
16. A portion of a storage routing table is given below (90 minutes into the storm) along
with a graph of 2S/t + O vs. Outflow (O) for the reservoir. Fill in the blank spaces (?) in the
table.
Time Inflow (Ii) Inflow (Ij)(2S/Δt)-O (2S/Δt)+O Outflow, O
(min) (cfs) (cfs) (cfs) (cfs) (cfs)
116
0 100 200 300 400 500 600 700
0
5
10
15
20
25
30
35 2S/Δt+Ovs.Outflow (O)
(2S/Δt)+O, (cfs)
Outflow (O), (cfs)
Ans. The storage routing table is filled in using normal calculation procedures or using back
calculations to fill in prior cells based on the information available in the table.
Time Inflow (Ii) Inflow (Ij)(2S/Δt)-O (2S/Δt)+O Outflow, O
(min) (cfs) (cfs) (cfs) (cfs) (cfs)
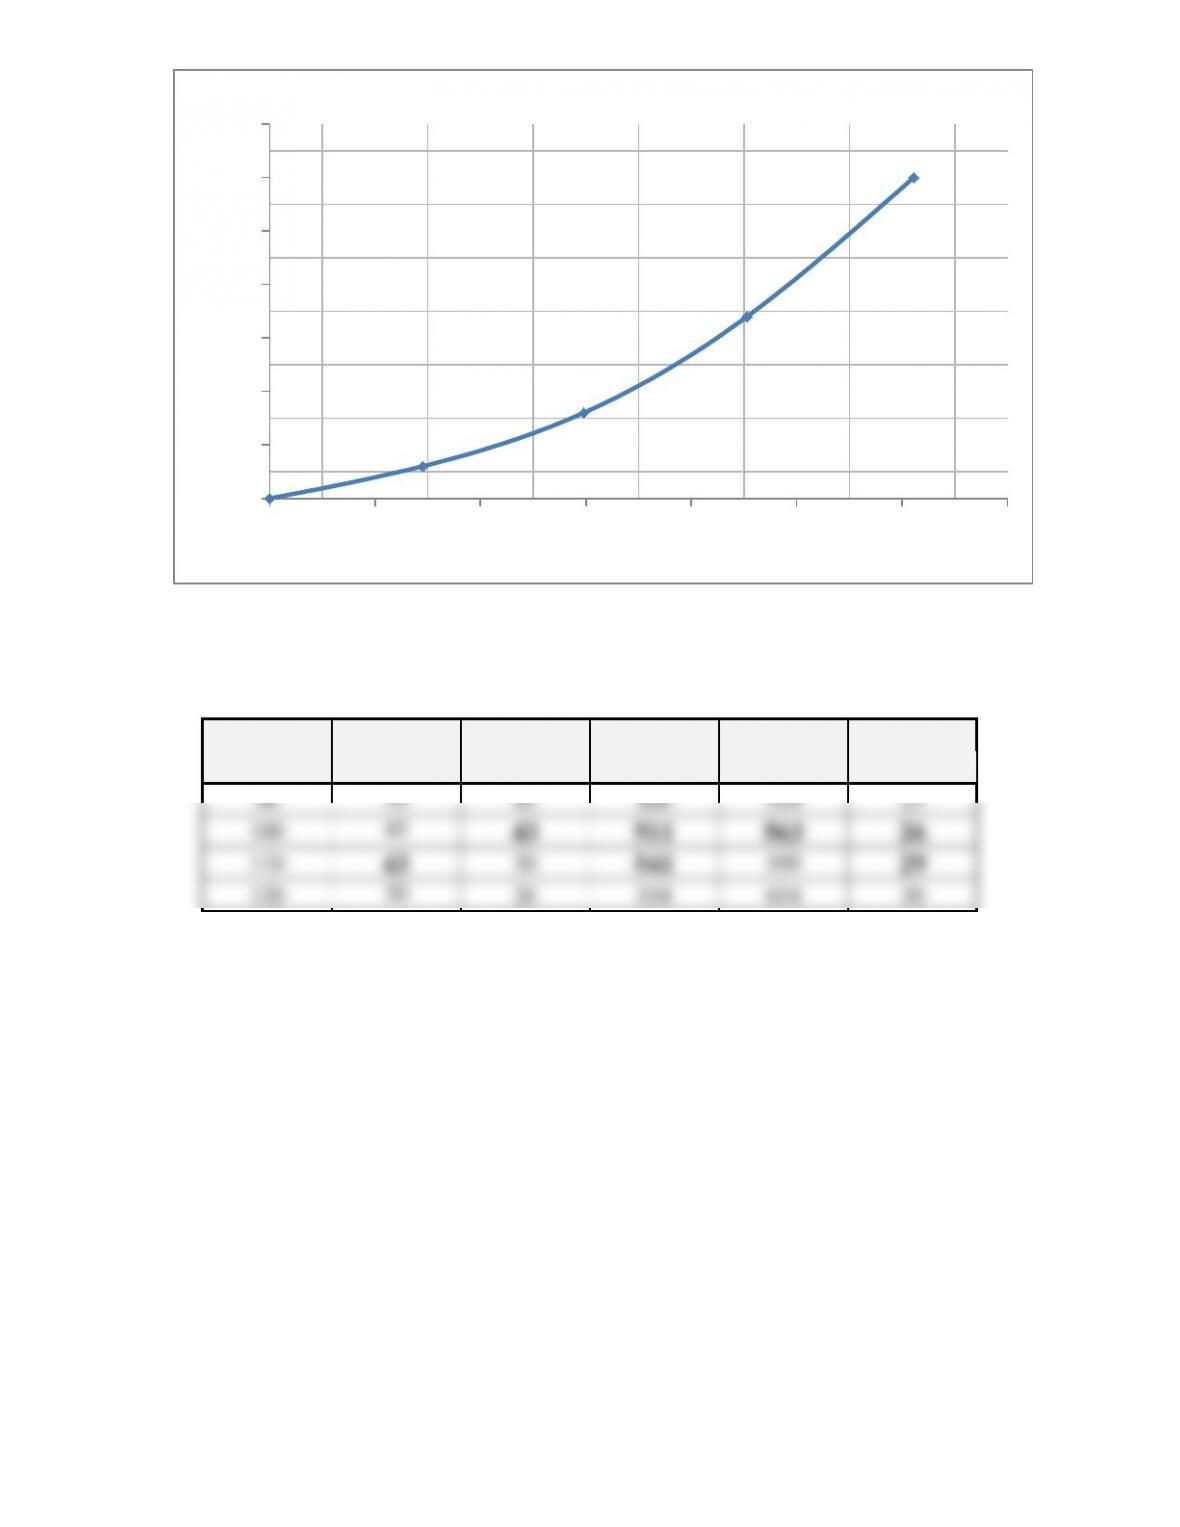
17. The 2S/t + O vs. Outflow (O) relationship for a reservoir is graphed below. Given an
inflow flood hydrograph (in the table below), determine the peak outflow from the reservoir
by filling in the missing values in the routing table. Note that the flood occurs before the
storage pool of the reservoir is empty since 2S/t + O = 70 m3/sec when the flood begins to
enter the reservoir.
117
0 50 100 150 200 250 300 350 400
0.0
10.0
20.0
30.0
40.0
50.0
60.0
2S/Δt+Ovs.Outflow (O)
(2S/Δt)+O, (m3/sec)
Outflow (O), (m3/sec)
Time Inflow (Ii) Inflow (Ij)(2S/Δt)-O (2S/Δt)+O Outflow, O
(hr) (m3/sec) (m3/sec) (m3/sec) (m3/sec) (m3/sec)
0:00 4 58 70 6
2:00 20
4:00 42
6:00 80
8:00 66
10:00 52
12:00 38
14:00 16
Ans. The missing values are in bold type in the table below. The peak outflow is 50 m3/sec.
Time Inflow (Ii) Inflow (Ij)(2S/Δt)-O (2S/Δt)+O Outflow, O
(hr) (m3/sec) (m3/sec) (m3/sec) (m3/sec) (m3/sec)
18. Given the following 2S/t + O vs. Outflow (O) graph, compute the outflow
hydrograph from the reservoir using the design storm (inflow hydrograph) provided. Identify
the peak inflow, peak outflow, and the storage volume required to reduce the peak by this
amount.
118
0 20 40 60 80 100 120 140 160 180 200
0
5
10
15
20
25
30
2S/Δt+Ovs.Outflow (O)
(2S/Δt)+O, (cfs)
Outflow (O), (cfs)
The reservoir inflow hydrograph is given below (in the first two columns).
Time Inflow (Ii) Inflow (Ij)(2S/Δt)-O (2S/Δt)+O Outflow, O
(min) (cfs) (cfs) (cfs) (cfs) (cfs)
0210 0 2
20 10 34 6 12 3
40 34 56 28 50 11
60 56 46 76 118 21
80 46 30 122 178 28
100 30 22 138 198 30
120 22 16 132 190 29
140 16 10 116 170 27
160 10 94 142 24
19. Determine the 10-year peak discharge using the rational equation for a concrete
parking lot that is 300 feet wide by 600 feet long. The longest flow path is 300 feet of sheet
flow across the lot on a slope of 0.5% and 600 feet of shallow concentrated flow along the
parking lot’s length in a paved channel on a slope of 1.5%. Use SCS procedures to determine
the time of concentration using a 2-year, 24-hr rainfall of 2.4 inches. Use Figure 11.4 for the
rainfall intensity in the rational equation.
119
Ans. Using the SCS sheet flow and shallow concentrated flow equations (11.8 & 11.10)
yields:
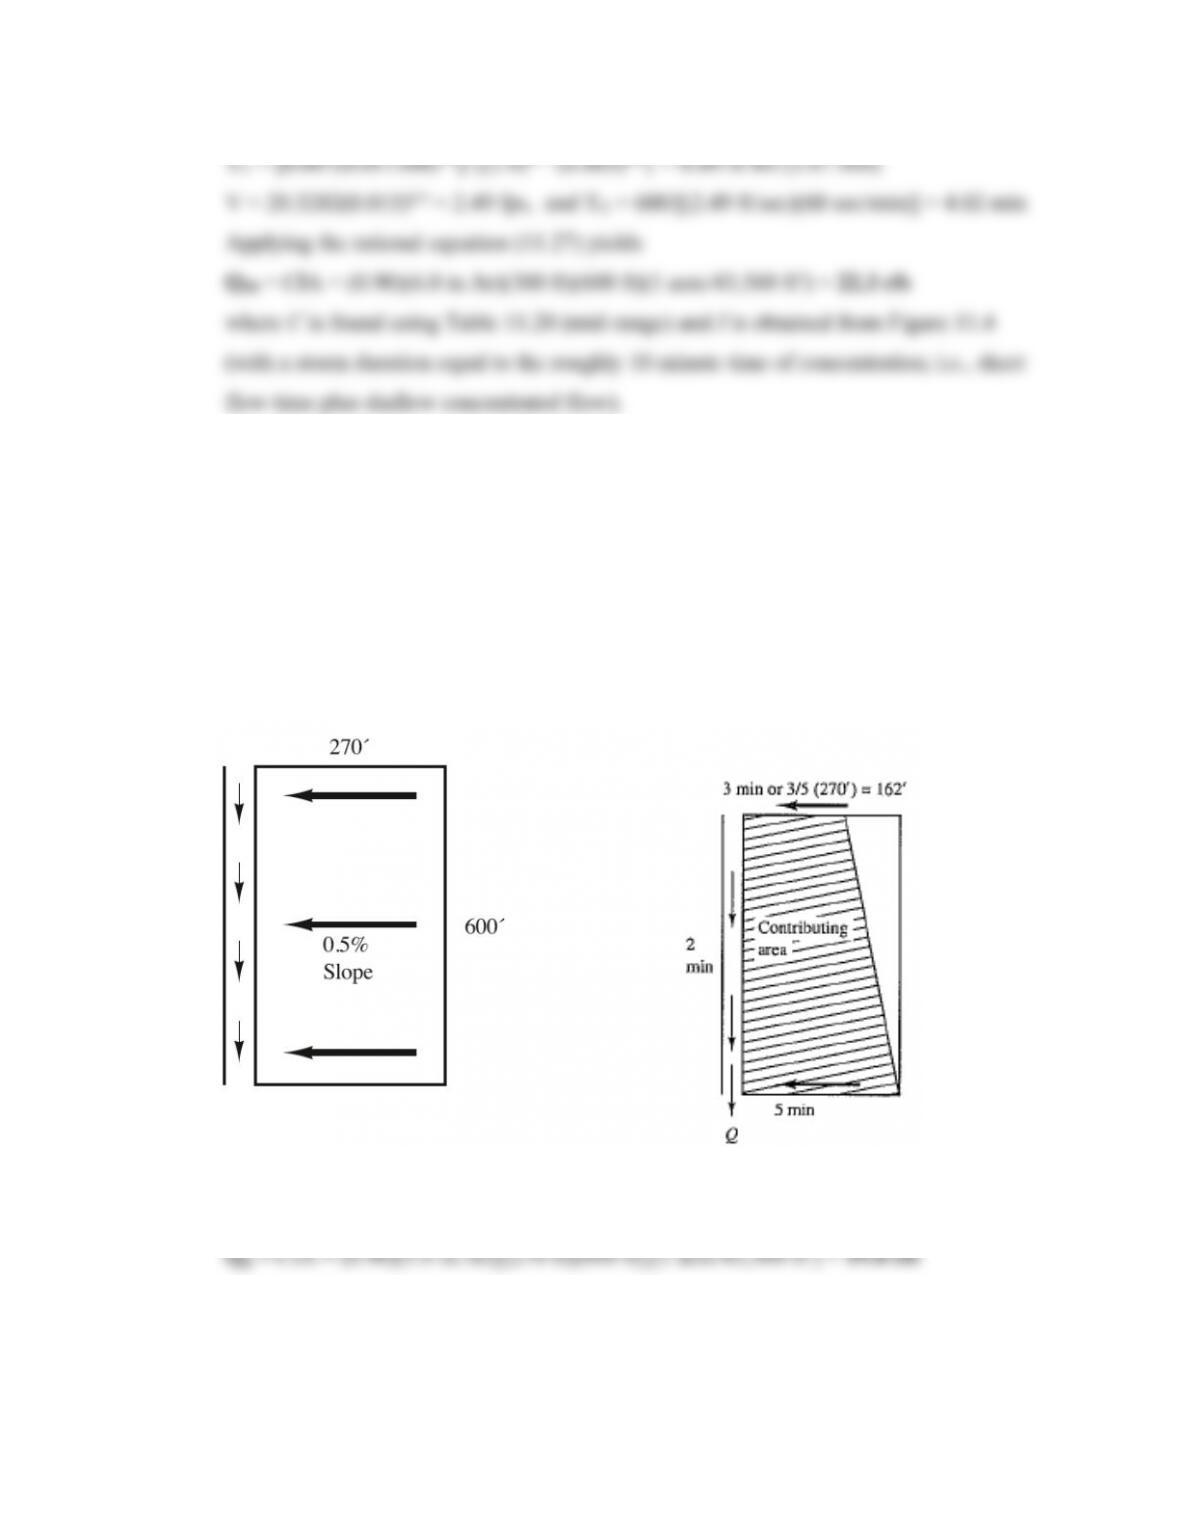
20. The paved parking lot depicted in the figure below (left) drains as sheet flow into a
concrete side channel that discharges into a stormwater management pond. The travel time
across the parking lot as sheet flow is five minutes, and the travel time through the entire
drainage channel is two minutes. Determine the 5-year peak discharge for design purposes
using the rational equation. Also determine the peak discharge resulting from a 5-year, 5-
minute storm. Assume that Figure 11.4 contains the appropriate IDF curves. (Hint: Recall
that in the rational method, the time-of-concentration storm yields the highest peak flow
because the entire drainage area is contributing flow to the design point (i.e., the stormwater
management pond in this case).
Ans. Contributing area for 5-min. storm.
Ans. Applying the rational equation (11.27) to determine the peak flow for design yields:
120

21. A 100-ft wide parking lot drains as sheet flow across its width to a curb and gutter
section on one side. Curb opening inlets are to be placed along the gutter (asphalt; n = 0.015)
which has a 3/8-inch per foot cross slope and a longitudinal slope of 1.5%. If the sheet flow
time is 5.0 minutes and the gutter flow time is negligible, determine how far along the length
of the parking lot you should go before placing the first inlet based on a 10-year design
storm. The allowable pavement encroachment is 8 feet and the IDF curve in Figure 11.4
applies.
Ans. Based on the cross slope and allowable spread, a 3.0-inch curb depth results. Thus
Applying the rational equation (with Tc = 5 min., Figure 11.4, & Table 11.20) yields
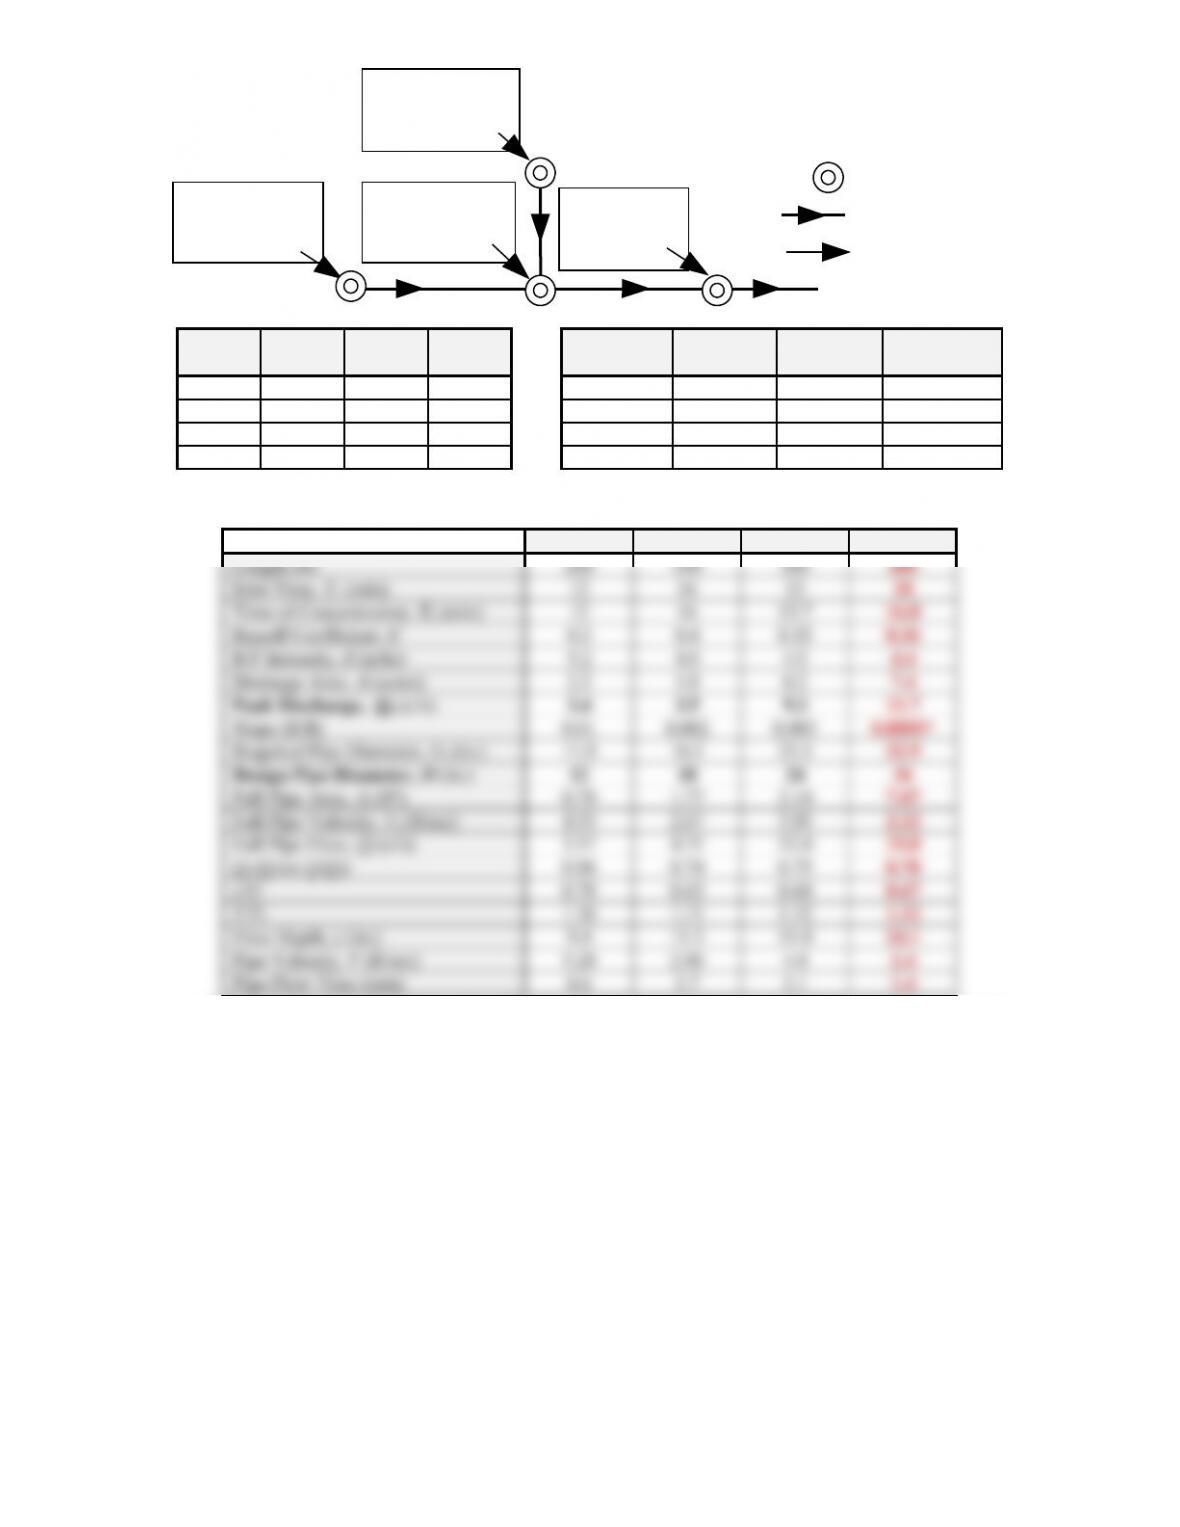
22. Stormwater collection pipes (concrete; 12-in. min. diameter) are needed for the
subdivision shown below. The data for each of the drainage areas (basins) contributing flow
to the manholes is provided in the table below, including the inlet time (Ti) and the runoff
coefficient (C). In addition, stormwater pipe information is given, including the ground
elevation at each manhole. The rainfall intensity-duration relationship for the design storm
121
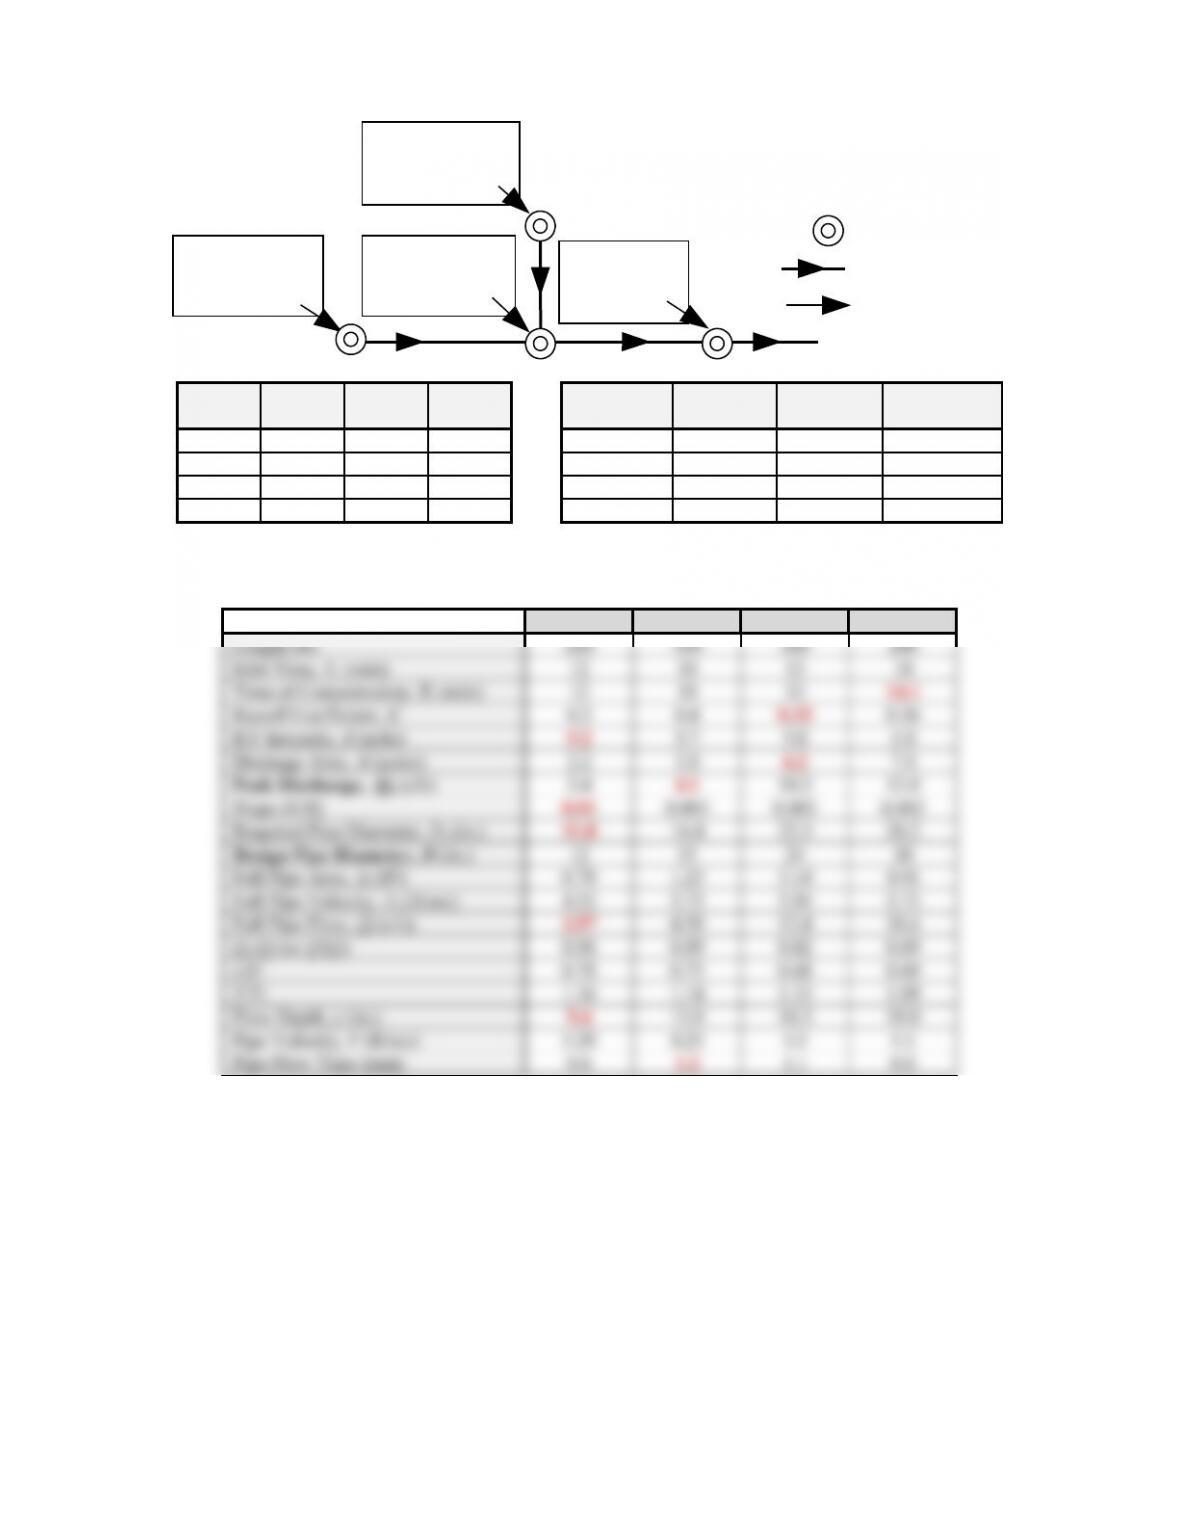
Surface runoff
A
B
CDRiver
Basin 1
Basin 2 Basin 3 Basin 4
Inlet/manhole
Storm pipe
can be described by i = 18/(td0.50), where i = intensity in in./hr, and td = storm duration = time
of concentration in minutes. Fill in the blanks in the stormwater pipe design table.
Basin Area
(acres)
Ti
(min.) CStormwater
Pipe
Length
(ft)
Upstream
Elev. (ft)
Downstrea
m Elev. (ft)
1 2.2 12 0.3 AB 200 24.9 22.9
2 1.8 10 0.4 CB 300 24.4 22.9
3 2.2 13 0.3 BD 300 22.9 22.0
4 1.2 10 0.5 DR 200 22.0 21.6
Ans. The blanks in the design table are filled in below (in bold and red).
Stormwater Pipe AB CB BD DR
23. Stormwater collection pipes (concrete; 12-in. min. diameter, min. full pipe velocity of
2 ft/sec) are needed for the subdivision shown below. The data for each of the drainage areas
(basins) contributing flow to the manholes is provided in the table below, including the inlet
time (Ti) and the runoff coefficient (C). In addition, stormwater pipe information is given,
including the ground elevation at each manhole. The rainfall intensity–duration relationship
for the design storm can be described by i = 18/(td0.50), where i = intensity in in./hr, and td =
storm duration = time of concentration in minutes. Fill in the last column in the stormwater
pipe design table.
122
Surface runoff
A
B
CDRiver
Basin 1
Basin 2 Basin 3 Basin 4
Inlet/manhole
Storm pipe
Basin Area
(acres)
Ti
(min.) CStormwater
Pipe
Length
(ft)
Upstream
Elev. (ft)
Downstrea
m Elev. (ft)
1 2.2 12 0.3 AB 200 24.9 22.9
2 1.8 14 0.4 CB 300 23.5 22.9
3 2.2 13 0.3 BD 300 22.9 22.0
4 1.2 10 0.5 DR 200 22.0 22.0
Ans. The last column of the design table is filled in below (in bold and red).
Stormwater Pipe AB CB BD DR
Note: *Slope was adjusted up from 0% (ground slope) to 0.05% to get a 2 ft/sec full pipe velocity.
123