18.4 Chapter Figures
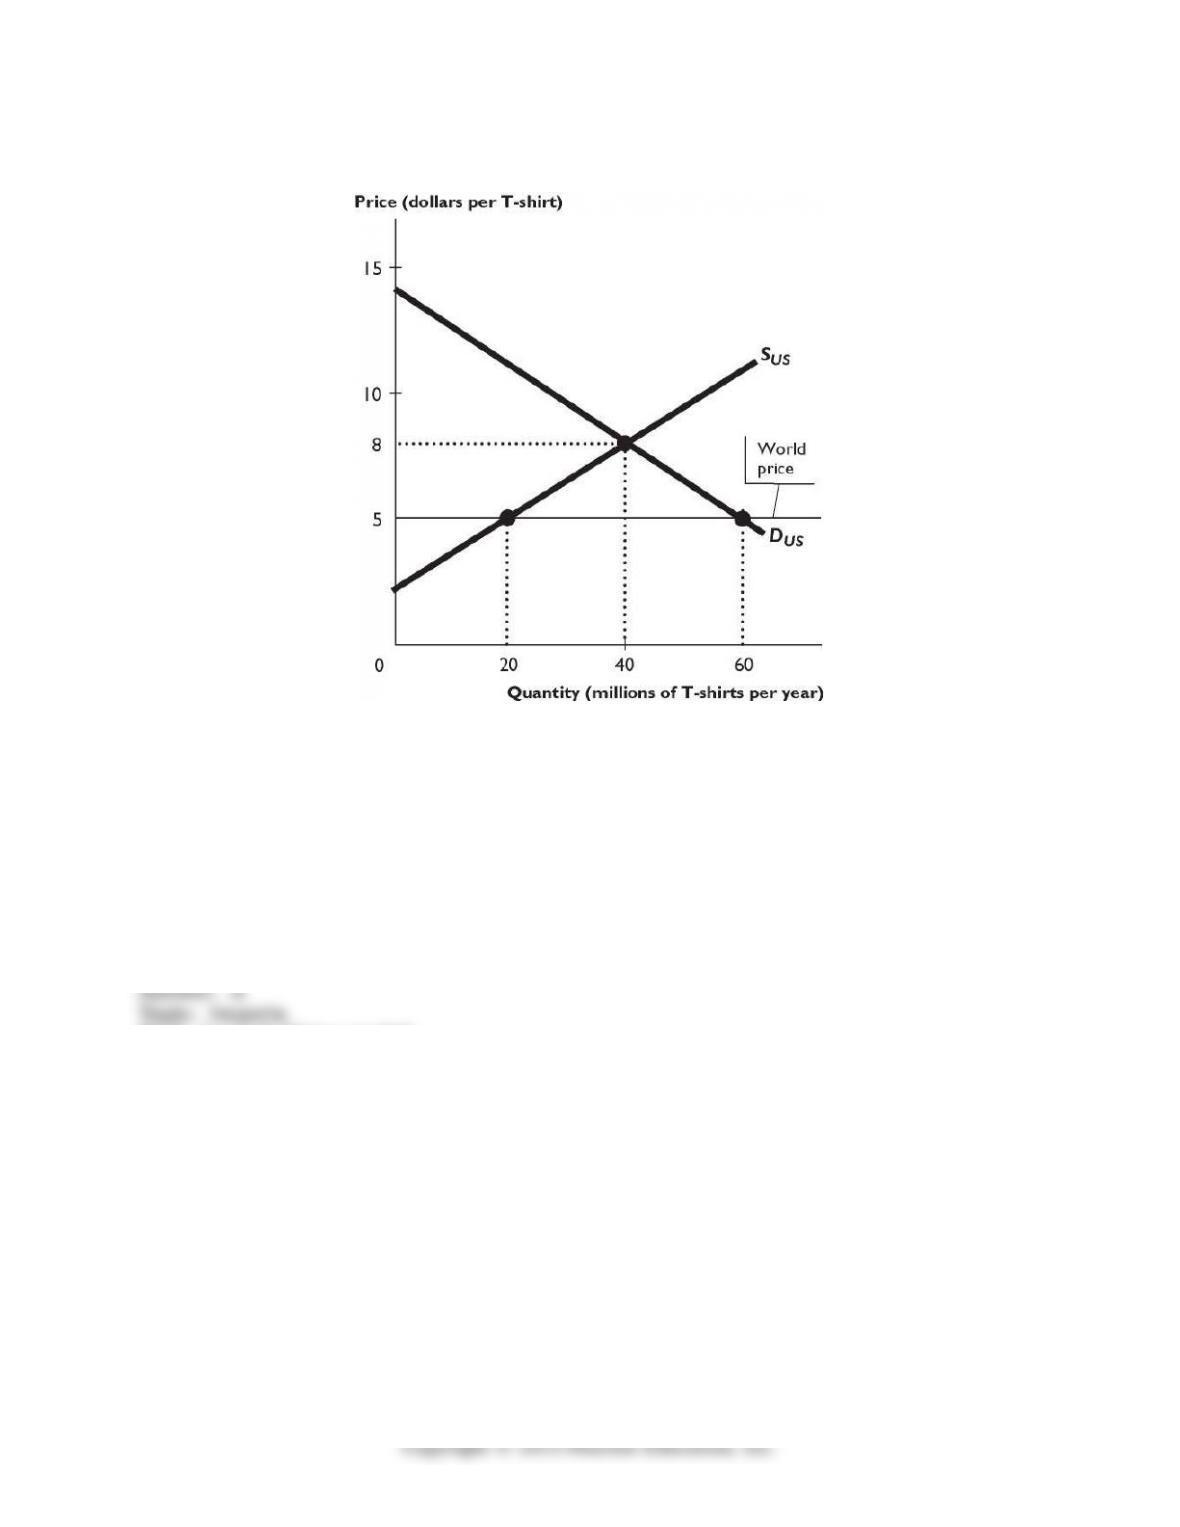
The igure above shows the U.S. market for T-shirts, where SUS is the domestic supply
curve and DUS is the domestic demand curve. The United States trades freely with the rest
of the world. The world price of a T-shirt is $5.
1) In the igure above, with international trade U.S. consumers buy ________ million T-shirts
per year at ________ per T-shirt.
A) 60; $5
B) 40; $8
C) 20; $5
D) 40; $5
E) 60; $11
Skill: Level 3: Using models
Section: Checkpoint 18.1
Status: Old
AACSB: Analytical thinking
61

2) Based on the igure above, as a result of international trade, U.S. domestic production
________ million T-shirts per year.
A) decreases by 20
B) increases by 20
C) decreases by 10
D) increases by 40
E) increases by 10
Skill: Level 3: Using models
Section: Checkpoint 18.1
Status: Old
AACSB: Analytical thinking
3) In the igure above, with international trade the United States ________ million T-shirts
per year.
A) imports 40
B) exports 40
C) exports 20
D) imports 20
E) imports 60
Skill: Level 3: Using models
Section: Checkpoint 18.1
Status: Old
AACSB: Analytical thinking
62
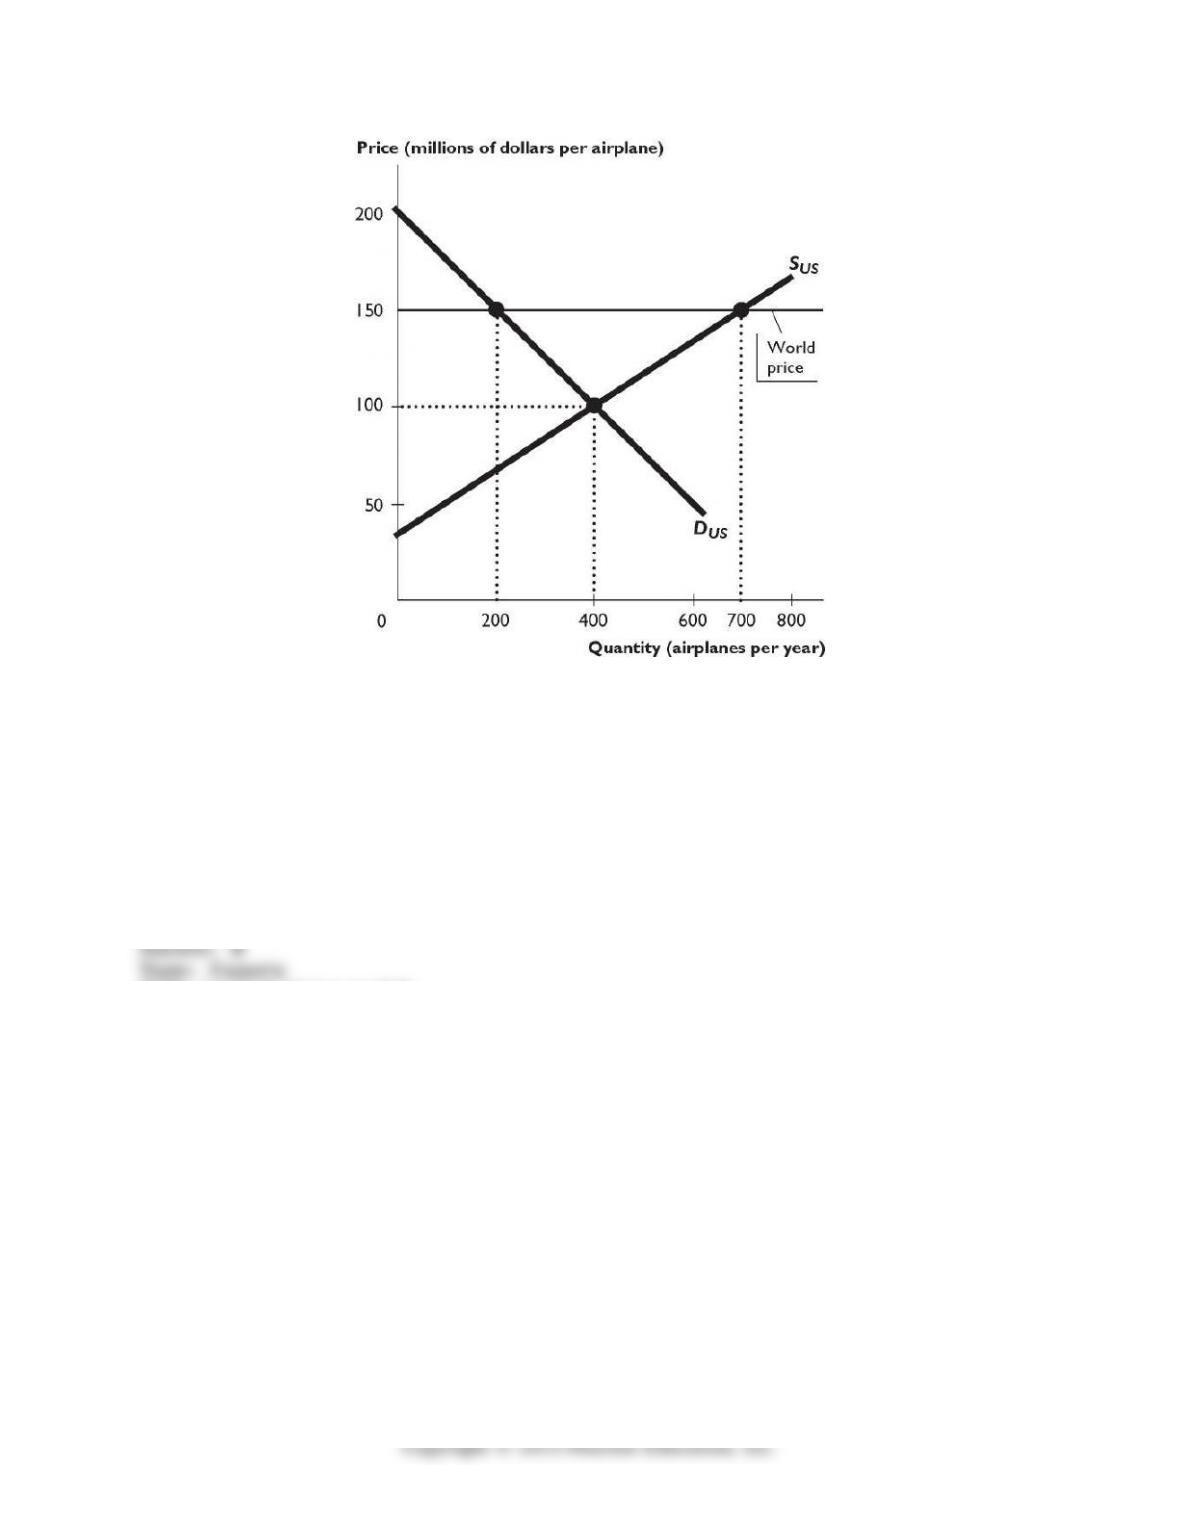
The igure above shows the U.S. market for airplanes, where SUS is the domestic supply
curve and DUS is the domestic demand curve. The United States trades freely with the rest
of the world. The world price of an airplane is $150 million.
4) Based on the igure above, as a result of international trade, U.S. domestic production
________ airplanes per year.
A) decreases by 200
B) increases by 300
C) decreases by 100
D) increases by 500
E) increases by 200
Skill: Level 3: Using models
Section: Checkpoint 18.1
Status: Old
AACSB: Analytical thinking
63
5) In the igure above, U.S. consumers buy ________ airplanes per year at ________ million
per airplane.
A) 200; $150
B) 400; $100
C) 700; $150
D) 400; $150
E) 200; $100
Skill: Level 3: Using models
Section: Checkpoint 18.1
Status: Old
AACSB: Analytical thinking
6) In the igure above, the United States ________ airplanes per year.
A) imports 500
B) exports 500
C) exports 400
D) imports 400
E) exports 200
Skill: Level 3: Using models
Section: Checkpoint 18.1
Status: Old
AACSB: Analytical thinking
64
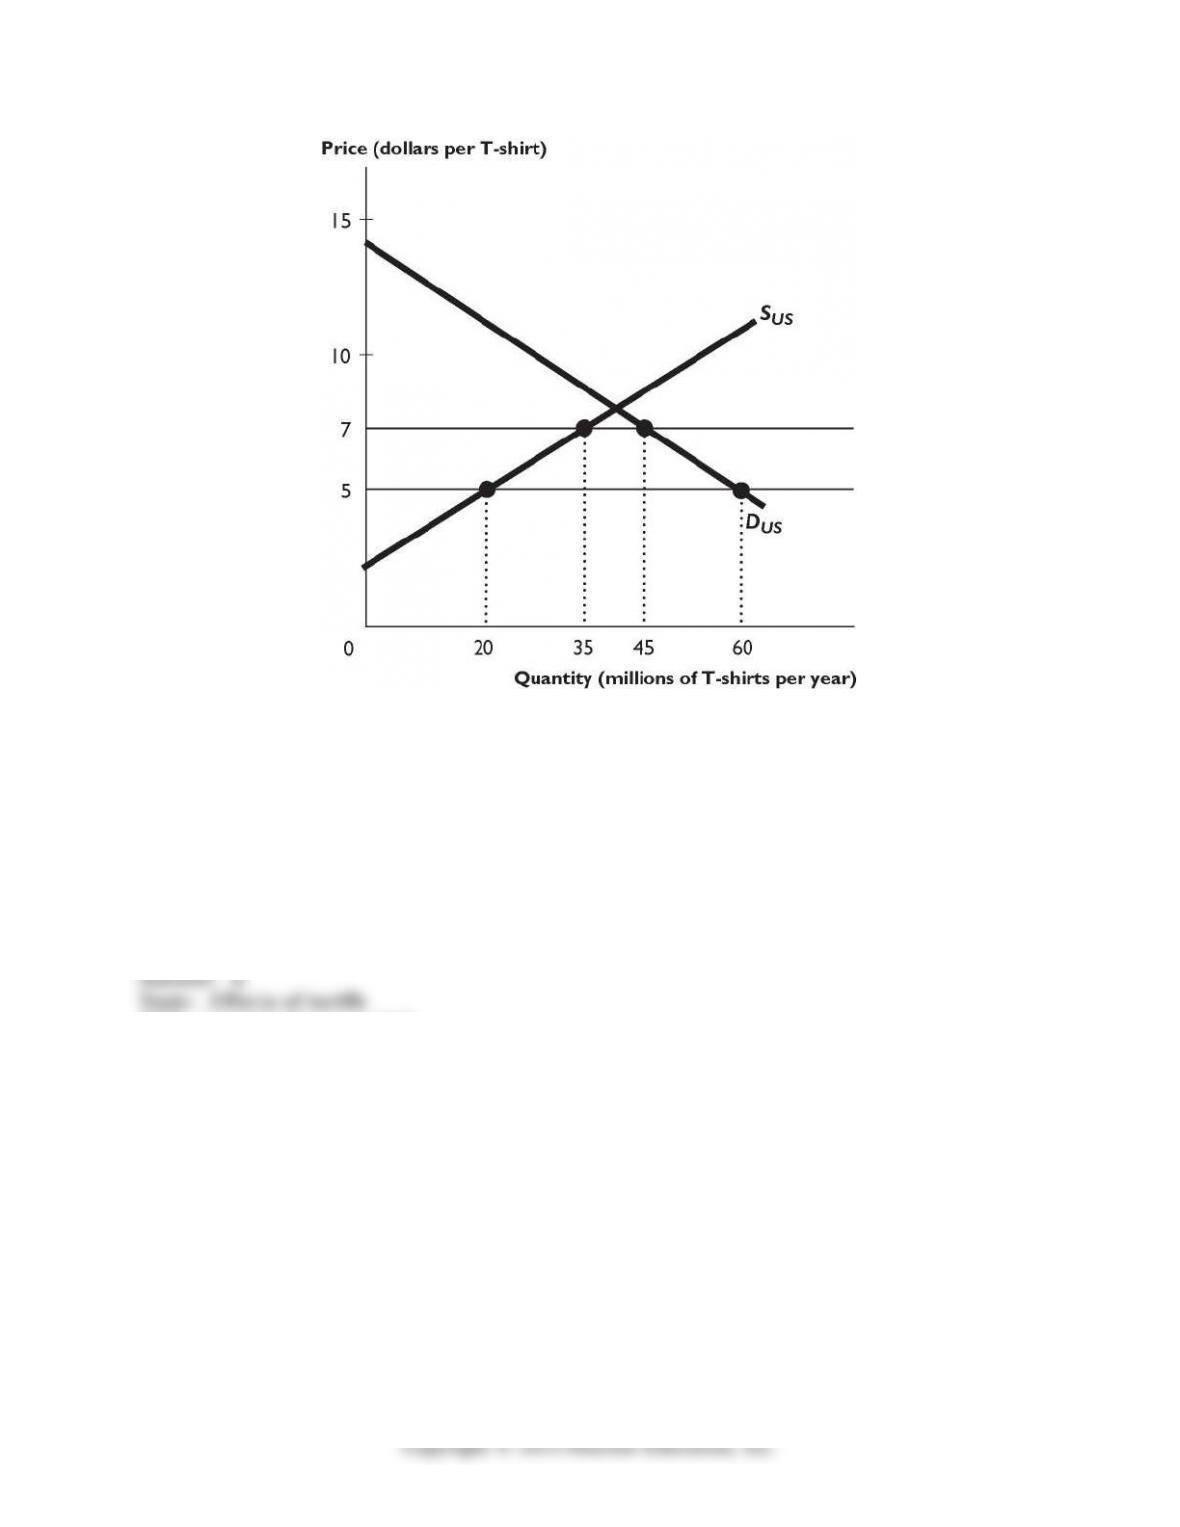
The igure above shows the U.S. market for T-shirts, where SUS is the domestic supply
curve and DUS is the domestic demand curve. The world price of a T-shirt is $5. The U.S.
government imposes a $2 per unit tarif on imported T-shirts.
7) The igure above shows that as a result of the tarif, the price of a T-shirt in the United
States ________, and the quantity of T-shirts bought ________.
A) rises by $2; decreases by 15 million per year
B) rises by $2; increases by 15 million per year
C) falls by $2; increases by 5 million per year
D) does not change; decreases by 5 million per year
E) does not change; does not change
Skill: Level 3: Using models
Section: Checkpoint 18.2
Status: Old
AACSB: Analytical thinking
65
8) The igure above shows that as a result of the tarif, the quantity of T-shirts produced in
the United States ________, and the quantity of T-shirts imported ________.
A) increases by 15 million per year; decreases by 30 million per year
B) increases by 15 million per year; increases by 15 million per year
C) decreases by 15 million per year; decreases by 30 million per year
D) decreases by 30 million per year; increases by 30 million per year
E) does not change; decreases by 15 million per year
Skill: Level 3: Using models
Section: Checkpoint 18.2
Status: Old
AACSB: Analytical thinking
9) The igure above shows that the government revenue from the tarif is
A) $20 million per year.
B) $30 million per year.
C) $15 million per year.
D) $55 million per year.
E) zero.
Skill: Level 3: Using models
Section: Checkpoint 18.2
Status: Old
AACSB: Analytical thinking
18.5 Integrative Questions
1) Assume that the state of Missouri decided to place a tarif on every product produced
outside the state in an efort to increase the state’s revenue and increase employment in
the state. If Missouri did so,
A) the state’s total output would deinitely increase.
B) workers with jobs in new irms replacing out-of-state imports would earn high income.
C) the standard of living within Missouri would decrease.
D) other states would begin to dump in Missouri.
E) the prices of goods imported into Missouri would fall.
Skill: Level 4: Applying models
Section: Integrative
Status: Old
AACSB: Analytical thinking
66
2) During the 1980s, Harley-Davidson, the American motorcycle maker asked Congress for
tarif protection from large motorcycles imported from Japan. Harley-Davidson argued that
their company needed protection so the company could reorganize and, after some time
had passed, could become more competitive. Harley-Davidson’s argument is similar to the
________ argument for protection.
A) save domestic jobs
B) national security
C) anti-dumping
D) infant-industry
E) bring diversity and stability
Skill: Level 4: Applying models
Section: Integrative
Status: Old
AACSB: Analytical thinking
3) In the 1950s, crude oil and natural gas imports were restricted to keep the domestic
industries viable in case of a war. The rationale for this protection is the ________ argument
for protection.
A) save domestic jobs
B) national security
C) anti-dumping
D) infant-industry
E) penalizing lax environmental standards
Skill: Level 4: Applying models
Section: Integrative
Status: Old
AACSB: Analytical thinking
4) In the 1980s, the U.S. government forced Japanese automakers to limit their exports to
the United States. The union representing the autoworkers (UAW), argued that otherwise
the U.S. auto industry would have contracted. The UAW’s argument is the ________
argument for protection.
A) save domestic jobs
B) national security
C) anti-dumping
D) infant-industry
E) bringing diversity and stability
Skill: Level 4: Applying models
Section: Integrative
Status: Old
AACSB: Analytical thinking
67

5) In 2002, President Bush imposed a tarif on imported steel. He did so in response to rent
seeking by
A) domestic steel consumers.
B) domestic steel producers.
C) foreign steel consumers.
D) foreign steel producers.
E) foreign politicians.
Skill: Level 4: Applying models
Section: Integrative
Status: Old
AACSB: Analytical thinking
6) Which of the following is true?
i. Comparative advantage drives international trade.
ii. Compared to a no-trade situation, imports make domestic producers better of.
iii. Tarifs lower the domestic price of imported goods.
A) Only i
B) Only ii
C) Only iii
D) i and ii
E) i and iii
Skill: Level 2: Using deinitions
Section: Integrative
Status: Old
AACSB: Analytical thinking
7) Which of the following is true?
i. When the world price of a good is lower than the price that balances domestic supply
and demand, a country gains from exporting the good.
ii. Compared to a no-trade situation, imports make consumers better of.
iii. Quotas raise the domestic price of imported goods.
A) Only i
B) Only ii
C) Only iii
D) i and ii
E) ii and iii
Skill: Level 2: Using deinitions
Section: Integrative
Status: Old
AACSB: Analytical thinking
68
8) Which of the following is true?
i. Compared to a no-trade situation, exports make consumers better of.
ii. Tarifs make consumers worse of.
iii. Trade is restricted because protection brings small losses to a large number of people
and large gains to a small number of people.
A) Only i
B) Only ii
C) Only iii
D) i and iii
E) ii and iii
Skill: Level 2: Using deinitions
Section: Integrative
Status: Old
AACSB: Analytical thinking
9) When a country imports a good or service from the rest of the world, the consumer gains
because the greater the ________ in price and ________ in quantity bought, the greater is the
________ to the consumer.
A) fall, increase; gain
B) fall; increase; loss
C) fall; decrease; gain
D) rise; increase; gain
E) rise; decrease; gain
Skill: Level 5: Critical thinking
Section: Integrative
Status: New
AACSB: Relective thinking
10) When the proits of irms that produce import-competing goods and services fall, these
irms ________ their workforce, unemployment in these industries ________, and wages
________.
A) expand; increases; rise
B) cut; increases; fall
C) cut; decreases; fall
D) cut; increases; rise
E) cut; decreases; rise
Skill: Level 5: Critical thinking
Section: Integrative
Status: New
AACSB: Analytical thinking
69

11) When a country exports something to the rest of the world, domestic consumers
________ because the greater the ________ in price and ________ in quantity bought, the
greater is the consumers’ loss.
A) win; rise; decrease
B) win; rise; increase
C) lose, rise; decrease
D) lose; fall; decrease
E) lose; rise; increase
Skill: Level 5: Critical thinking
Section: Integrative
Status: New
AACSB: Relective thinking
12) Because the United States does not have a comparative advantage in producing
clothing, a fall in world prices increases imports and ________ U.S. production. U.S.
consumers ________ and U.S. producers ________.
A) decreases; lose; lose
B) increases; gain; lose
C) increases; gain; gain
D) decreases; gain; lose
E) decreases; gain; gain
Skill: Level 5: Critical thinking
Section: Integrative
Status: New
AACSB: Relective thinking
13) Consumers ________ from a tarif because they pay a ________ price to producers so they
purchase a ________ quantity of the good.
A) lose; higher; smaller
B) lose; lower; smaller
C) lose; higher; larger
D) win; higher; smaller
E) win; lower; larger
Skill: Level 5: Critical thinking
Section: Integrative
Status: New
AACSB: Analytical thinking
70