IM – 11 | 1
Chapter 11: Gathering Information and Supporting Materials
Chapter Objectives and Integrator Guide
After reading and thinking about this chapter, students should be able to:
Objective
Resources
1. Explain the challenges of
gathering information in the
digital age.
Key Terms: data, information,
knowledge, information literacy,
information overload, and
information anxiety
In the Text:
Page Reference: pages 225–230
Figure 11.1: The Meaning of Data, Information, and Knowledge
Table 11.1: The Information-Gathering Process
Figure 11.2: A Concept Map Exploring the Topic “College
Students and Healthcare”
Study Question 1 (p. 248)
IM Resources:
Discussion Starter 1: Information Gathering and Information
Anxiety
Activity 11.1: Adapting Supporting Materials
2. Demonstrate knowledge of
the diverse resources
available to you through your
library.
Key Terms: reference librarians,
online library catalog system,
primary source, secondary source,
surveys, statistics
In the Text:
Page Reference: pages 230–236
Table 11.2: Books, Newspapers and Magazines, and Scholarly
Journals
Figure 11.3: Primary Sources Versus Secondary Sources
Table 11.3: Commonly Used Periodical Indexes
Connecting Globally: Finding Reliable and Trustworthy
Statistics (p. 235)
Study Question 2 (p. 248)
IM Resources:
Discussion Starter 2: Grounding Evidence in Journals
Activity 11.2: An Important Tour
Activity 11.3: Researching the Topic
Activity 11.4: Using Statistics
IM – 11 | 2
3. Demonstrate effective use of
the internet for finding
sources of information.
Key Terms: search engine, virtual
library, and seminal sources.
In the Text:
Page Reference: pages 236–239
Figure 11.4: Useful Search Engines and Virtual Libraries
Figure 11.5: A Google Scholar Search for Articles on Texting
While Driving
Table 11.4: Tips for Information about Searching on the Internet
Study Question 3 (p. 248)
IM Resources:
Discussion Starter 3: The Internet and User-Generated Content
Activity 11.5: Fountain of Knowledge
Activity 11.6: Comparing Search Results
Activity 11.7: Digital Scavenger Hunt
4. Explain the ways you can
use practical experience in
gathering information.
Key Terms: personal experience
and expert testimony.
In the Text:
Page Reference: pages 239–242
Study Question 4 (p. 248)
IM Resources:
Discussion Starter 4: Acquiring Practical Experience
Activity 11.8: Expert Interview
5. Evaluate and properly cite
your resources in oral and
written formats.
Key Terms: data triangulation,
bibliographic reference, internal
references, and oral citations.
In the Text:
Page Reference: pages 242–247
Challenge Yourself: I am familiar with good habits for finding
and evaluating sources, but how do I know if I’ve chosen the
best sources? How do I know when I can stop seeking new
information? (p. 242)
Table 11.5: Criteria for Testing Source Credibility
Table 11.6: Proper APA and MLA References
Figure 11.6: Oral Citations for Newspaper Articles, Journal
Articles, Websites, and Interviews
Study Question 5 (p. 248)
Skill Builder: Practice Proper Oral Citations (p. 246)
IM Resources:
Discussion Starter 5: Evaluating Evidence
Activity 11.9: Credibility of Others
Additional Resources:
Chapter 11 Mini-Prezi on Getting the Most out of a Scholarly
Journal Article Source (http://tinyurl.com/rcharticle)
IM – 11 | 3
Chapter Outline
I. Gathering Information in a Digital World
A. Data, information, and knowledge
iii. Knowledge is information and the meaning we attach to
information.
B. Information literacy
i. Information literacy is the ability to locate, evaluate, and incorporate
important information into your own knowledge base.
C. Information overload and information anxiety
i. Information overload is the experience of having more data and
information than you have the capacity to process in a given time
period.
ii. Information anxiety is the stress caused by an inability to access,
understand, or process information that is necessary to your goal or
the task at hand.
D. The information-gathering process
i. Define the problem: before you begin, define your information
problem(s) and consider your goals.
1. Concept maps help in exploring the diverse sub-dimensions
of a topic before searching for information.
ii. Use diverse strategies: Use a range of search techniques and
terms and you will find sources that you may not have otherwise
sought out.
iii. Scan and evaluate the information: For each source that contains
information relevant to your problem, scan that source to determine
what you can use.

IM – 11 | 4
iv. Integrate the information: Return to your chosen sources and
process how the information in each source relates to your existing
knowledge or understanding of the topic.
v. Organize the information: Consider how the various pieces of
II. Gathering Information from Library Resources
Reference librarians are people specially trained in finding and evaluating
A. Use books, articles, and periodicals
i. An effective information search makes use of a variety of sources.
ii. As you research, focus on the most reliable information you can
find.
iii. Keep in mind the differences between primary and secondary
sources of information.
1. A primary source is original source material or research,
2. A secondary source is a source of information that builds on
or comments on another’s material or research. One
example is a newspaper article’s summary of a primary
source.
iv. When talking about evidence from primary or secondary sources,
be careful in any conclusions that you draw, and use soft
statements, like:
2. “This study implies…:” or
3. “This study provides some indication that…”
B. Use electronic databases
i. Many libraries invest in computer programs that give cardholders
full remote access to electronic databases and subscriptions.
C. Use surveys and statistics as evidence
IM – 11 | 5
i. Surveys are studies that ask a sample of the population a limited
number of questions to discover public opinions on a set of issues.
1. How trustworthy is the survey source?
2. How broad was the sample?
3. Who was included in the survey?
ii. Statistics are numbers used to summarize information or compare
quantities.
2. When you use statistics in a presentation, simplify them,
explain them, and translate them for your audience.
3. Illustrate your numbers by using visual resources, such as
pie charts, line graphs, and bar graphs.
III. Gathering Information from the Internet
A. Use search engines and virtual libraries
i. A search engine is a website that is used specifically to search for
B. Use Google Scholar
i. As a beginning researcher, you might struggle to locate the sources
most critical to your topic. Google Scholar helps in locating seminal
sources.
ii. Seminal sources are foundational studies or pieces of information
that have been heavily cited and have helped advance a line of
scholarly inquiry.
C. Use internet search tools and resources: a general understanding of
search engine logic and functions will help you limit your searches to the
most relevant sources.
IV. Gathering Information through Personal Experience and Independent
Research
A. Experience your topic
i. Relating personal stories and experiences can make for compelling
evidence.
ii. Be careful in using personal experiences if your experiences are
unusual
iii. One way to gain personal experience is to volunteer for an
organization with goals related to your general speech topic.
B. Conduct independent research
i. Another way to become more directly involved with your topic is to
conduct independent research, perhaps in the few minutes before
class begins.
ii. If you do not have strong, direct experience with your topic, you can
engage in independent research by interviewing an expert.
V. Evaluating, Citing, and Documenting your Sources
A. Evaluate sources of information
ii. Apply consistent criteria to test the credibility of sources:
1. Are there clear markers of credibility for the source?
2. Is the source objective?
3. Does the source draw appropriate conclusions?
4. Is the information in the source current?
B. Avoid plagiarism
i. Be clear about where you found the evidence you use in your
outline.
ii. To avoid plagiarism, you must document your sources
appropriately in three places:
1. The reference list for your speech presentation (or paper)
a. An effective bibliographic reference is the complete
2. The body of your written work through use of parenthetical
and in-text citations
IM – 11 | 7
© 2019 by McGraw-Hill Education. This is proprietary material solely for authorized instructor use. Not authorized for sale or distribution in any
manner. This document may not be copied, scanned, duplicated, forwarded, distributed, or posted on a website, in whole or part.
b. Internal references allow people to know what
evidence comes from which specific sources on your
reference list.
3. The oral delivery of your speech
a. Oral citations make specific reference, where
appropriate, to each source of information as you
present them during your speech.
b. An effective oral citation provides the following three
pieces of information:
i. The author(s) of the piece
c. These pieces of information provide your audience
members enough information to locate your sources if
they want to examine your evidence in greater depth.
IM – 11 | 8
Discussion Starters
1. Information-Gathering and Information Anxiety: Have you ever been
overwhelmed by the sheer amount of data you found while researching for a paper
or a presentation? What steps did you take to avoid information anxiety? The
2. Grounding Evidence in Journal Articles: The chapter recommends that you use
scholarly journal article sources to understand current research about a topic.
Journal articles can sometimes be difficult to read and understand. What tips would
you share with the class for processing information from journal article sources?
Why do journal article sources provide more scholarly evidence than popular press
3. The Internet and User-Generated Content: While the internet makes it easier to
locate scholarly, peer-reviewed journal article sources, it also provides a lot of user-
4. Acquiring Practical Experience: How might acquiring practical experience related
to your topic help you to think about it in new and different ways? How do you think
5. Evaluating Evidence: Once you have located a source you would like to use, how
should you evaluate it for credibility? What markers might lead you to evaluate a

IM – 11 | 9
Activities
ACTIVITY 11.1 ADAPTING SUPPORTING MATERIALS
Purpose: Students should be able to discuss factors that affect the choice of evidence
and supporting materials, to analyze the sources and content of evidence in relationship
to a specific audience, and to decide what types of evidence will be most credible to an
audience.
Procedure: Distribute the “Would You Use This Material?” form (on the next page), and
have each student complete one.
The students should explain the reasons for their predictions about using the supporting
material. They should be able to justify their predictions about audience interest with
specific references to audience analysis, as well as to ideas about how they can help
turn the information into usable knowledge for the audience. For example, if many of the
students in the class major in science or engineering, a student may have inferred that
the class would prefer statistical or research findings. The students should also decide
whether it is possible to separate the type of supporting material from the content of the
evidence. For example, would audience members accept surveys only from competent
Debriefing: This activity illustrates some of the decisions that a speaker must make in
presenting supporting materials. The use of audience analysis is demonstrated in the
IM – 11 | 10
WOULD YOU USE THIS MATERIAL?
Examine the supporting materials listed. Using the information gained from your
previous analysis of the class as an audience, decide which materials would be
appealing or unappealing to your classmates. Be prepared to justify your answers.
Appealing
Unappealing
_________
_________
1.
Pictures and illustrations of junk food
_________
_________
2.
A quotation against smoking from a local
physician
_________
_________
3.
A survey of the smoking habits of your class
_________
_________
4.
An interview with a drug counselor about
drug abuse
_________
_________
5.
Your personal experience as a camp
counselor
_________
_________
6.
A research study of the dating habits of
college students
_________
_________
7.
Statistical summaries of the most popular
records in the last decade
_________
_________
8.
The percentage of your classmates who are
living off campus
_________
_________
9.
A bar graph showing how much money can
be saved by buying savings bonds
_________
_________
10
.
Testimony from six students about the cost
of owning a car
IM – 11 | 11
ACTIVITY 11.2 AN IMPORTANT TOUR
Purpose: Students should be able to secure knowledge of the library to utilize research
necessary for effective speechmaking.
Procedure: Plan a tour of the campus library with a reference librarian who coordinates
such events. As the tour progresses, students should be encouraged to take specific
notes on locations of potential resources for their public speeches.
Debriefing: This activity is valuable to beginning students who use the internet for their
research and haven’t explored the resources found in the library. The possible
IM – 11 | 12
ACTIVITY 11.3 RESEARCHING THE TOPIC
Purpose: Students should be able to identify the primary and secondary sources for
research into a specific topic, to prepare a bibliography of several different resources,
and to demonstrate a familiarity with library and internet sources by researching a
specific topic.
Procedure: Tell the students to select a topic of limited scope and then write a
statement of immediate purpose for the topic. They should then prepare a bibliography
of primary and secondary sources for the topic. The bibliography should include
references from encyclopedias, newspapers, journals, popular magazines, websites,
Debriefing: This activity is designed to acquaint the students with a variety of source
materials available. The students also gain practice in using resources to research a
topic. The material gathered for this activity may be used as resource materials for a
classroom speech.
IM – 11 | 13
ACTIVITY 11.4 USING STATISTICS
Purpose: Students should be able to define the statistical terms used to summarize or
describe numerical data, to derive statistical data from raw numbers or information, and
to decide which statistics are best suited for presenting certain types of information.
Procedure: Distribute the following “Which Statistic Do I Use?” form to each student to
answer individually. The students may refer to the text as often as necessary to answer
the questions.
WHICH STATISTICS DO I USE?
1. If you had all the grades for all the seniors at two major universities, how would you
compare the abilities of the students at the two schools?
2. The price of new cars in the United States rose from an average of $4,000 in 1970 to
$5,000 in 1978. How would you present this information?
3. What statistics would be most relevant if you were trying to tell your classmates how
they compared to each other on a 50-point examination?
4. Assume that there were 456,786 deaths and 478,269 births in the United States last
year. How would you inform the audience of the growth or decline of the population?
5. A survey shows that 35 of 50 students prefer the quarter system and that the other
15 students prefer the semester system. How would you inform the audience of the
students’ preferences?
6. If the numbers in the following list indicate the number of people in the immediate
7. How would you indicate the variance in temperatures in your state in the last 30
years?
The correct answers to the questions follow. Discuss the answers with the students and
then have them explain the reasons for their own answers. If they disagree or do not
understand the reasons for using one statistic over another, have them answer with
different measures to see which is best understood by the audience. The students
should be able to define each of the statistical terms and to discuss its uses in
summarizing and describing data. They should also be able to point out ways in which
statistics can be used to mislead an audience.
IM – 11 | 14
Answers:
1. Use the grade point mean, or average, for each school. If the schools were very
3. The mean would be most important, although the range and mode would be helpful.
4. Large numbers are confusing and hard to remember, and raw numbers should be
6. The mode is the correct answer: 3.
7. The range is the most useful way to indicate variance. The range should also be
compared with the average range to indicate its variance from normal temperatures.
Debriefing: This activity allows students to practice adapting supporting materials to a
specific audience. It also familiarizes them with the use of statistical data, which may be
IM – 11 | 15
ACTIVITY 11.5 FOUNDATION OF KNOWLEDGE
Purpose: Students should be able to realize the value of exploring library resources to
discover various facets of information.
Procedure: Divide the class into small groups of five to seven students. Instruct them
that they have approximately thirty minutes in which to discover answers to questions
SAMPLE QUESTIONS
1. Who wrote The Feminine Mystique?
2. Where would I find an illustration of the number of professors in higher education in
1989?
3. What are the reference materials written by James C. McCroskey?
4. Who was the originator of the phrase “A penny saved is a penny earned”?
5. How much did the Chrysler Corporation earn in profits in 1988?
6. In 1989, which periodicals addressed teacher shortages?
8. Cite the recent books/journal articles by communication researcher Gerald Miller.
9. Who was the first black college graduate in the United States and from what school
did he/she graduate?
10. What are the underlying principles guiding Amnesty International?
This activity is an excellent follow-up to activity 11.2. The groups should be encouraged
to address how they went about gathering answers and discuss some of the ways in
which the task was easy as well as difficult.
Debriefing: This activity illustrates that information is not always found in the customary
IM – 11 | 16
ACTIVITY 11.6 COMPARING SEARCH RESULTS
Purpose: This activity teaches students the difference between types of search tools
and corresponding types of sources returned from various search tools.
Procedure: Divide students into groups of three to five people, and assign each group
a current event topic that is broad enough that newspaper/magazine articles, academic
journal articles, and books can be found on the topic. Each group should use four types
Debriefing: This activity teaches students how to devise a research strategy for finding
IM – 11 | 17
ACTIVITY 11.7 DIGITAL SCAVENGER HUNT
Purpose: This activity teaches students how to use the internet to quickly find diverse
types of information.
Procedure: Reserve a campus computer lab and tell students to meet at the lab for this
class period. Divide students into groups of three or four people and provide them with
DIGITAL SCAVENGER HUNT
Below are seven questions about factual information. You should carefully read each
question and then use the internet to locate answers. All information can be found from
1. Who are the two U.S. Senators from Delaware? What are their political party
affiliations?
2. In the year 2002, what was the overall life expectancy at birth for a person born in
the United States?
3. What is the average depth of Lake Erie and how many states in the US border the
lake?
4. In what continent is the country of Suriname located, and when did Suriname gain
independence from the Netherlands?
5. What percentage of people in Bangladesh are Muslim?
6. Who was the general manager of the Ford Motor Company when the Mustang was
introduced in 1965?
7. What is the estimated population for the state of Nebraska in 2003?
Answers:
2. 77.3 years, according to the National Center for Health Statistics
4. South America, Nov 25, 1975 according to the CIA World Fact Book
6. Lee Iacocca according to Musclecarclub.com
7. 1,739,291 according to Fedstats.gov
Debriefing: The digital scavenger hunt provides students with an opportunity to use
various types of internet resources to locate specific types of information. The
IM – 11 | 18
ACTIVITY 11.8 EXPERT INTERVIEW
Purpose: Students should be able to recognize the value of interviewing and utilizing
information gleaned from an interview for a public speech.
Procedure: Divide the class into dyads and instruct them to choose a speech topic
found in chapters 13 or 14 of the text. Each dyad is to conduct an interview based on
the chosen topic. As a team, the individuals should discuss some potential questions
Debriefing: This activity relates directly to the information on interviewing in chapter 9
and demonstrates that researching a speech topic can happen outside of the library.
IM – 11 | 19
ACTIVITY 11.9 CREDIBILITY OF OTHERS
Purpose: Students should be able to identify sources that are highly credible to them,
to name the factors that affect credibility, and to discuss why credibility is a function of
the audience and not the speaker.
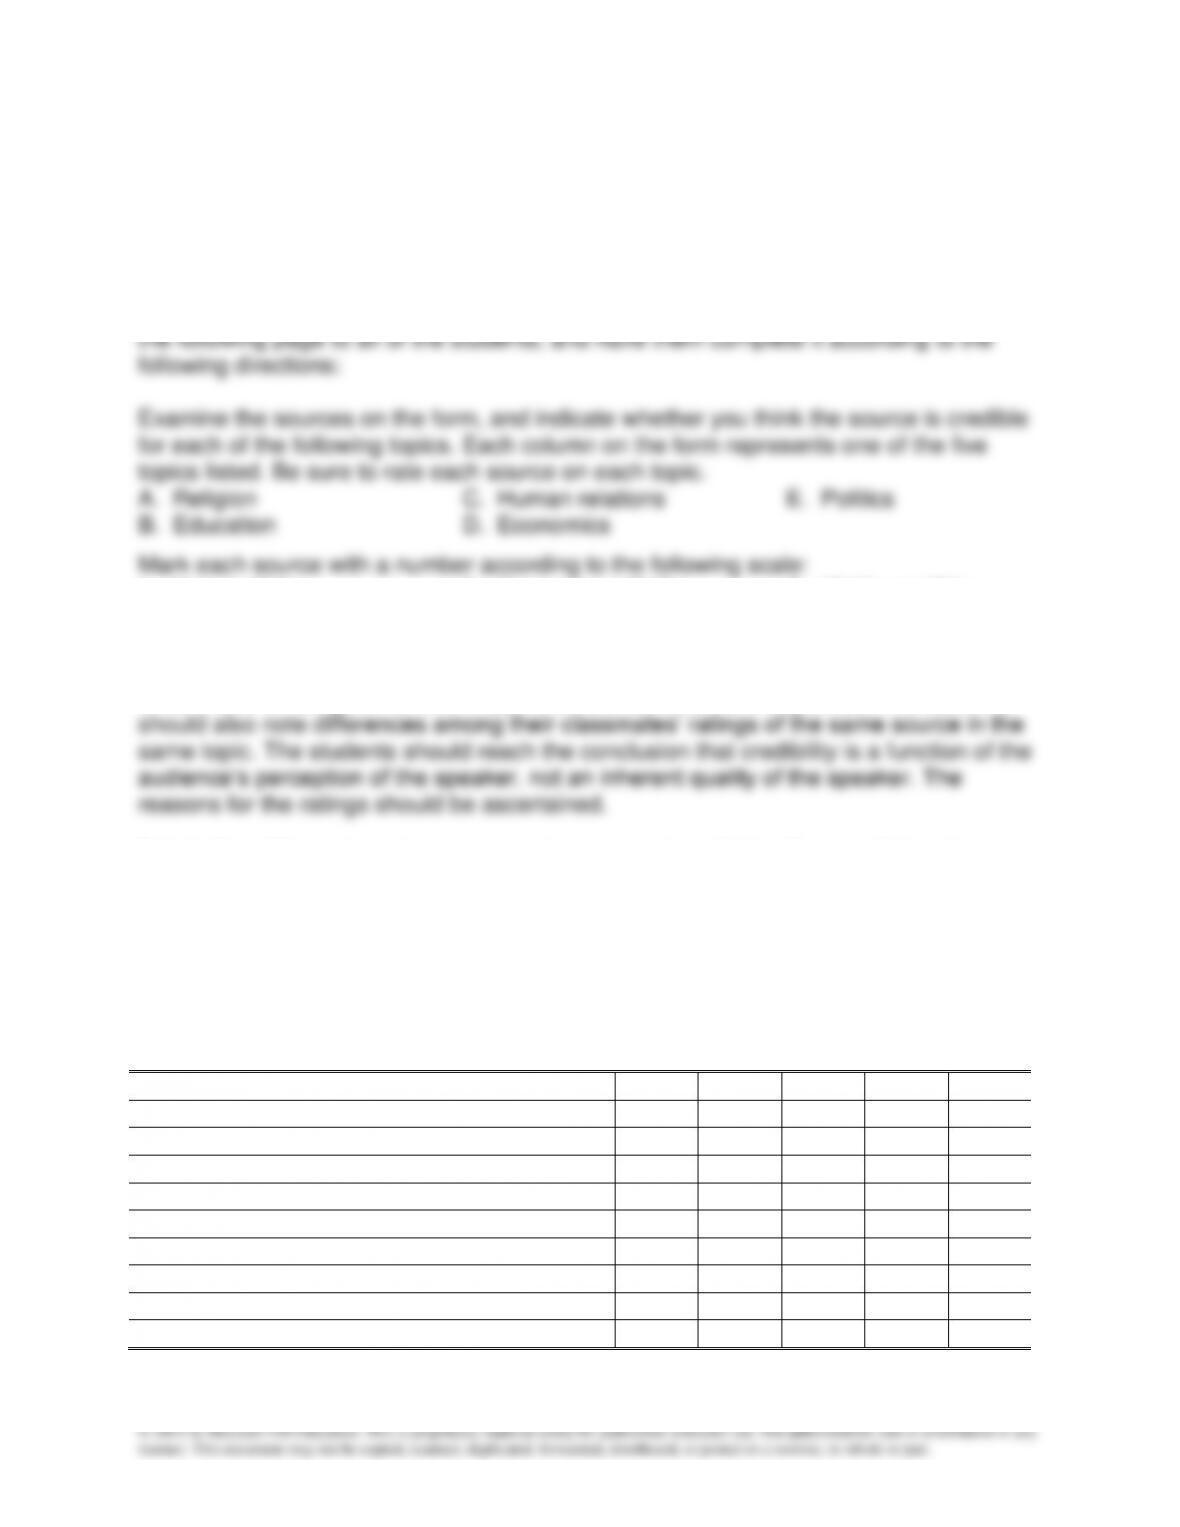
Procedure: Distribute copies of the “How Credible Are These Sources?” form found on
1. Not credible 2. Average credibility 3. Highly credible
When everyone has completed the form, ask for a show of hands and sum up the
ratings on the board. The students should compare the ratings of each source by topic.
Differences in ratings on different topics should be noted and explained. The students
Debriefing: This activity demonstrates the nature of credibility. The credibility of a
speaker varies with the topic and with the attitudes, beliefs, and experiences of the
audience. This activity can also provide the student speaker with insights into the
classroom audience’s attitudes toward different authority figures, information that is
useful in determining appropriate sources of the supporting materials, and evidence to
be used in informative and persuasive speeches.
HOW CREDIBLE ARE THESE SOURCES?
A
B
C
D
E
Your father
Your speech teacher
A philosophy teacher
A millionaire
A medical doctor
Your university president
A small-business person
Your state senator
A psychiatrist