McDaniel & Gates – Marketing Research, 9th Edition Instructor’s Manual
The following table lists four factors produced from a study of cable TV viewers. What
label would you put on each of these factors? Why?
See the text for the table.
• Factor 1 Variety of programming or repetitive programming. All of the questions deal with the
movie channels playing the same movies over and over again.
7. The following table is a discriminant analysis that examines responses to various
attitudinal questions from cable TV users, former cable TV users, and people that have
never used cable TV. Looking at the various discriminant weights, what can you say about
each of the three groups?
For “users,” the most discriminating variables are A19 (easygoing on repairs) and A18 (no repair
service). For “formers,” the most discriminating variables are A4 and A18 (burned out on repeats
8. The following table shows regression coefficients for two dependent variables. The first
dependent variable is willingness to spend money for cable TV. The independent variables
are responses to attitudinal statements. The second dependent variable is stated desire
never to allow cable TV in their homes. By examining the regression coefficients, what can
you say about persons willing to spend money for cable TV and those that will not allow
cable TV in their home?
McDaniel & Gates – Marketing Research, 9th Edition Instructor’s Manual
WORKING THE NET
1. For a demonstration of TwoStep cluster analysis using a scalable cluster analysis
algorithm, visit: www.spss.com/spss/data_analysis.htm
Experiences will vary
2. For some easy to digest and comprehensive information on multivariate analysis,
visit http://core.ecu.edu/psyc/wuenschk/spss/SPSS-MV.htm
Experiences will vary
REAL-LIFE RESEARCH
Case 18.1 – Satisfaction Research for Pizza Quik
Key Points:
• Pizza Quik wants to know what performance factors define quality for their customers, which
of these factors are most important to their customers, and how well Pizza Quik delivers these
quality factors.
o
Questions
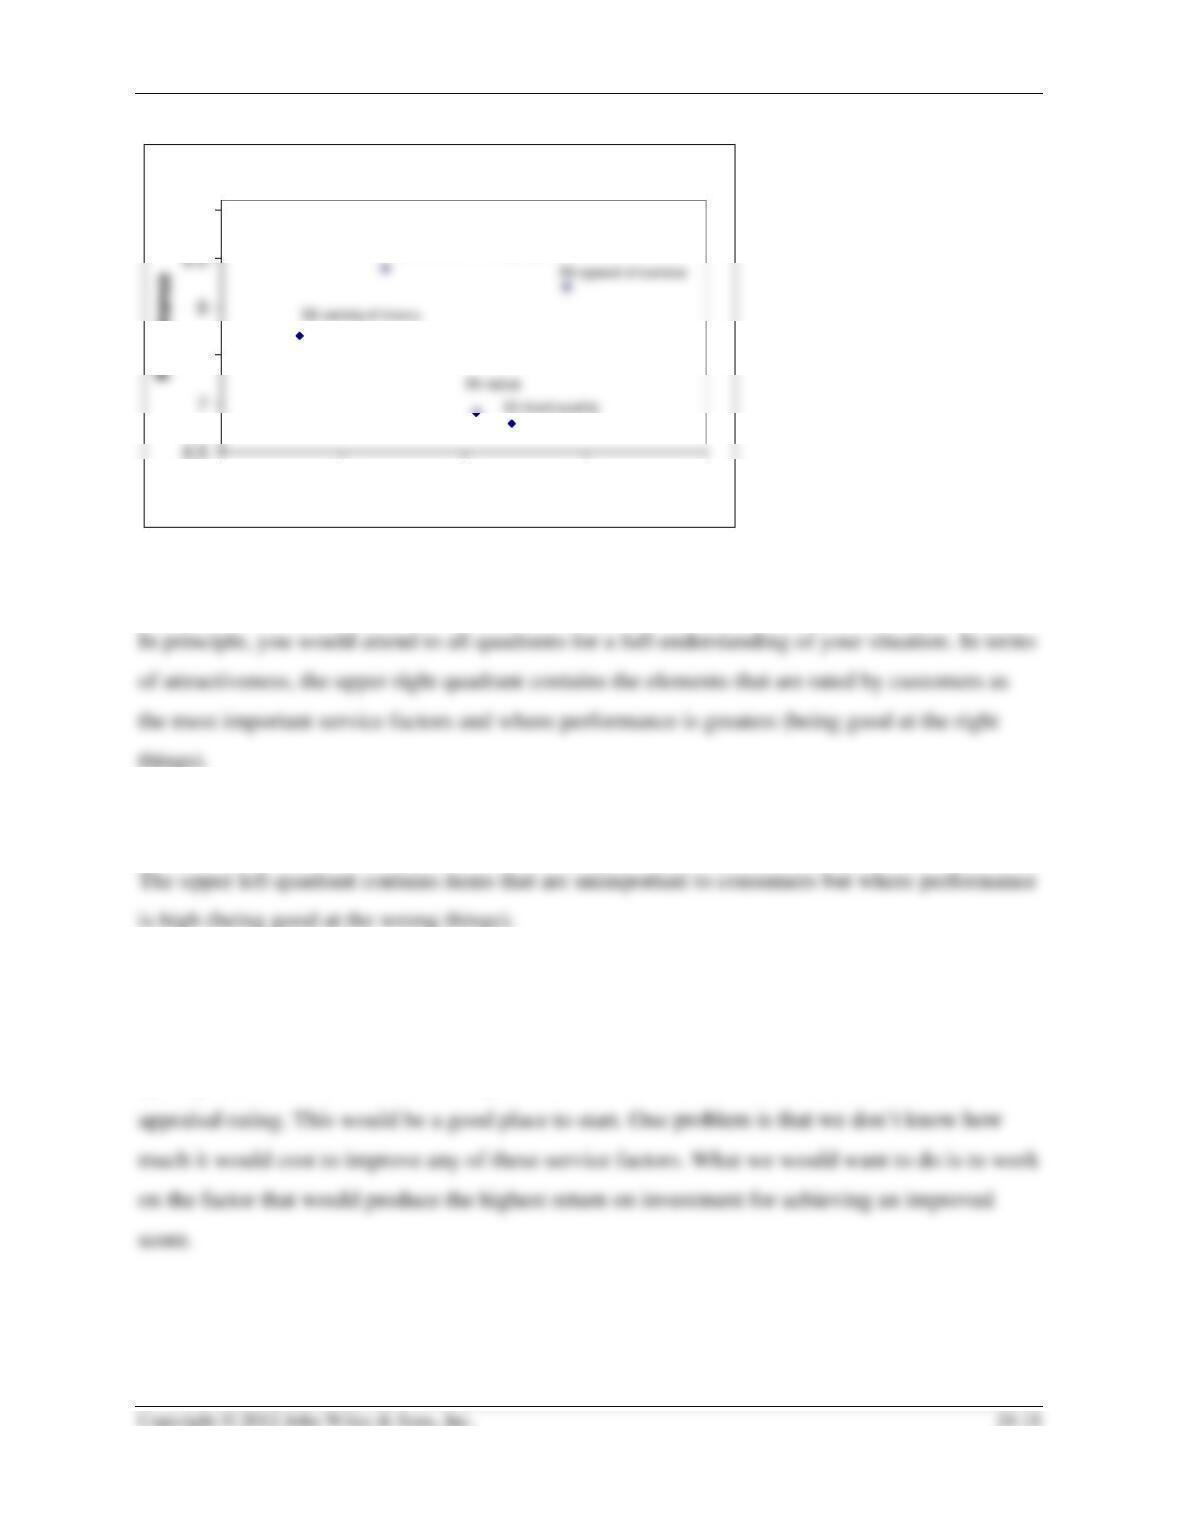
1. Plot the importance and performance scores in a matrix. One axis would be importance
from low to high, and the other would be performance from low to high.
McDaniel & Gates – Marketing Research, 9th Edition Instructor’s Manual
2. Which quadrant should you pay the most attention to? Why?
3. Which quadrant or quadrants should you pay the least attention to? Why?
4. Based upon your analysis, where would you advise the company to focus its efforts?
What is the rationale behind this advice?
Quality of food is the second most important service factor and holds the lowest customer
Case 18.2 – Custom Car Wash Systems
Key Points:
Quadrant Analysis
X1-food quality
7.5
X2-variety of menu
X5-speed of service
9
0 0.2 0.4 0.6 0.8
Importance
X3-friendliness of employees
McDaniel & Gates – Marketing Research, 9th Edition Instructor’s Manual
• Custom Car Wash Systems franchises car washes through the United States. It runs a national
marketing and advertising program.
• Custom feels an upcoming campaign should target the heavy user market, which refers to
heavy car wash users who are individuals that have their cars washed at a car wash facility
Questions
1. What would you tell Bahn about the importance of each of the predictor variables?
2. What recommendations would you make to him about the type of people Custom should
target, based on its interest in communicating with heavy users?
APPENDIX: UNITED WIRELESS COMMUNICATIONS DATA SET – from an actual
survey (p 638-640):
1. Research Objectives
2. Methodology
3. Description of Data Set
4. Wireless Survey
ROLE OF MARKETING RESEARCH IN THE ORGANIZATION AND ETHICAL
ISSUES
McDaniel & Gates – Marketing Research, 9th Edition Instructor’s Manual
Marketing Research across the Organization
1. The question of data interpretation is not fully resolved in business today. Someone must
still look at the data and decide what they really mean. Often this is done by the people in
marketing research. Defend the proposition that persons in engineering, finance, and
production should interpret all marketing research data when the survey results affect
their operations. What are the arguments against this position?
Functional managers certainly should have the opportunity to review the analysis and
conclusions of all research that affects their area of operations. If they have skilled analysts on
2. Marketing research data analysis for a large electric utility found that confidence in the
abilities of the repair person is the customers’ primary determinant of the satisfaction or
dissatisfaction with the electric utility. Armed with these findings, the utility embarked on a
major advertising campaign extolling the heroic characteristics of the electric utility
repairperson. The repair people hated the campaign. They knew they couldn’t live up to
the customer expectations created by the advertising. What should have been done
differently?
A promotional campaign that creates unrealistic expectations in consumers is not only a problem
for the repair people, it is also likely to lead to customer dissatisfaction. The best customer
3. When marketing research is used in strategic planning, it often plays a role in
determining long-term opportunities and threats in the external environment. Threats, for
example, may come from competitors’ perceived future actions, new competitors,
governmental policies, changing consumer tastes, or a variety of other sources.
Management’s strategic decisions will determine the long-term profitability, and perhaps
even the survival, of the firm. Most top managers are not marketing researchers or
statisticians; therefore, they need to know how much confidence they can put into the data.
Stated differently, when marketing researchers present statistical results, conclusions, and
recommendations, they must understand top management’s tolerance for ambiguity and
imprecision. Why? How might this understanding affect what marketing researchers
McDaniel & Gates – Marketing Research, 9th Edition Instructor’s Manual
present to management? Under what circumstances might the level of top management’s
tolerance for ambiguity and imprecision shift?
Some top managers are “put off” by what they perceive as the subjectivity or manipulability of
marketing research data and analysis. The challenge is to match the presentation of information
to the target audience, in this case – top managers and strategic planners. This is a marketing
Ethical Dilemma
1. Is the use of branded black box models unethical?
It is no more unethical than offering a branded box of laundry soap. The purpose of branding is
to allow consumers to identify a unique product and to be able to locate products that have
2. Should marketing research suppliers be forced to explain to clients how their
proprietary models work?
Should Microsoft be required to explain to their customers how Windows works? All that most
of us care about is that it does work. We really don’t need to know just how it works. If all
3. Should firms be required by law to conduct validity and reliability tests on their models
to demonstrate that they are better than nonproprietary models?
Should an attorney be required to objectively prove that s/he is more capable than all other
attorneys to be “deserving” of gaining any clients? Are surgeons required to demonstrate that
SPSS EXERCISES FOR CHAPTER 18
EXERCISE 1: Multivariate Regression
1. Go to the Web site for the text and download the Movie database.
2. Open the database in SPSS and view the variables under Variable View. We will be
using the independent variables Q2, Q4, Q6, Q8a, Q8b, Q9, Q10, Q12, and Q13 to predict
the dependent variable Q3. We are including the variables Q4 and Q6 as is. Strictly
speaking, is this proper? What might you want to do instead and why? Why might you
decide to leave the variable in bins instead? Would it ever be proper to use a variable like
Q11 as is?
Q4 and Q6 are ordinal scaled, whereas regression requires metric scaled predictors. The
3. Go to analyze/descriptive statistics/descriptives and move Q3, Q2, Q4, Q6, Q8a, Q8b,
Q8c, Q8d, Q9, Q10, Q12, and Q13 to the Variable(s) box and click OK. Multivariate
techniques require that every variable have a legitimate value. If a respondent did not
answer every question, then the analyst must either ignore the observation entirely or
impute estimates for the missing values. The default for statistical software is to ignore
those observations automatically. We will not do imputation for this exercise.
a. What will be the sample size for later multivariate techniques?
McDaniel & Gates – Marketing Research, 9th Edition Instructor’s Manual
442
b. Is this sample size large enough for multivariate regression?
The rule of thumb is 10-15 data points per predictor. Here we would have 442/11 = 40.2 and thus
we are in good shape.
c. What would some possible problems be if the sample size were not large enough?
You would have to relax the requirements for precision, either accept a lower level of confidence
d. Are the minimum and maximum values for each variable within the proper
range?
A value that is out of range would indicate either a data input error or a user-defined missing
e. Are all the variables within the proper range?
No. Q6 has a maximum value of 7, compared to the proper range of 0-4. Q9 and Q10 have
maximum values of 5 and 6, respectively, yet the proper range for both is 1-4. Q12 should only
4. Go to analyze/regression/linear.
Move Q3 to Dependent
Move Q2, Q4, Q6, Q8a, Q8b, Q8c, Q8d, Q9, Q10, Q12, and Q13 to Independent(s).
Change Method to Stepwise
Click OK
a. Which independent variables did the stepwise regression select? Why not the
rest?
McDaniel & Gates – Marketing Research, 9th Edition Instructor’s Manual
b. Is each variable chosen significant?
Yes.
c. Are the variables that have not been chosen necessarily insignificant?
d. Is the model significant?
Using the three selected variables, the model accounts for 17.2 % of the observed variation in the
dependent variable (Q3).
e. Does this method guarantee that you will get the “best” model?
Depends on how you define “best.” If “best” refers to the most valid model, then the answer is
5. Go to analyze/descriptive statistics/descriptives and remove Q6, Q8a, Q8b, Q8c, Q8d,
Q9, Q10, and Q12 from the Variable(s) box, so that only Q3, Q2, Q4, and Q13 remain in
the box and then click OK.
What is the sample size now?
6. Go to analyze/regression/linear
Move Q3 to Dependent
McDaniel & Gates – Marketing Research, 9th Edition Instructor’s Manual
Remove Q6, Q8a, Q8b, Q8c, Q8d, Q9, Q10, and Q12 from Independent(s) so that only Q2,
Q4, and Q13 remain.
Change Method to Enter
Click OK
a. How and why does this model differ from the model based on stepwise
regression?
b. Which model is better?
Neither model is “better” – they are the same. The R2 for this model is .174 (i.e., it explains
INTERPRETATION
1. How does stated importance affect the number of times one attends movies?
2. How does spending money on snacks affect the number of times one attends movies?
3. How does student classification affect the number of times one attends movies?
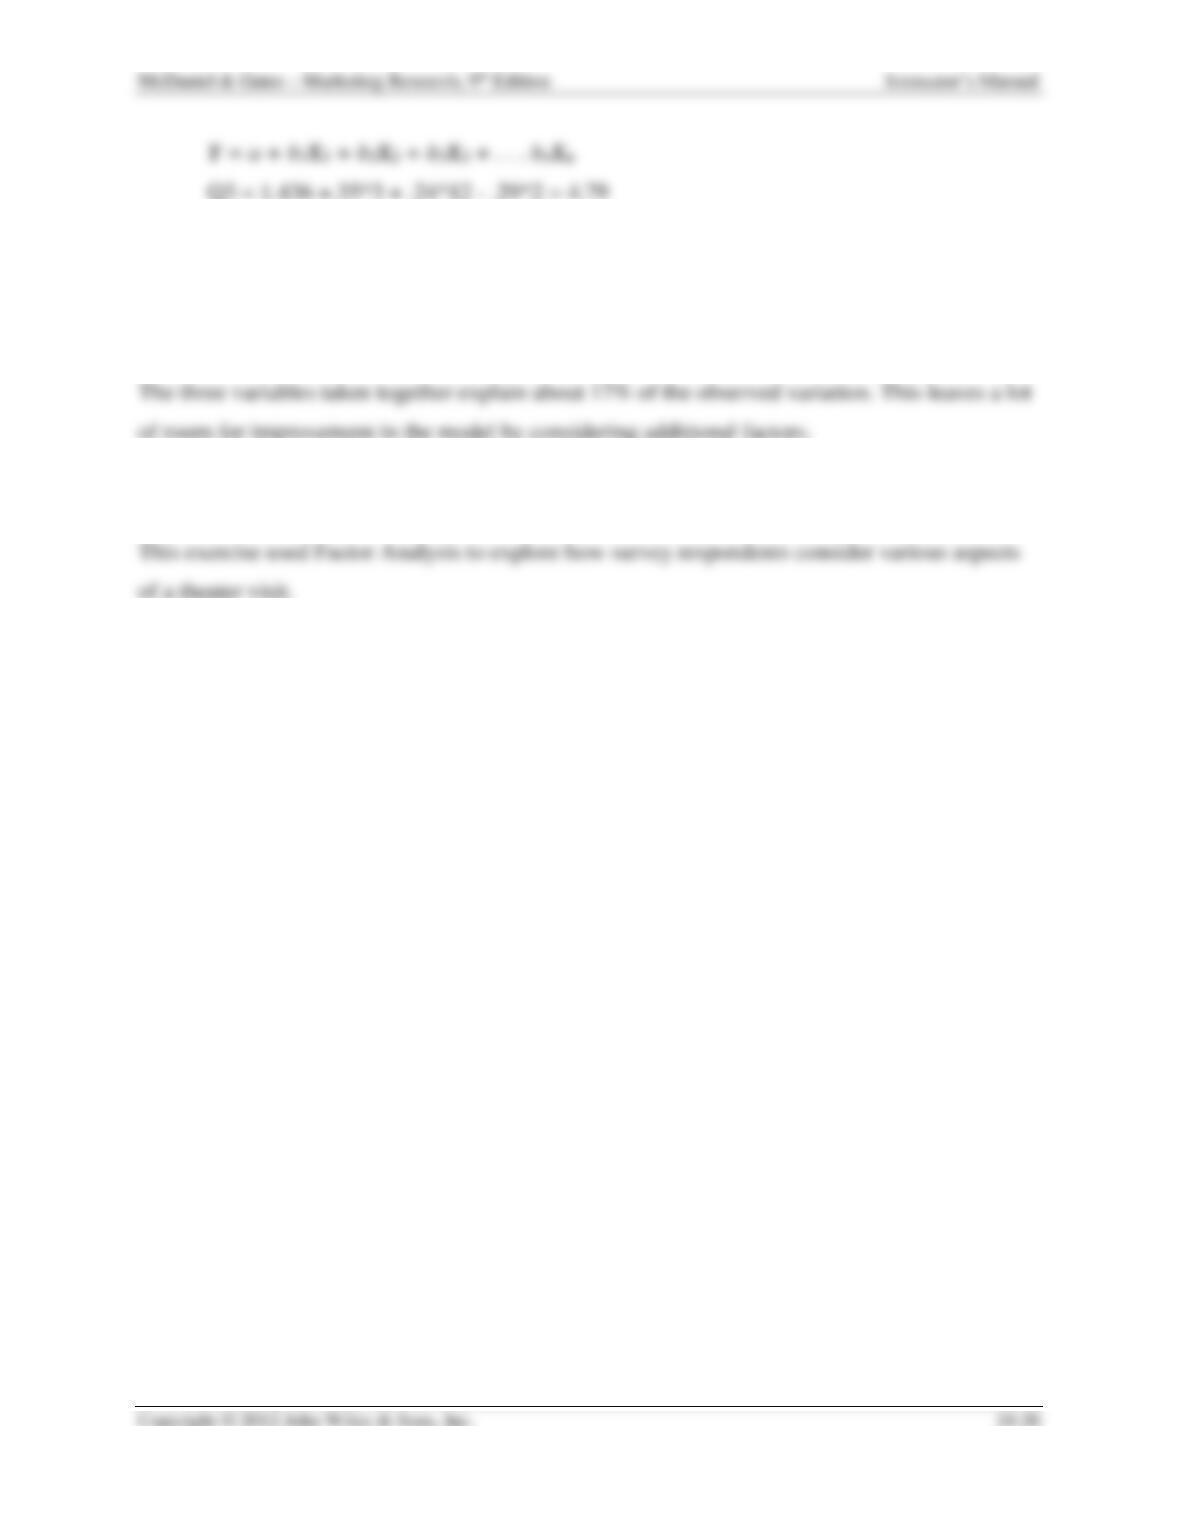
4. If a sophomore thought that going to movies was somewhat important and typically
spent $12 on snacks, how many times per month would he or she attend movies based on
this model?
5. Do any of the variables, according to the results, appear to have an effect on the number
of times one attends movies, or does it seem that other factors not covered in this survey are
driving movie
attendance?
EXERCISE #2: Factor Analysis
1. Go to the Website for the text and download the Movie database.
2. Open the database in SPSS and view the variables under Variable View. Notice that
question 5 has 9 importance rating items.
3. Go to analyze/descriptive statistics/descriptives and move Q5a and Q5i to the Variable(s)
box and click OK.
a. Which item is the most important?
Q5d: Comfortable chairs @ 3.66.
b. Which item is the least important?
Q5a: Video arcade availability @ 1.22.
Multivariate techniques require that every variable have a legitimate value. If a respondent
did not answer every question, then the analyst must either ignore the observation entirely
or impute estimates for the missing values. The default for statistical software is to ignore
those observations automatically. We will not get involved with imputation for this
exercise.
a. What will the sample size be for later multivariate techniques?
440
b. Is this sample size large enough for factor analysis?
McDaniel & Gates – Marketing Research, 9th Edition Instructor’s Manual
Yes.
c. What would some possible problems be if the sample size were not large enough?
d. It is a good idea to check that the minimum and maximum values for each
variable are within the proper range. A value that is out of range indicates either a
data input error or a user-defined missing value such as “Refused” or “Don’t
Know.” Data input errors should be corrected or deleted. User-defined missing
values should be declared in SPSS.
e. Are all the variables within the proper range?
4. Go to analyze/descriptive statistics/descriptives and move Q5a and Q5i to the Variable(s)
box and click OK. Examine the resulting correlations matrix
a. Other than the 1’s down the main diagonal of the matrix, what is the highest
correlation in absolute value?
b. Does any variable “just not fit” with the others?
Q5a, has very low correlation scores, the highest being .1535.
c. Does multicollinearity appear to exist among some of the items?
5. Go to analyze/data reduction/factor.
Move Q5a through Q5i to the Variables box.
Click the Rotation button, place a check in front of “Varimax,” and click Continue.
Click the Options button.
Place a check in front of “Sorted by size.”
Place a check in front of “Suppress absolute values less than” and set the value after it to
.25.
McDaniel & Gates – Marketing Research, 9th Edition Instructor’s Manual
Click Continue.
Click OK.
SPSS produces a lot of output Factor Analysis. It is possible to create much more output
than we have generated here by setting various subcommands and options.
a. How many factors did SPSS create?
Three factors.
b. Why did it stop at that number?
c. How could you change the defaults to create a different number of factors?
Click on “Extraction” and type the desired number in the box next to the “Number of factors”
option.
d. Go to the output entitled Total Variance Explained. How much variance was
explained in this Factor Analysis?
e. Go to the output entitled Rotated Component Matrix. Why are some of the
elements in this matrix blank?
We instructed SPSS to suppress values (loadings) smaller than .25.
f. Do the components or factors make sense?
Yes. Factor 1 considers creature comforts that are found “inside” the auditorium. Factor 2 deals
g. Can you identify a common theme for each component or factor?
This appears to be a redundant question with “f”. Factor 1 considers creature comforts that are
McDaniel & Gates – Marketing Research, 9th Edition Instructor’s Manual
INTERPRETATION
1. Is this a good factor solution? Why do you say that?
(70.3%) and considers all the available variables and puts them into one of three interpretable
factors.
2. How might you create a better factor solution?
What would be considered “better”? You might get more of the total variation explained if you
3. What understanding has this analysis helped you to gain about how movie-goers
perceive their movie-going experience?
4. What recommendations would you give a manager of a movie house based on this
analysis?
Creature comforts comprise much of the variation in consumers’ perceptions of movie-going