McDaniel & Gates – Marketing Research, 9th Edition Instructor’s Manual
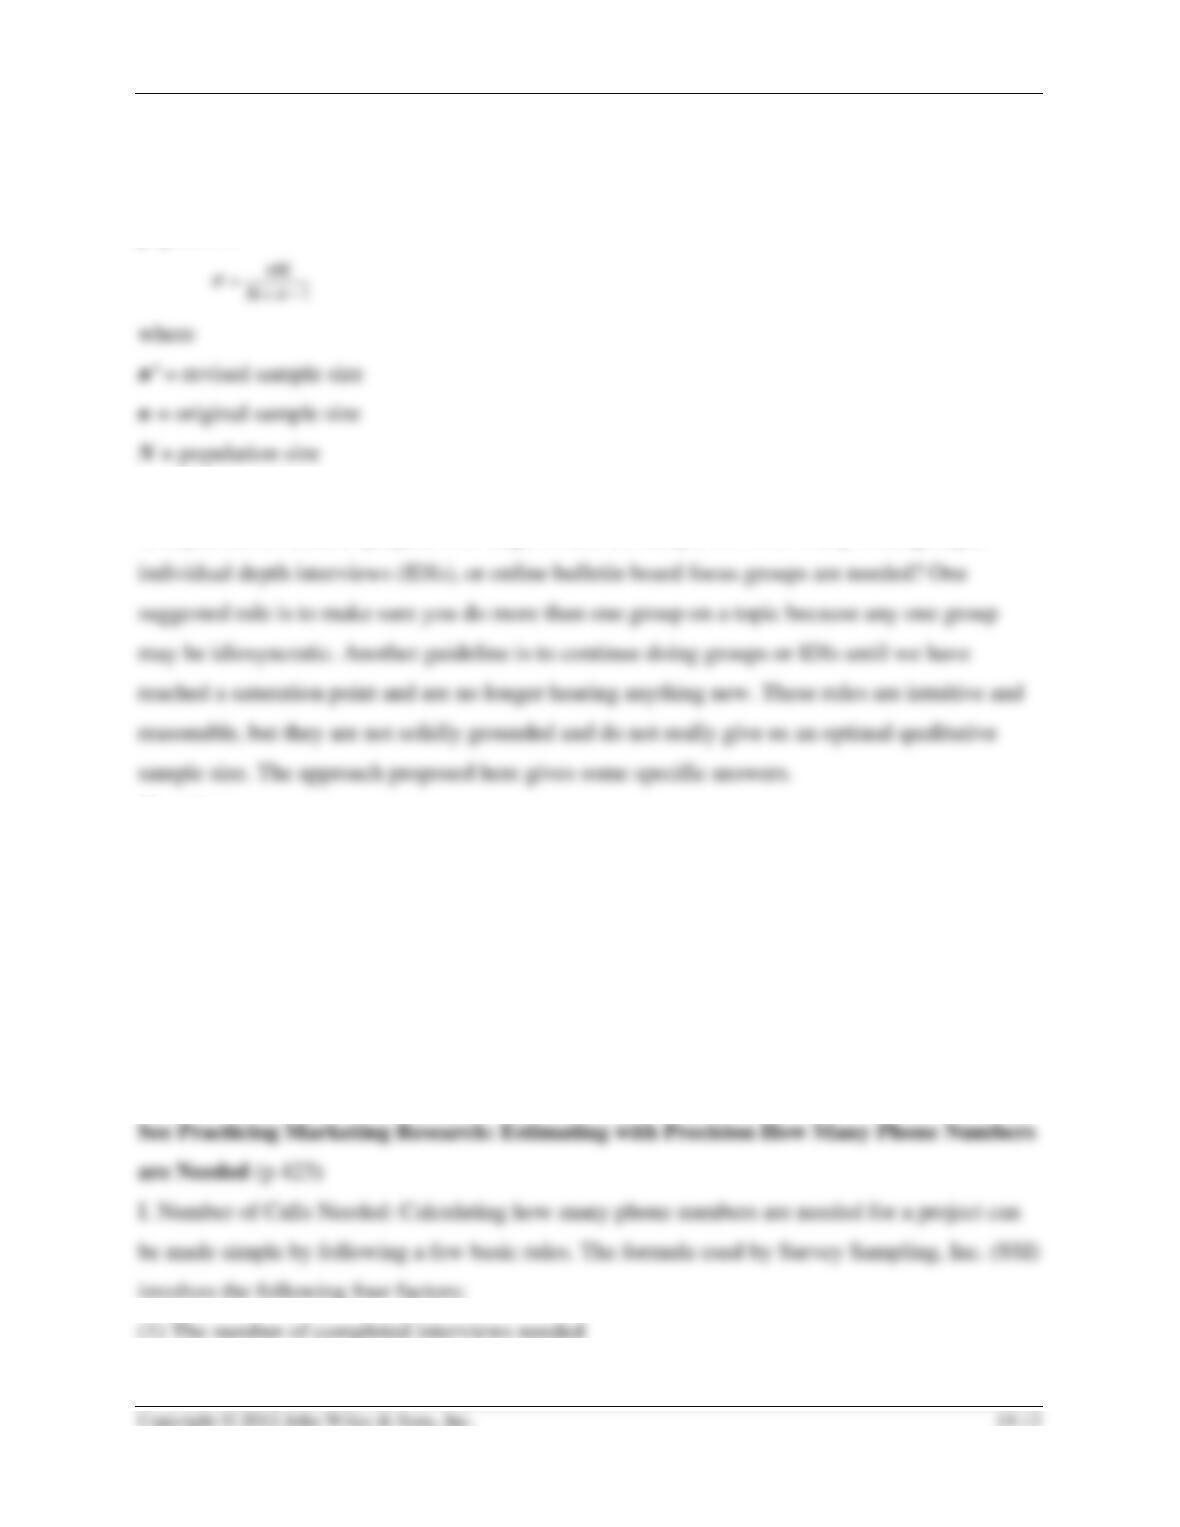
e. Finite population Correction Factor (FPC)–an adjustment to the required sample size that is
made in cases where the sample is expected to be equal to 5 percent or more of the total
population
See Practicing Marketing Research (p 421)
In a qualitative research project, how large should the sample be? How many focus groups,
Questions
1. Is sample size important in qualitative research? Why do you say that?
2. What is a reasonable target sample size for qualitative studies? What is that sample size based
on?
V. Determining How Many Sample Units Are Needed
A. How Many Sampling Units
1. The Practicing Marketing Research feature on page 466 provides a practical approach to
developing the important estimates as to how man sample units are needed.
(2) The working phone rate
McDaniel & Gates – Marketing Research, 9th Edition Instructor’s Manual
(4) The contact/completion rate
II. Estimating Completion Rate: Several important elements to consider:
A. Contact rate
6. STATISTICAL POWER
I. Types of Errors
A. Type I Error–the error of concluding that there is a difference when there is no difference
1. The formulas in this chapter focus on this type of error
B. Type II Error–the error of saying that there is no difference when there is a difference
C. Statistical Power–the probability of not making a Type II error
1. The standard formulas for calculating sample size implicitly assume a power of 50 percent
See Exhibit 14.8 Sample Size Required to Detect Differences between Proportional from
Independent Samples at Different levels of Power and an Alpha of .025 (p 425)
7. SUMMARY
QUESTIONS FOR REVIEW AND CRITICAL THINKING
1. Explain how the determination of sample size is a financial, statistical and managerial
issue.
The sample size is a financial issue because all research projects have budget limitations. The
cost of sampling must fit within the budget. Generally, larger samples cost more to obtain. It is a
2. Discuss and give examples of three methods that are used in marketing research for
determining sample size.
The first method is the budget available. If the project has a total budget for data collection of
3. A market researcher analyzing the fast-food industry noticed the following: The average
amount spent at a fast-food restaurant in California was $3.30, with a standard deviation
was $0.40. Yet in Georgia, the average amount spent at a fast-food restaurant was $3.25
with a standard deviation of $0.10. What do these statistics tell us about fast-food
consumption expenditures in these two states?
4. Distinguish among population, sample, and sampling distributions. Why is it important
to distinguish among these concepts?
A population is the total number of people that could be included in the sample. A sample is
some subset or group of the population that is chosen to be surveyed. A sampling distribution is a
conceptual and theoretical probability distribution that is rarely calculated. To compute the
5. What is the finite population correction factor? Why is it used? When should it be used?
The finite population correction factor is an adjustment to the required sample size that is made
of those cases where the sample is expected to be equal to five percent or more of the total
6. Assume that previous fast food research has shown that 80 percent of the consumers like
curly french fries. The researcher wishes to have an error of 6 percent or less and be 95
percent confident of an estimate to be made about curly french fry consumption from a
survey. What sample size should be used for a simple random sample?
7. You are in charge of planning a chili cook-off. You must make sure that there are plenty
of samples for the patrons of the cook-off. The following standards have been set: a
confidence level of 99 percent and an error of less than 4 ounces per cooking team. Last
year’s cook-off had a standard deviation in amount of chili cooked of 3 ounces. What is the
necessary sample size?
8. Based on a client’s requirements of a confidence interval of 99.74 percent and acceptable
sampling error of 2 percent, a sample size of 500 was calculated. The cost to the client is
estimated at $20,000. The client replies that the budget for this project is $17,000. What are
the alternatives?

9. A marketing researcher must determine how many telephone numbers she needs to
order from a sample provider to complete a survey of ATM users. The goal is to complete
400 interviews with ATM users. From past experience, she estimates that 60 percent of the
phone numbers provided will be working phone numbers. The estimated incidence rate
(percentage of people contacted who are ATM users) is 43 percent. Finally, she estimates
from previous surveys that 35 percent of the people contacted will agree to complete the
survey. How many telephone numbers should she order?
WORKING THE NET
1. Log on to http://research-advisors.com/documents/SampleSize-web.xls to get a download
of an Excel spreadsheet for a sample size table. The spreadsheet enables users to change the
margin of error, confidence level, and population size. Experiment with different
combinations.
Experiences will vary.
2. For an online statistical power calculator, go to:
www.dssresearch.com/toolkit/spcalc/power.asp Estimate the statistical power (type II error
or beta error) for existing survey projects.
Estimates will depend on existing survey projects
3. Use the sample size calculator online at www.dssresearch.com/toolkit/sscalc/size.asp to
work out these problems. What size samples are needed for a statistical power of 70
percent in detecting a difference of 5 percent between the estimated percentages of recent
CD buyers in two independent samples? Assume an expected percentage in the range of 50
percent and an alpha error of 5 percent.
You would need 938 buyers in each sample.
REAL-LIFE RESEARCH
Case 14.1 Concomm (p 429 – 430)
Key Points:
Concomm Telecom is a major provider of comprehensive communications services for
residential users. It offers a package including local and long-distance telephone, digital
McDaniel & Gates – Marketing Research, 9th Edition Instructor’s Manual
cable, Internet, and monitored home security service. Concomm is in the process of building
awareness of its brand in selected areas of the Southwestern United States. Now in its second
year, the company plans to spend $22 million to promote awareness and brand image of its
Questions:
1. Show how the sampling errors for the posttest measures were calculated.
Students should use the formula for sampling errors.
2. If the CEO wants to have 95.44 percent confidence that the estimates of awareness and
positive image are within _ 2 percent of the true value, what is the required sample size?
3. What is the required sample size if the CEO wants to be 99.74 percent confident?
4. If the current budget for conducting telephone interviews is $20,000 and the cost per
interview is $19, can Concomm reach the goal specified in question 3? With the $20,000
budget, what error levels can it reach for both measures? What is the budget required to
reach the goal set in question 3?
Case 14.2 – HealthLife (p 430 – 431)
Key Points:
McDaniel & Gates – Marketing Research, 9th Edition Instructor’s Manual
• HealthLife spent $3 million to promote awareness and a positive image of its wellness services
among Fortune 500 companies and their employees. They estimate a total target audience of
around 10,000. To assess the campaign, the company conducted a pretest and a posttest.
• Unaided awareness (“What companies come to mind when you think of companies that
provide group health care coverage?”) increased from 21 percent in the pretest to 25 percent in
Questions:
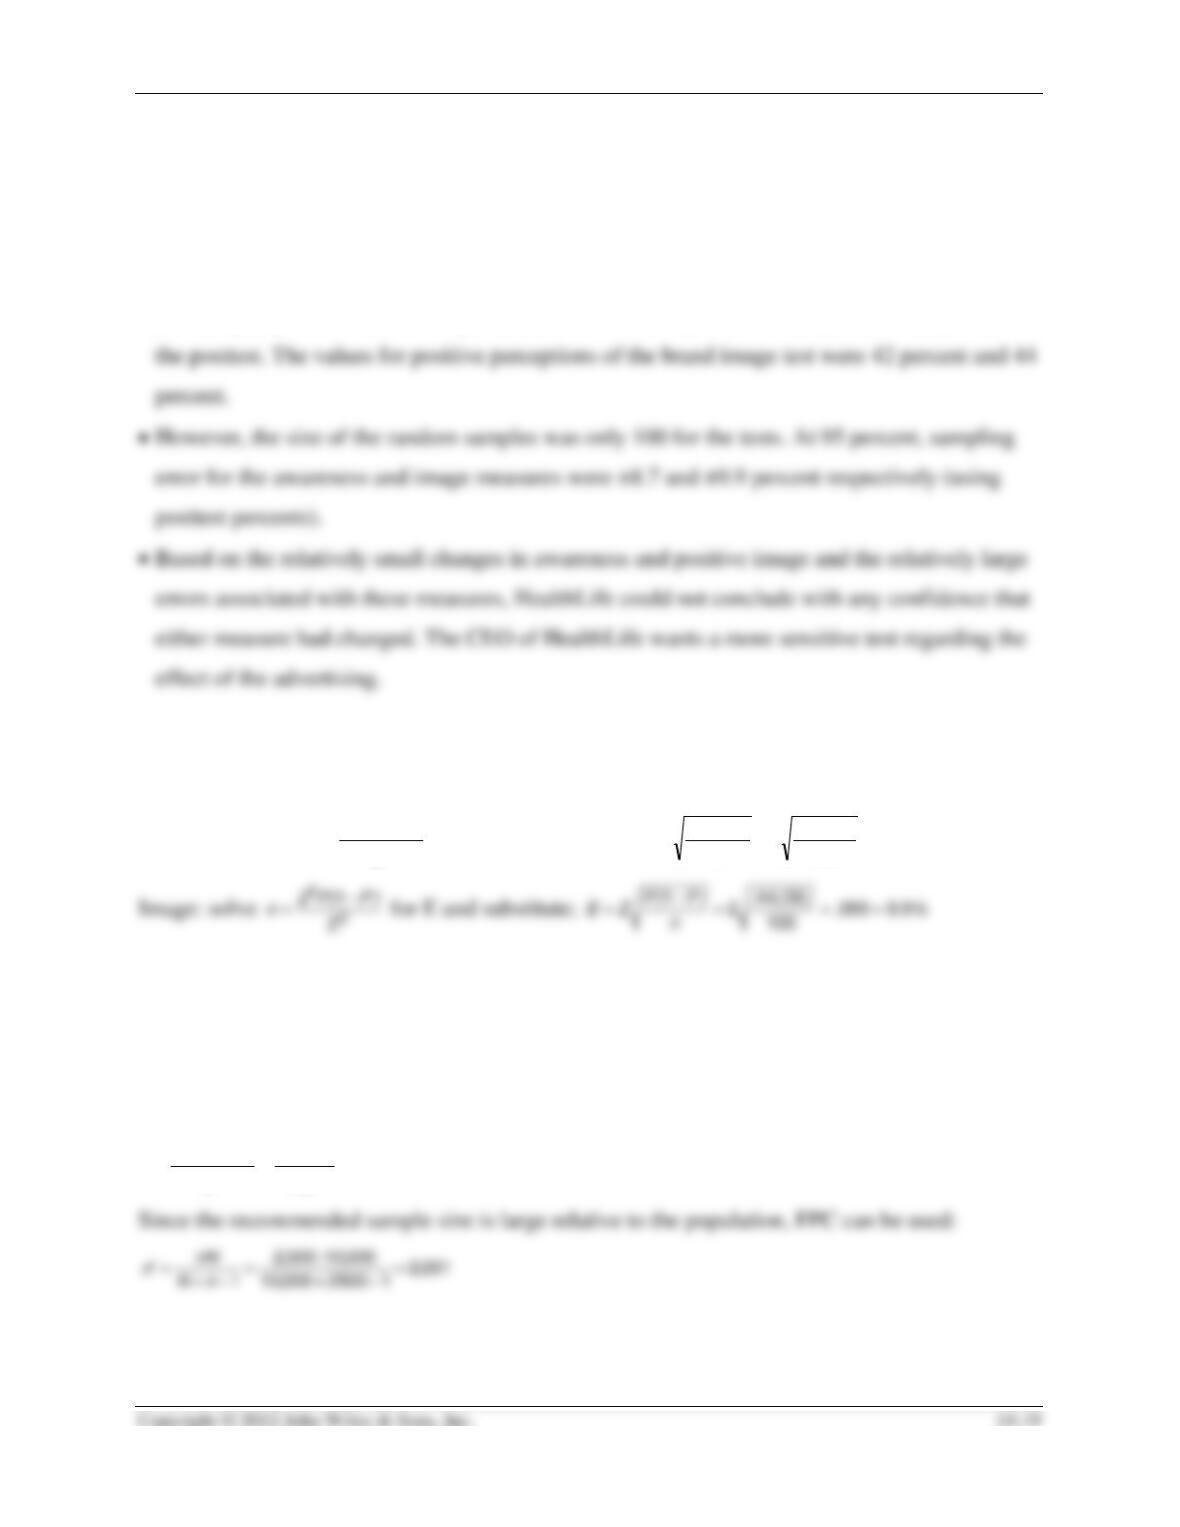
1. Show how the sampling error calculations for the posttest measures were calculated.
Awareness: solve
2
21
E
)P(PZ
n−
=
for E and substitute;
%..
)(..
n
)P(P
ZE 78087
100
7525
2
1===
−
=
2
21
E
)P(PZ
n−
=
%..
)(..
n
)P(P
ZE 99099
100
5644
2
1===
−
=
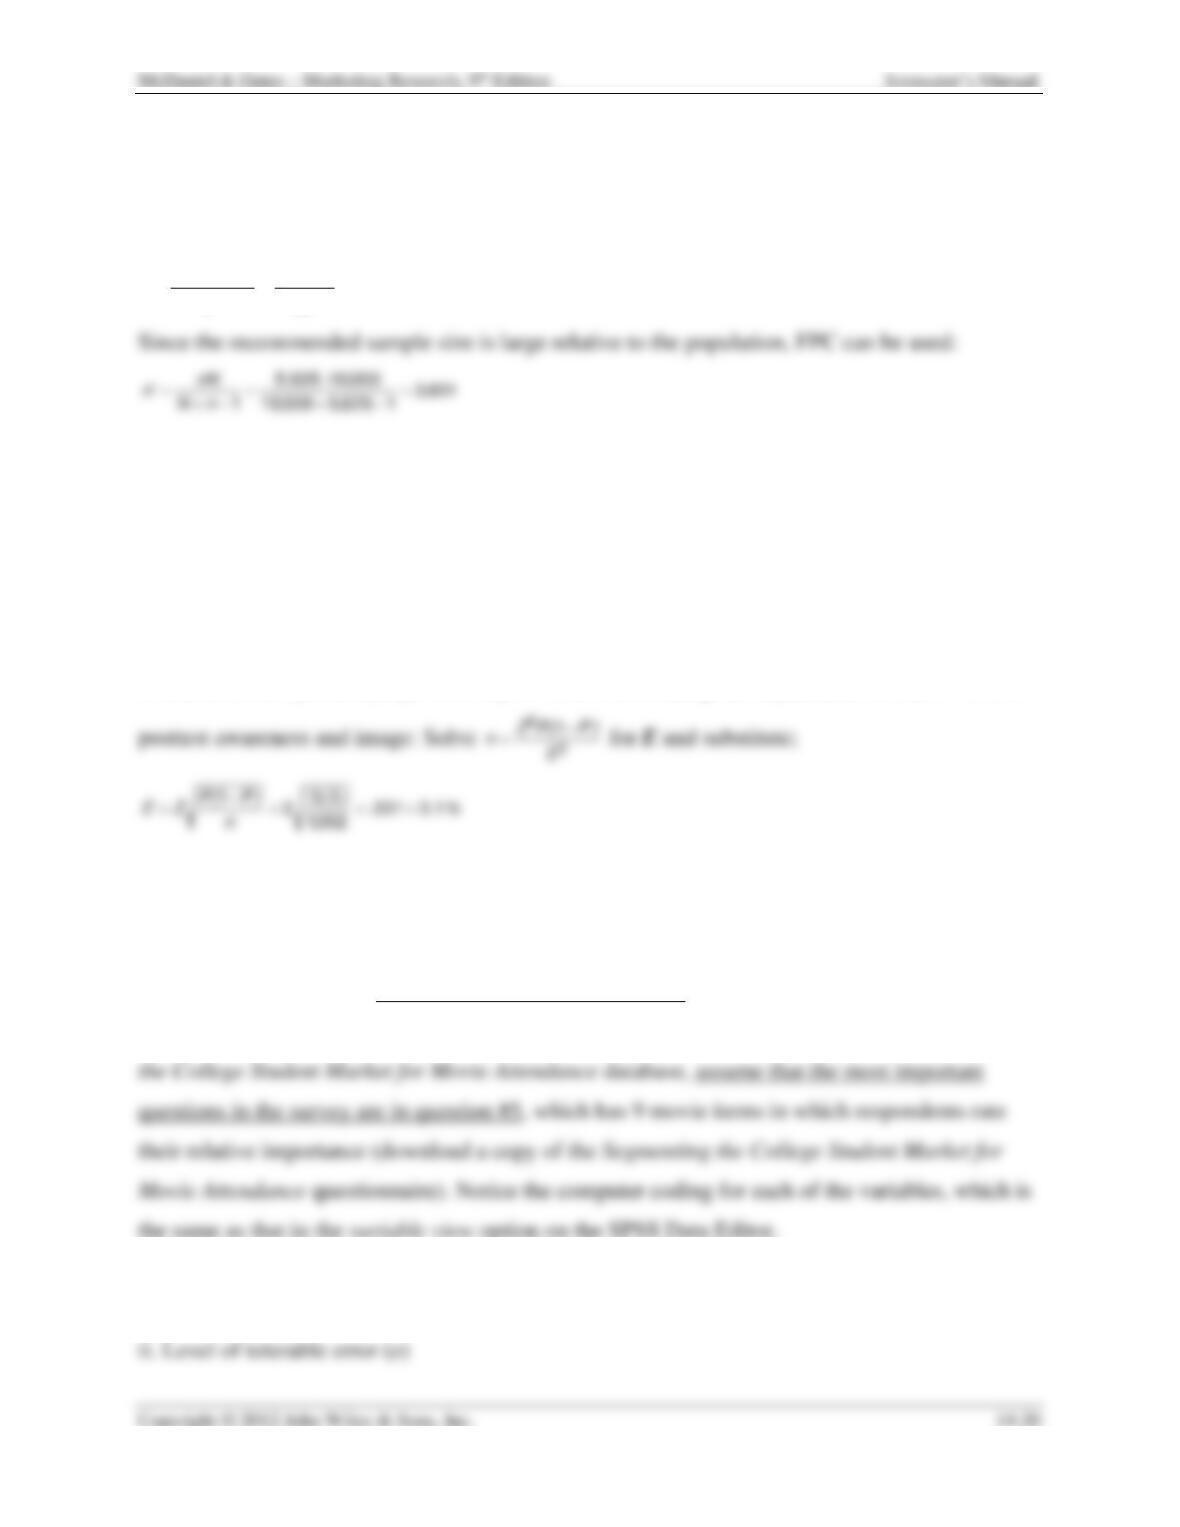
2. If the CEO wanted to be sure that the estimates of awareness and positive image are
within ±2 percent of the true value at 95 percent confidence, what is the required sample
size?
We would not know posttest proportions a priori, so we use P = .5. Thus,
5002
02
5521
2
2
2
2
,
.
)(..
E
)P(PZ
n==
−
=
3. Using all the same information used in question 2, what is the required sample size if the
CEO wants to be 99.5 percent confident?
We would not know posttest proportions a priori, so we use P = .5. Thus,
6255
02
5531
2
2
2
2
,
.
)(..
E
)P(PZ
n==
−
=
4. If the current budget for conducting the telephone interviews is $20,000 and the cost per
interview is $19, can HealthLife reach the goal specified in question 3? What error levels
can it reach for both measures with the $20,000 budget? What is the required budget to
reach the goal set in question 3?
($19/interview)(3,601 interviews) = $68,419. Thus, HealthLife cannot reach its goal with the
current budget of $20,000. HealthLife can do $20,000/$19/interview = 1,052 interviews. We
would not know posttest proportions a priori, so in estimating the expected E, we use P = .5 for
SPSS EXERCISES FOR CHAPTER 14
Exercise #1: Sample Size Determination Using the Sample Means Method SPSS-H1
1. Go to the Wiley site at www.wiley.com/college/mcdaniel and download the Segmenting the
College Student Market for Movie Attendance database to SPSS windows. Using the Segmenting
2. The Sample Means method of sample size determination consists of:
i. Required confidence level (z)
3. Of the various methods of deriving sample size, population standard deviation can be
estimated based on prior studies, expert judgment, or by conducting a pilot sample. For this
4. Use the analyze/descriptive statistics/descriptive sequence to compute the standard deviation
5. From your knowledge of sample size determination, you should know that the variable to
select for sample size determination is the one with the largest standard deviation. Select that
variable.
Answer the following questions:
1. Which of the 9 movie theater items had the largest standard deviation?
2. Invoke the sample means method of sample size determination to make the necessary
computations for each of the following:
a. Compute the sample size given the following:
i. Required confidence level (Z) is 95.44%. That is 2 standard deviations, so use 2 in
calculation.
ii. Tolerable error (e) is .1 or 1/10 of a response point.
iii. Standard deviation (σ) = 1.002
iv. Sample size (n) = 402
b. Compute the sample size given the following:
i. Required confidence level (Z) is 99.72%. That is 3 standard deviations, so use 3 in
calculation.
3. How do your computed sample sizes in the problem above compare to the total number
of cases in the Segmenting the College Student Market for Movie Attendance database?
4. We are going to assume that the objective of our research concerning student attendance
at movies can be expressed as a dichotomy (greater or lesser, etc.), for example, it doesn’t
matter how much one group attends movies over another group, but just who attends the
most. To accomplish this we can use the much less complicated sample proportion formula.
We are going to assume that we have no prior studies, hence, in the sample proportions
formula P = .5 and (1 – P) = .5. You will not need SPSS to assist you with this computation.
a. Compute the sample size given the following:
i. Required confidence level (Z) is 95.44%. That is 2 standard deviations, so use 2 in the
calculation.
ii. Tolerable error (e) is .05 or accuracy within 5% of the true population mean.
iii. Standard deviation (P) = .5 and (1 – P) = .5
iv. Sample size (n) = 400
b. Compute the sample size given the following:
i. Required confidence level (Z) is 99.72%.
ii. Tolerable error (e) is .03 or accuracy within 3% of the true population mean.
iii. Standard deviation (P) = .5 and (1 – P) = .5
iv. Sample size (n) = 900
Exercise #2: Determining the Reliability / Confidence of sample results
1. In the subsequent exercise the objective will not be to determine the needed sample size, but to
evaluate the confidence level of results derived from the entire Segmenting the College Student
2. For this problem again assume that question #5 has the most important question in the
questionnaire, with respect to the research objectives. Using analyze/descriptive
1.
a. tolerable error is .1 or 1/10 of a response point
b. sample size = 500
c. standard deviation = 4.472
2. Confidence level = virtually 100%
3. How do the results in 2, above compare to the results in 2, of the sample size
determination problem?
4. Sample Proportions Formula: Given the information below, compute the confidence
level associated with the Segmenting the College Student Market for Movie Attendance
database. You will not need SPSS to make this computation.
a. tolerable error is .05 or 5%
b. sample size = 500
c. standard deviation P = .5 and (1-P) = .5
1. Confidence Level = Z = 2.236. Confidence level is about 97.5%.

2. How do the results of this problem compare to the confidence level in #2 of (3)?