McDaniel & Gates – Marketing Research, 9th Edition Instructor’s Manual
CHAPTER 14
Sample Size Determination
LEARNING OBJECTIVES
1. To learn the financial and statistical issues in the determination of sample size.
3. To gain an appreciation of a normal distribution.
5. To distinguish between point and interval estimates.
6. To recognize problems involving sampling means and proportions.
KEY TERMS
Central limit theorem
Normal distribution
Proportional property of the normal
distribution
Standard normal distribution
Point estimate
Interval estimate
Confidence level
Confidence interval
Sampling distribution of the proportion
CHAPTER SCAN
This chapter outlines the importance and procedure of determining the sample size correctly.
There are financial, statistical, and managerial issues involved in choosing a sample size. Often if
the research study is going to be conducted, the sample size has to be determined by the budget.
Other times, the research client has a sample size in mind when they submit the request proposal.
The number of subgroups to be analyzed and traditional statistical methods also has to be
considered. To understand the statistical method of choosing a sample size, the normal
McDaniel & Gates – Marketing Research, 9th Edition Instructor’s Manual
CHAPTER OUTLINE
1. Determining Sample Size for Probability Samples
2. Rule of Thumb
4. Traditional Statistical Methods
2. Normal Distribution
I. General Properties
A. Normal Distribution
II. Standard Normal Distribution
A. Standard Normal Distribution Defined
3. Population and Sample Distributions
4. Sampling Distribution of the Mean
I. Sampling Distribution
A. Understanding Sampling Distribution of the Sample Mean
2. Basic concepts
4. Point and Interval Estimates
5. Determining Sample Size
I. Problems Involving Means
A. Formula
II. Problems Involving Proportions
III. Determining Sample Size for Stratified and Cluster Samples
IV. Population Size and Sample Size
V. Determining How Many Sample Units Are Needed
A. How Many Sampling Units?
6. Statistical Power
I. Types of Errors
7. Summary
CHAPTER SUMMARY
1. DETERMINING SAMPLE SIZE FOR PROBABILITY SAMPLES
The process of determining sample size for probability samples involved financial, statistical,
and managerial issues. The larger the sample is the smaller the sampling error. The cost increase
as the sample increases on a liner basis; however, the sampling error decreases at a rate equal to
I. Determining Sample Size
McDaniel & Gates – Marketing Research, 9th Edition Instructor’s Manual
A. Process of Determining Sample Size
1. Budget Available
a. Sample Size–for a project often is determined by the budget available. Sample size, therefore,
2. Rule of Thumb
a. Potential clients may specify they want a sample of a specific size.
3. Number of Subgroups Analyzed
a. Subgroups–the number and anticipated size of various subgroups of the total sample that must
be analyzed and statistical inferences must be made should be seriously considered
b. Sample Size–dependent on the number of subgroups to be analyzed–the more needed the
larger the required total sample size
c. Minimum Needs–100 or more respondents in each major subgroup and 20 to 50 respondents
in each of the less important subgroups
1) An estimate of the population standard deviation
3) The desired level of confidence that the sample result will fall within a certain range (result ±
sampling error) of true population values
2. NORMAL DISTRIBUTION
I. General Properties
A. Normal Distribution–is crucial to classical statistical inference. Continuous distribution that
is bell-shaped and symmetric about the mean; the mean, median and mode are equal
1. Reasons for its Importance
McDaniel & Gates – Marketing Research, 9th Edition Instructor’s Manual
a. Many variables encountered by marketers have probability distributions that are close to the
normal distribution
b. Central limit theorem–the idea that the distribution of a large number of sample means or
sample proportions will approximate a normal distribution, regardless of the distribution of the
population from which they were drawn
c. Normal distribution is a useful approximation of many discrete probability distributions
d. Important characteristics of a normal distribution
2) Symmetric about its mean–is not skewed and implies that the three measures of central
tendency (mean, median and mode) are all equal
4) The total area under a normal curve is equal to one, meaning that it takes in all observations.
5) The area of a region under the normal distribution curve between any two values of a variable
equals the probability of observing a value in the range when an observation is randomly
selected from the distribution
See Exhibit 14.1 Normal Distribution for Heights of Men (p 409)
6) The area between the mean and a given number of standard deviations from the mean is the
same for all normal distributions–68.26 percent of the observations.
a) Proportional property of the normal distribution feature that the number of observations
falling between the mean and a given number of standard deviations from the mean is the same
for all normal distributions
II. Standard Normal Distribution
A. Standard Normal Distribution Defined–a normal distribution with a mean of zero and a
standard deviation of one
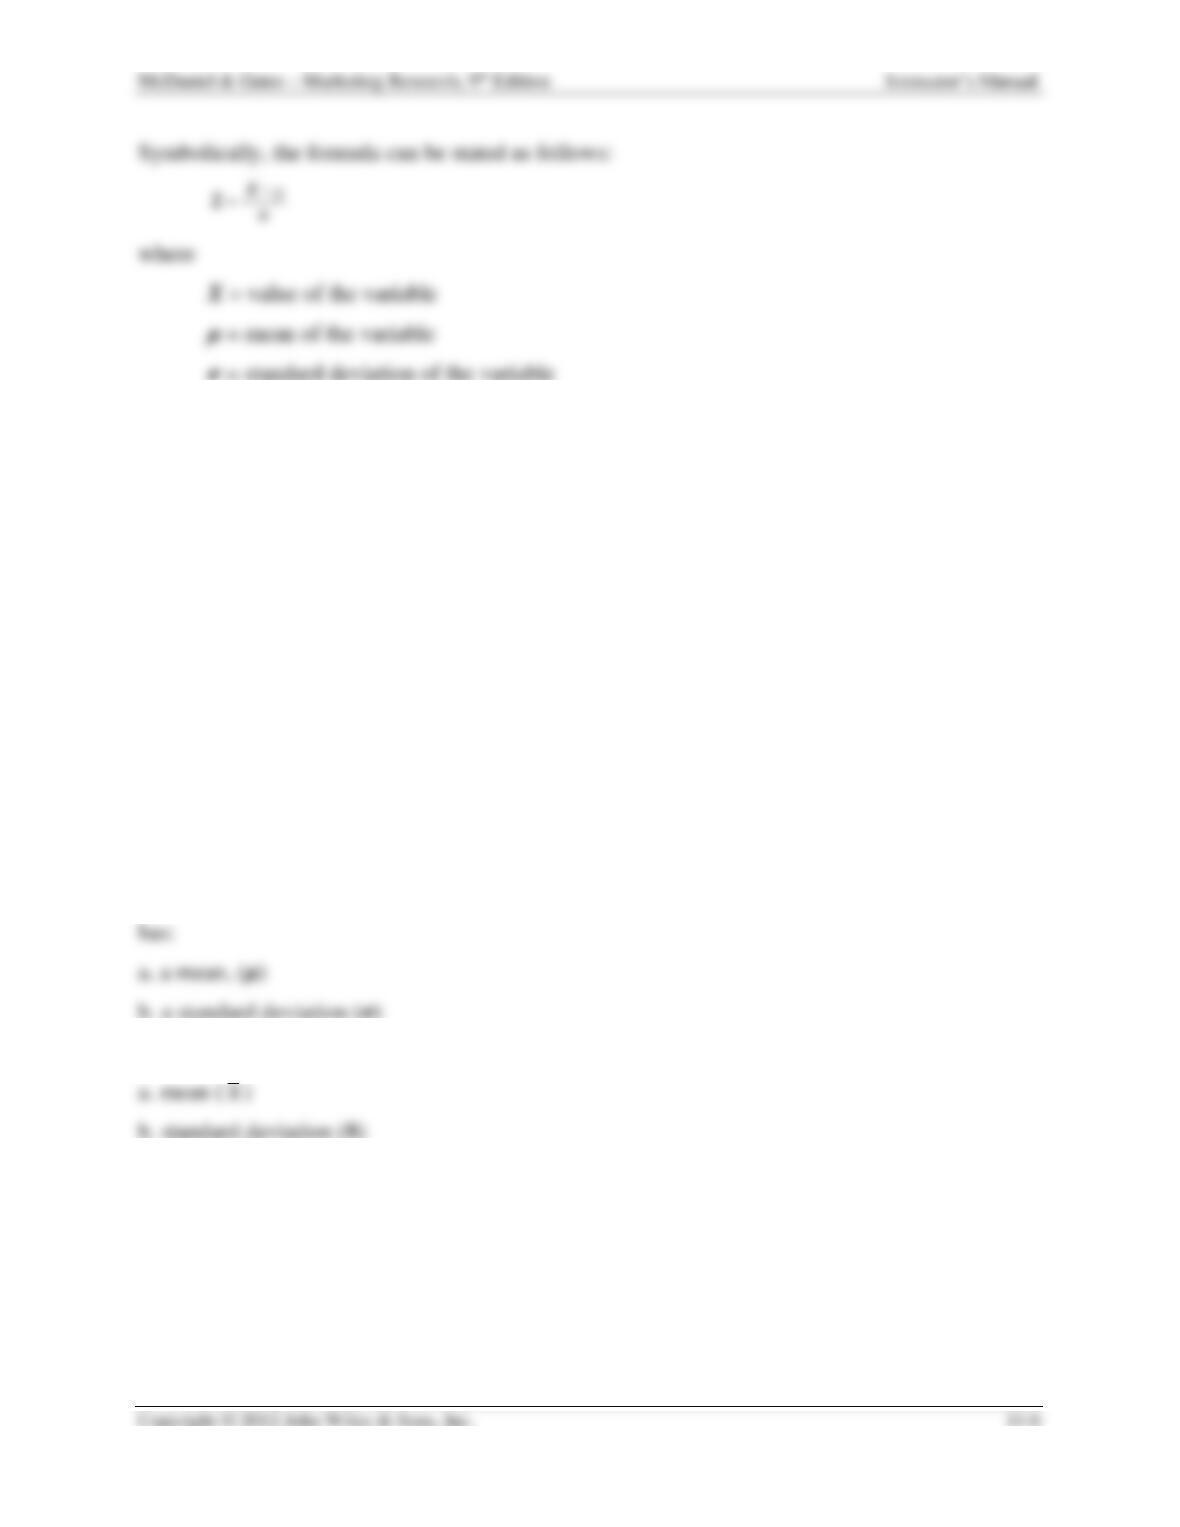
1. Probability–provided in Table 2 in Appendix 2; based on a standard normal distribution. A
simple transformation formula, based on the proportional property of the normal distribution is
used to transform any value X from any distribution to its equivalent value Z from a standard
normal distribution:
2. Standard Deviation–a measure of dispersion calculated by subtracting the mean of the series
from each value in a series, squaring each result, summing the results, dividing the sum by the
number of items minus 1, and taking the square root of the value
See Exhibit 14.2 Area under Standard Normal Curve for Z Values (Standard Deviations)
of 1, 2, and 3 (p 409)
See Exhibit 14.3 Standard Normal Distribution (p 410)
3. POPULATION AND SAMPLE DISTRIBUTIONS
I. Purpose of Conducting a Survey
A. Sample
1. To Make Inferences–about the population under study–not to describe the sample
a. Sample–a subset of the total population
2. Population Distribution–is a frequency distribution of all the elements of the population. It
3. Sample Distribution–a frequency distribution of all the elements of a single sample
4. SAMPLING DISTRIBUTION OF THE MEAN
I. Sampling Distribution
A. Understanding Sampling Distribution of the Sample Mean
1. Sampling Distribution of the Mean–conceptual and theoretical probability distribution of the
means of all possible samples of a given size drawn from a given population
McDaniel & Gates – Marketing Research, 9th Edition Instructor’s Manual
a. Deriving a Distribution of Sample Means–involves drawing a large number of simple
random samples of a certain size from a particular population
b. If the Samples Are Sufficiently Large and Random–then the resulting distribution of
sample means will approximate a normal distribution. This assertion is based on the central
limit theorem
1) As sample size increases, the distribution of the means of a large number of random samples
taken
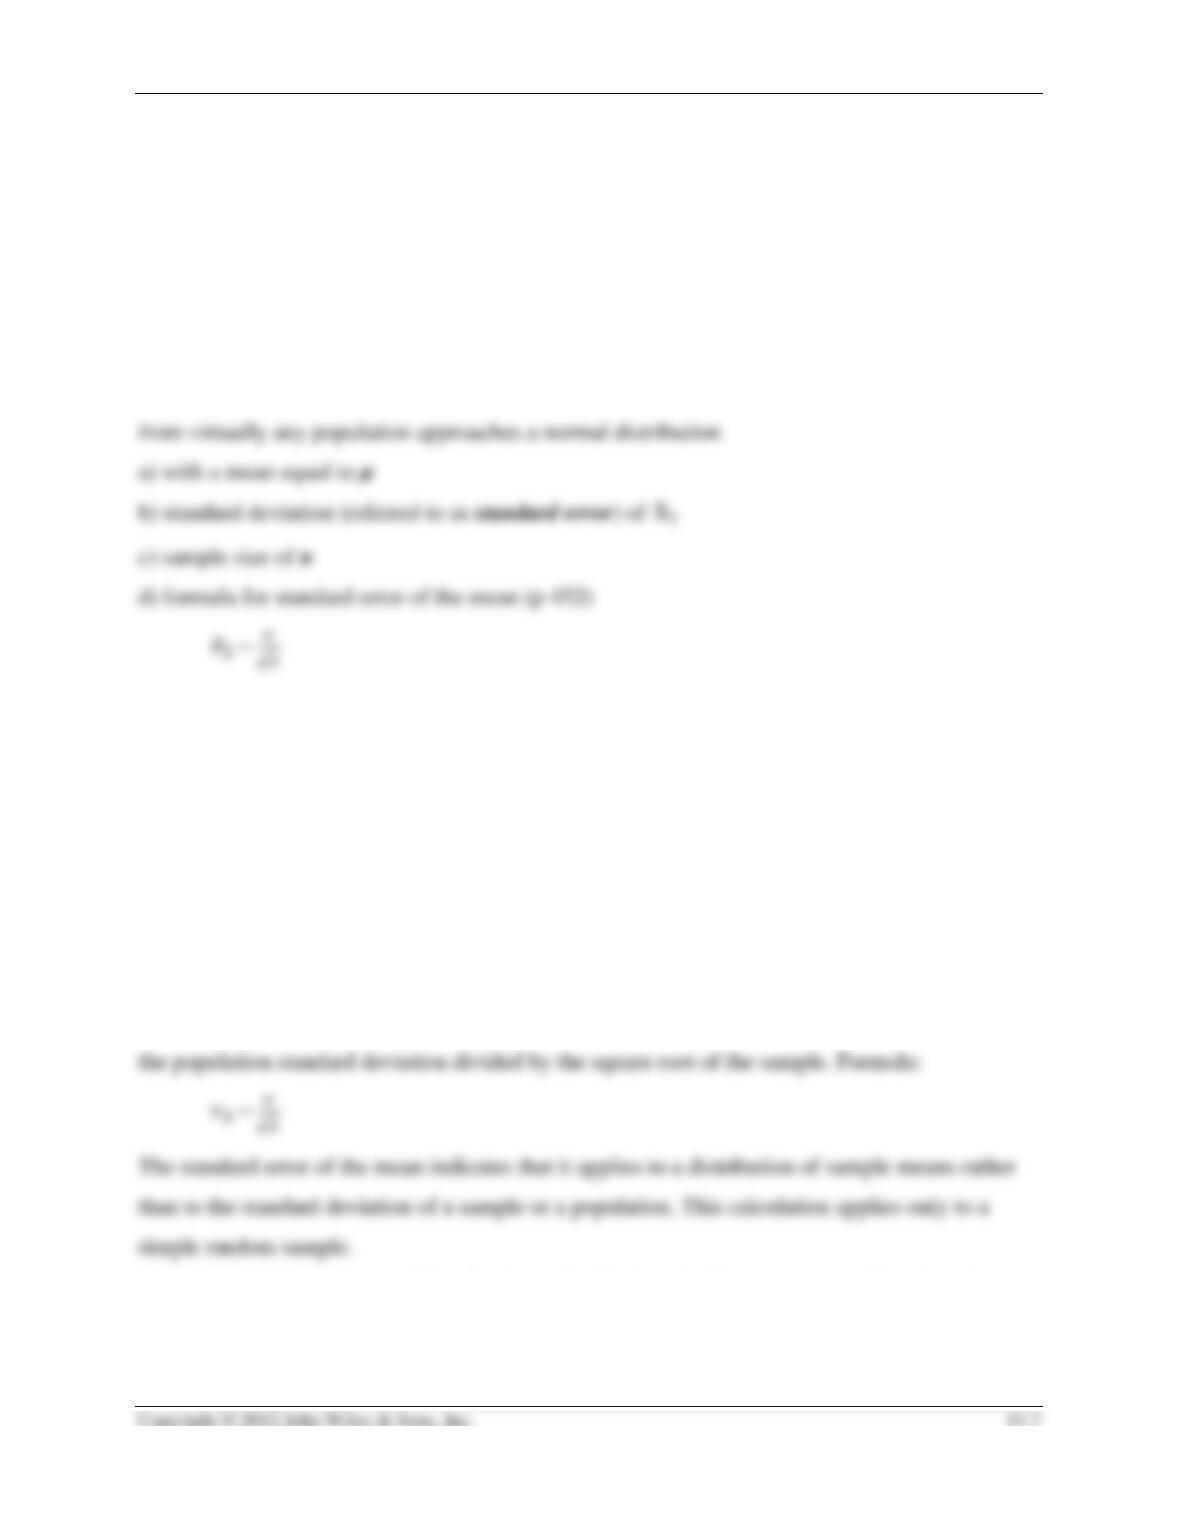
See Exhibit 14.4 Notation for Means and Standard Deviations of Various Distributions (p
411)
See Exhibit 14.5 Relationships of the Three Basic Types of Distribution (p 412)
2. Basic Concepts
a. Examples–case which describes the use of Sampling Distribution of the Mean
1) Characteristics of a Large (30 or More Observations) Simple Random Samples
a) Distribution is a normal distribution
b) Distribution has a mean equal to the population mean.
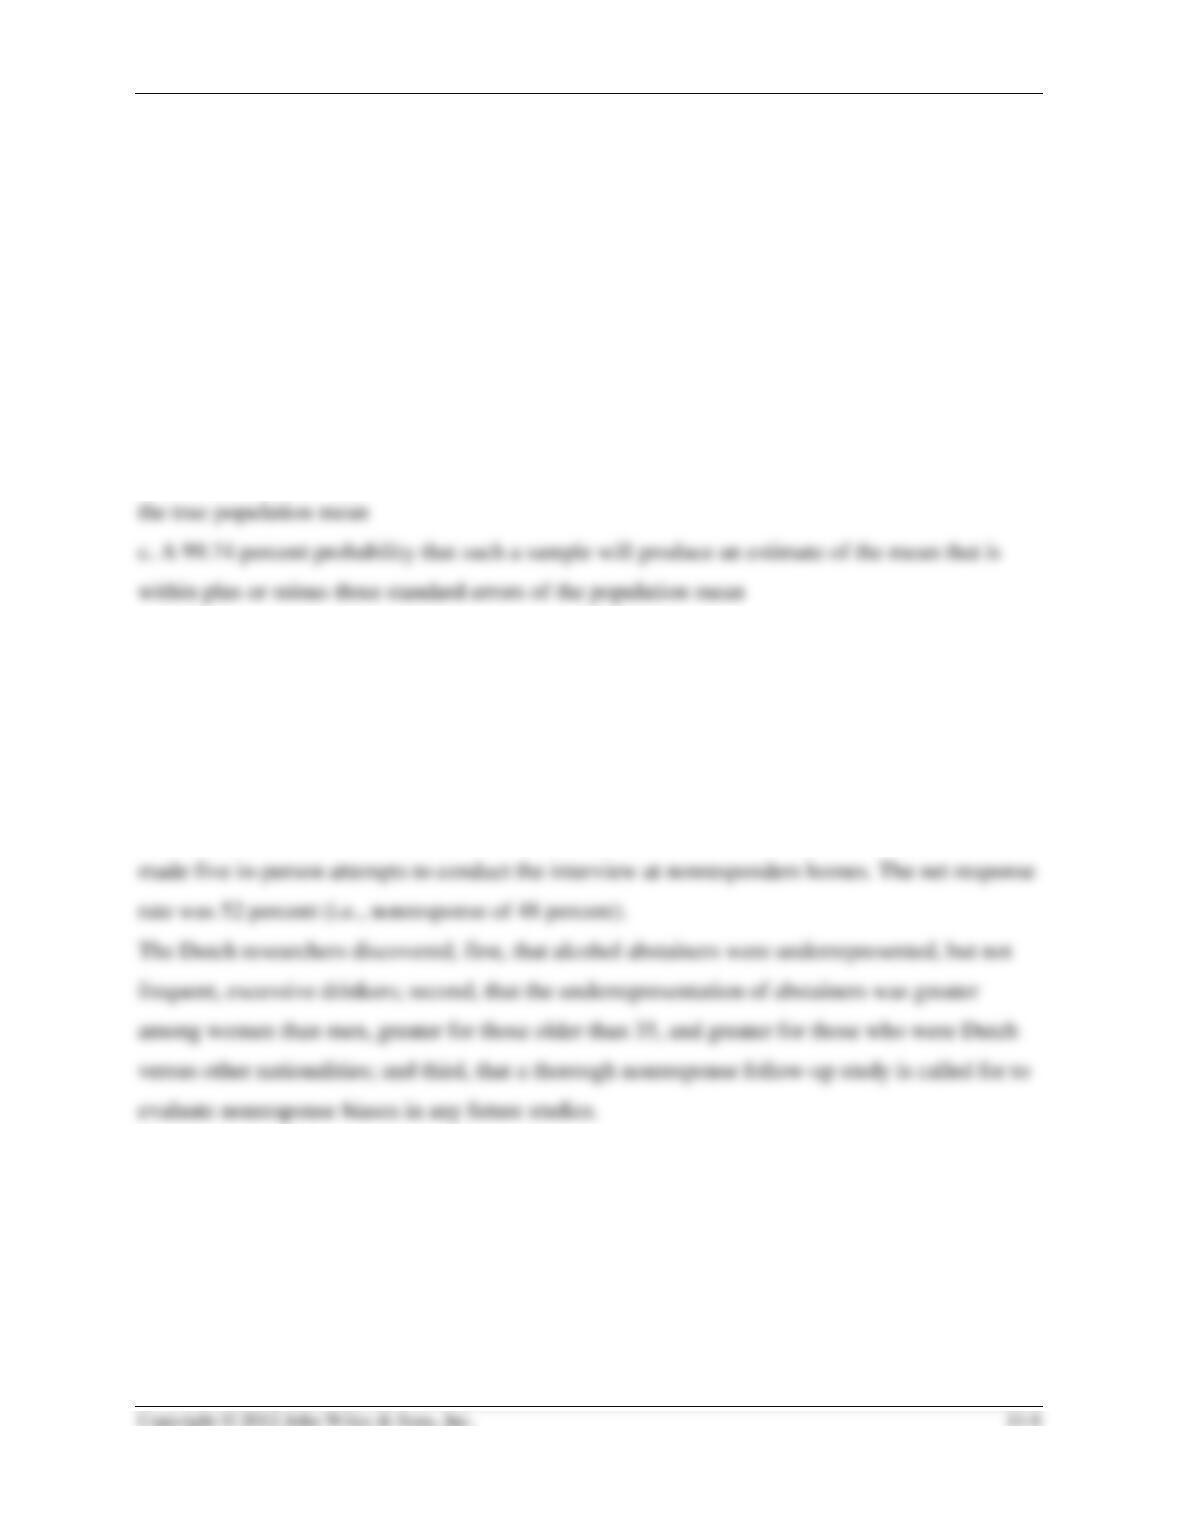
c) Distribution has a standard deviation, referred to as the standard error of the mean, equal to
See Exhibit 14.6 Frequency Distribution of 1,000 Sample Means: Average Number of
Times Respondent Ate at the Fast Food Restaurant in the Past 30 Days (p 413)
McDaniel & Gates – Marketing Research, 9th Edition Instructor’s Manual
See Exhibit 14.7 Actual Sampling Distribution of Means for Number of Times Respondent
Ate at Fast Food Restaurant in Past 30 Days (p 413)
3. Making Inferences on the Basis of a Single Sample
a. There is a 68.26 percent probability that any one random sample of a particular size will
produce an estimate of the population mean that is within one standard error (plus or minus) of
the true mean is based on the information provided in Exhibit 14.2 Area Under Standard
Normal Curve for Z Values (Standard Deviations) of 1, 2, and 3 (p 451)
b. There is a 95.44 percent probability that any one simple random sample of a particular size
from a given population will produce a value that is within plus or minus two standard errors of
See Global Research: Nonresponse Bias in a Dutch Alcohol Consumption Study (p 414)
Researchers at the Addiction Research Institute in Rotterdam, The Netherlands, concluded that
nonresponse can be a serious problem. In 2002, they reviewed the results of a study done in 1999
on alcohol usage. Their assumption was that abstainers probably did not respond because they
lacked interest in the subject and excessive drinkers did not respond because they were
embarrassed by their usage. This hypothesis was borne out in a 2002 study, where researchers
Discussion Questions
1. The nonresponse bias came in with the extremes (abstainers and heavy drinkers) regarding
alcohol use. Is there any weighting approach that might compensate for these two important
groups of nonresponders so that a follow-up study would not be needed?
2. For the 48 percent who failed to respond to the second study, would a mailed questionnaire,
insuring privacy, be worth the expense in terms of the improvement in statistical accuracy it
might generate?
4. Point and Interval Estimates
a. Point Estimates–sample mean best estimate of the population mean
b. Interval estimate–an interval or range of values within which the true population value is
estimated to fall
c. Confidence level–the probability that a particular interval will include the true population
value; also called confidence coefficient
d. Confidence interval–the interval that in all probability includes the true population value
e. Method of Deriving Interval Estimates
1) Draw a random sample of a given size from the population of interest and calculate the mean
The 68.26% confidence interval for the mean would be
XX XX +− 11
The 95.44% confidence interval for the mean would be
XX XX +− 22
f. Assumes That the Standard Deviation of the Population is Known. If it is not, simply use
the standard deviation of the sample.
II. Sampling Distribution of the Proportion
A. Interest in Estimating Proportions or Percentages
1. Common examples include estimating the following:
a. The percentage of the population that is aware of a particular ad
2. Sampling Distribution of the Proportion–a relative frequency distribution of the sample
3. Characteristics
McDaniel & Gates – Marketing Research, 9th Edition Instructor’s Manual
a. It approximates a normal distribution
5. DETERMINING SAMPLE SIZE
I. Problems Involving Means
A. Formula–for calculating the required sample size for problems that involve the estimation of
1. Information Needed to Compute the Sample Size
a. Three pieces of information are needed to compute the sample size required
1) Specification of the acceptable or allowable level of sampling error (E).
2) Specification of the acceptable level of confidence in standard errors or Z values. In other
words, how confident do you want to be that the specified confidence interval takes in the
population mean?
3) An estimate of the population standard deviation (σ)
b. Level of confidence Z and allowable Sampling error E–the amount the researcher is willing
to accept
c. Population Standard Deviation–the standard deviation of a variable for the entire population
McDaniel & Gates – Marketing Research, 9th Edition Instructor’s Manual
d. Four Methods Used to Deal with the Estimate of the Population Standard Deviation–
before selecting the sample:
2) Conduct a pilot survey
4) Use judgment
See Practicing Marketing Research: Harris Poll on “Margin of Error” Finds It Is Widely
Misunderstood (p 461-462)
A 2007 Harris Interactive poll found that 52 percent of Americans (mis)understand the phrase
“the margin of error being plus or minus 3 percent” to mean that all the survey results are
accurate to within a maximum of 3 percent error considering all types of possible error. They
also found that 66 percent believe that “margin of error” includes errors produced by how the
Discussion Questions
1. Should “margin of error” still be used in reporting polls, should its meaning or scope be
broadened, or should additional qualifications be added to show that poll results are fallible?
2. Suggest another sampling poll Harris Interactive might conduct that would clarify an
important topic or assumption in market research.
II. Problems Involving Proportions
A. If there is no basis for estimating P, the researcher can make the most pessimistic or worst
case assumption regarding the value of P
McDaniel & Gates – Marketing Research, 9th Edition Instructor’s Manual
D. There is no corresponding most pessimistic assumption regarding the value of σ in problems
that involve determining the sample size necessary to estimate a mean with given levels of Z or
E
E. A. Formula–for calculating the required sample size for problems that involve the estimation
III. Determining Sample Size for Stratified and Cluster Samples
A. This is very complex and requires information that frequently is not available or is difficult to
obtain
B. Therefore sample size determination for other types of probability samples is beyond the
scope of this introductory text
IV. Population Size and Sample Size
A. Population Size in Relation to Sample Size
1. None of the formulas for determining sample size take into account the size of the population
in any way.
2. The size of the population may have an effect only in those situations where the size of the
sample is large in relation to the size of the population.
a. Rule of thumb–an adjustment in the sample size should be made if the sample size is more