Chapter 9.Multicomponent Heterogeneous Systems 77
Systems
9.1. Use equation (9.3) to write out a general expression for the
change in volume of a three phase (• • + • • + • •), two component
(A and B) system. Include all twelve terms.
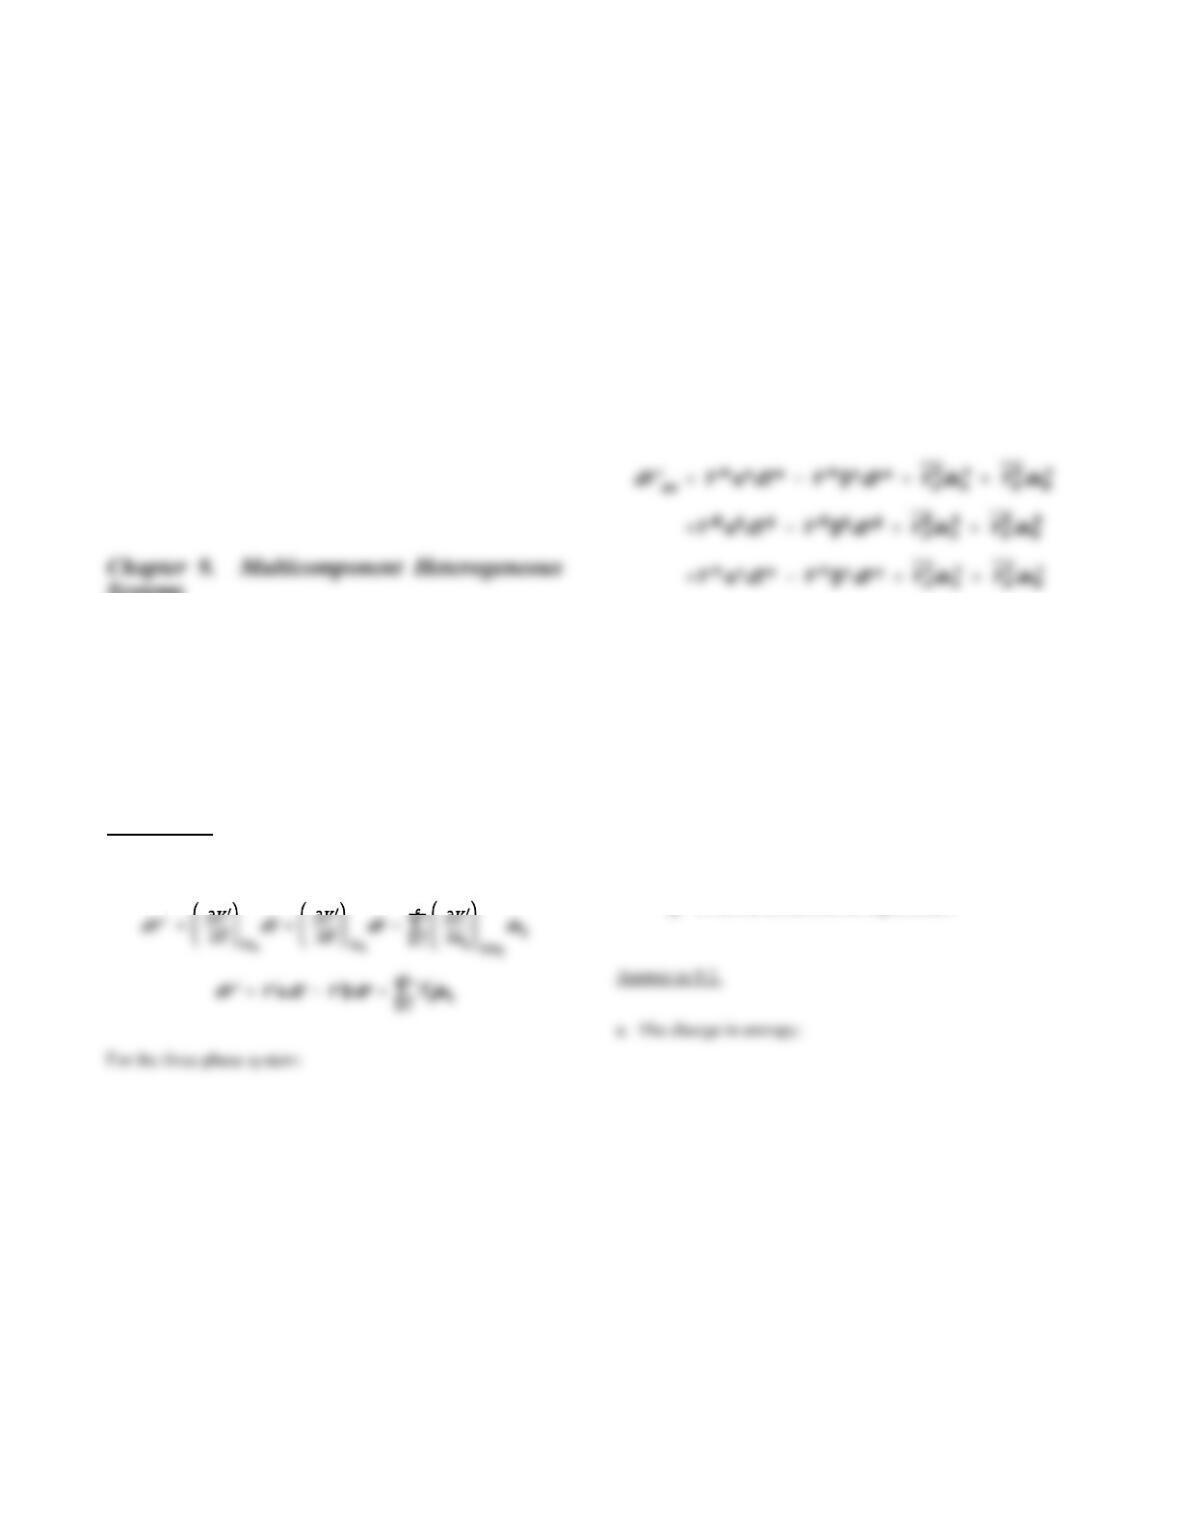
Answer to 9.1.
For each phase,
———–———–——————-——–————-—-
9.2. Follow the general strategy for finding conditions for
equilibrium for the system described in Problem 9.1.
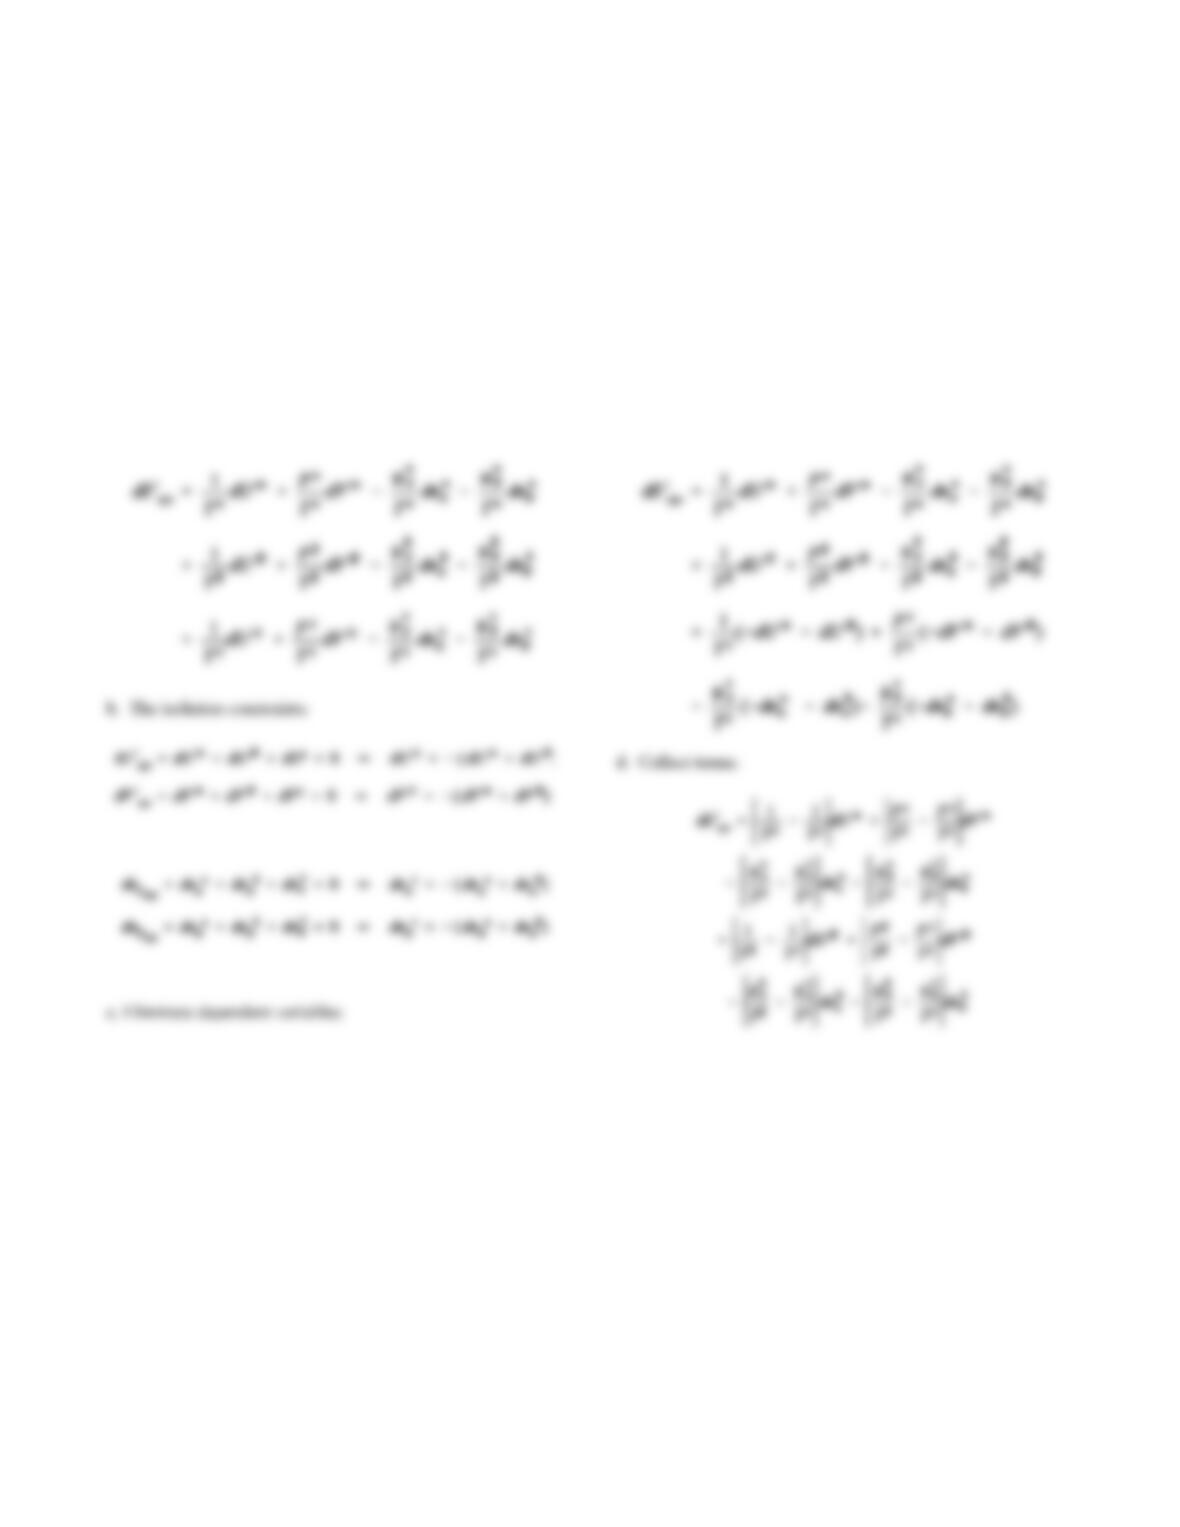
a. Write out an explicit expression for the change in
entropy.
b. Write the isolation constraints for this three phase
system.
c. Use the isolation constraints to eliminate dependent
variables in the expression for the entropy.
d. Collect like terms.
e. Count the number of independent variables.
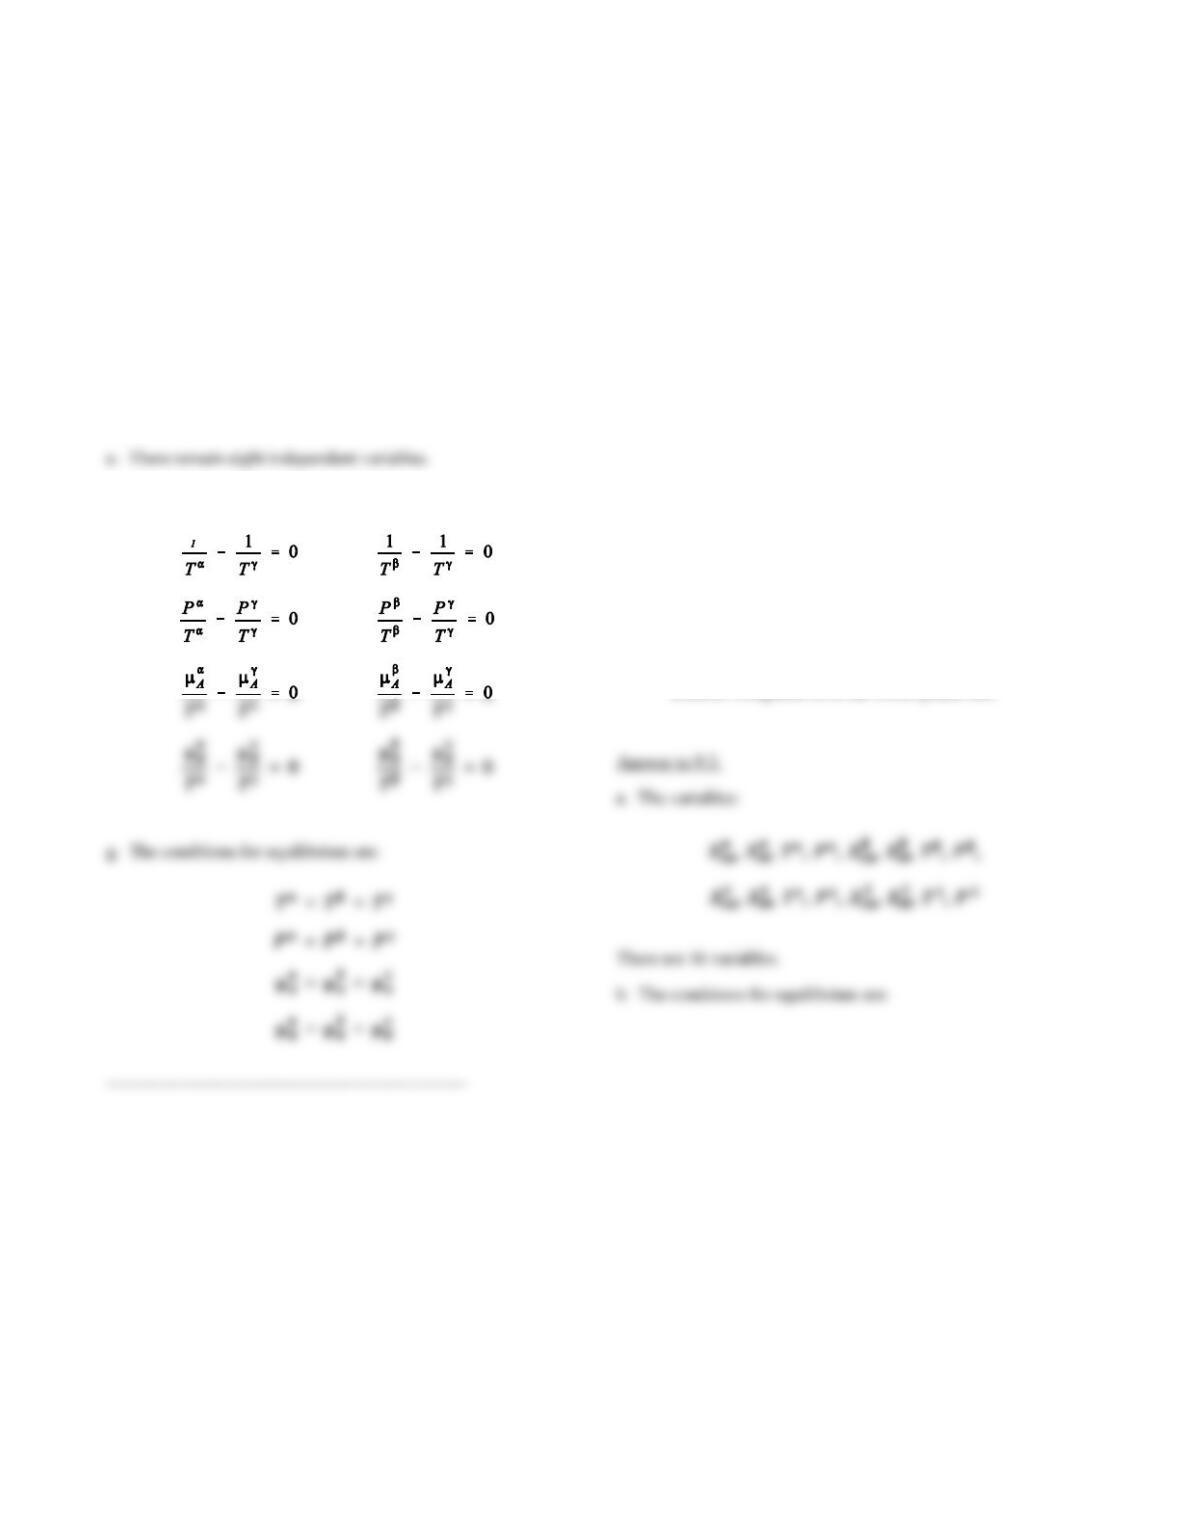
f. Set the coefficients equal to zero.
g. Write the conditions for equilibrium.
Chapter 9.Multicomponent Heterogeneous Systems 78
Chapter 9.Multicomponent Heterogeneous Systems 79
f. Set the coefficients equal to zero:
9.3. Consider a system with components Cu, Ni and Zn that
contains 4 phases: • •,• •,• • and L.
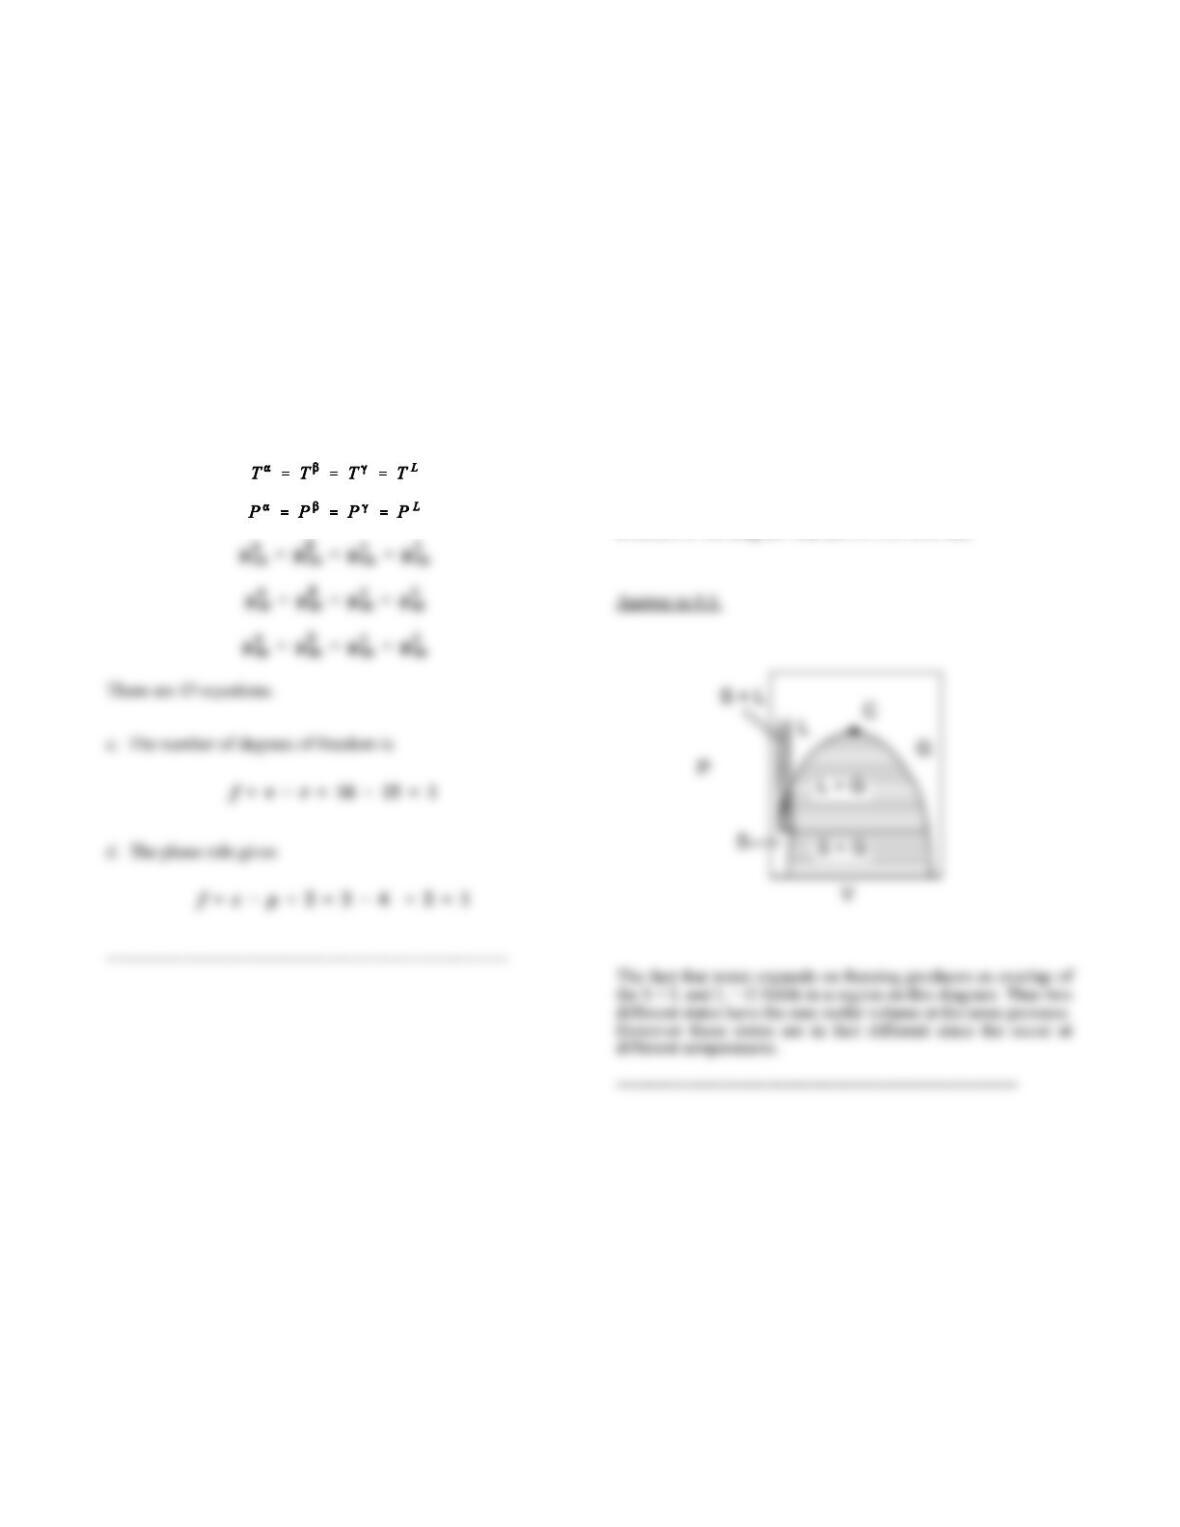
a. List the variables required to specify the state of each
phase: count them.
b. List the conditions for equilibrium for this system;
count them.
c. From these counts, compute the number of degrees of
freedom.
d. Compare this result with the number of degrees of
freedom computed from the Gibbs phase rule.
Chapter 9.Multicomponent Heterogeneous Systems 80
9.4. Sketch the phase diagram for pure water in (P, V) space. Be
careful to incorporate the observation that solid water shrinks
upon conversion to the liquid state. Discuss complications in the
structure of the diagram that derive from this fact.
Chapter 9.Multicomponent Heterogeneous Systems 81
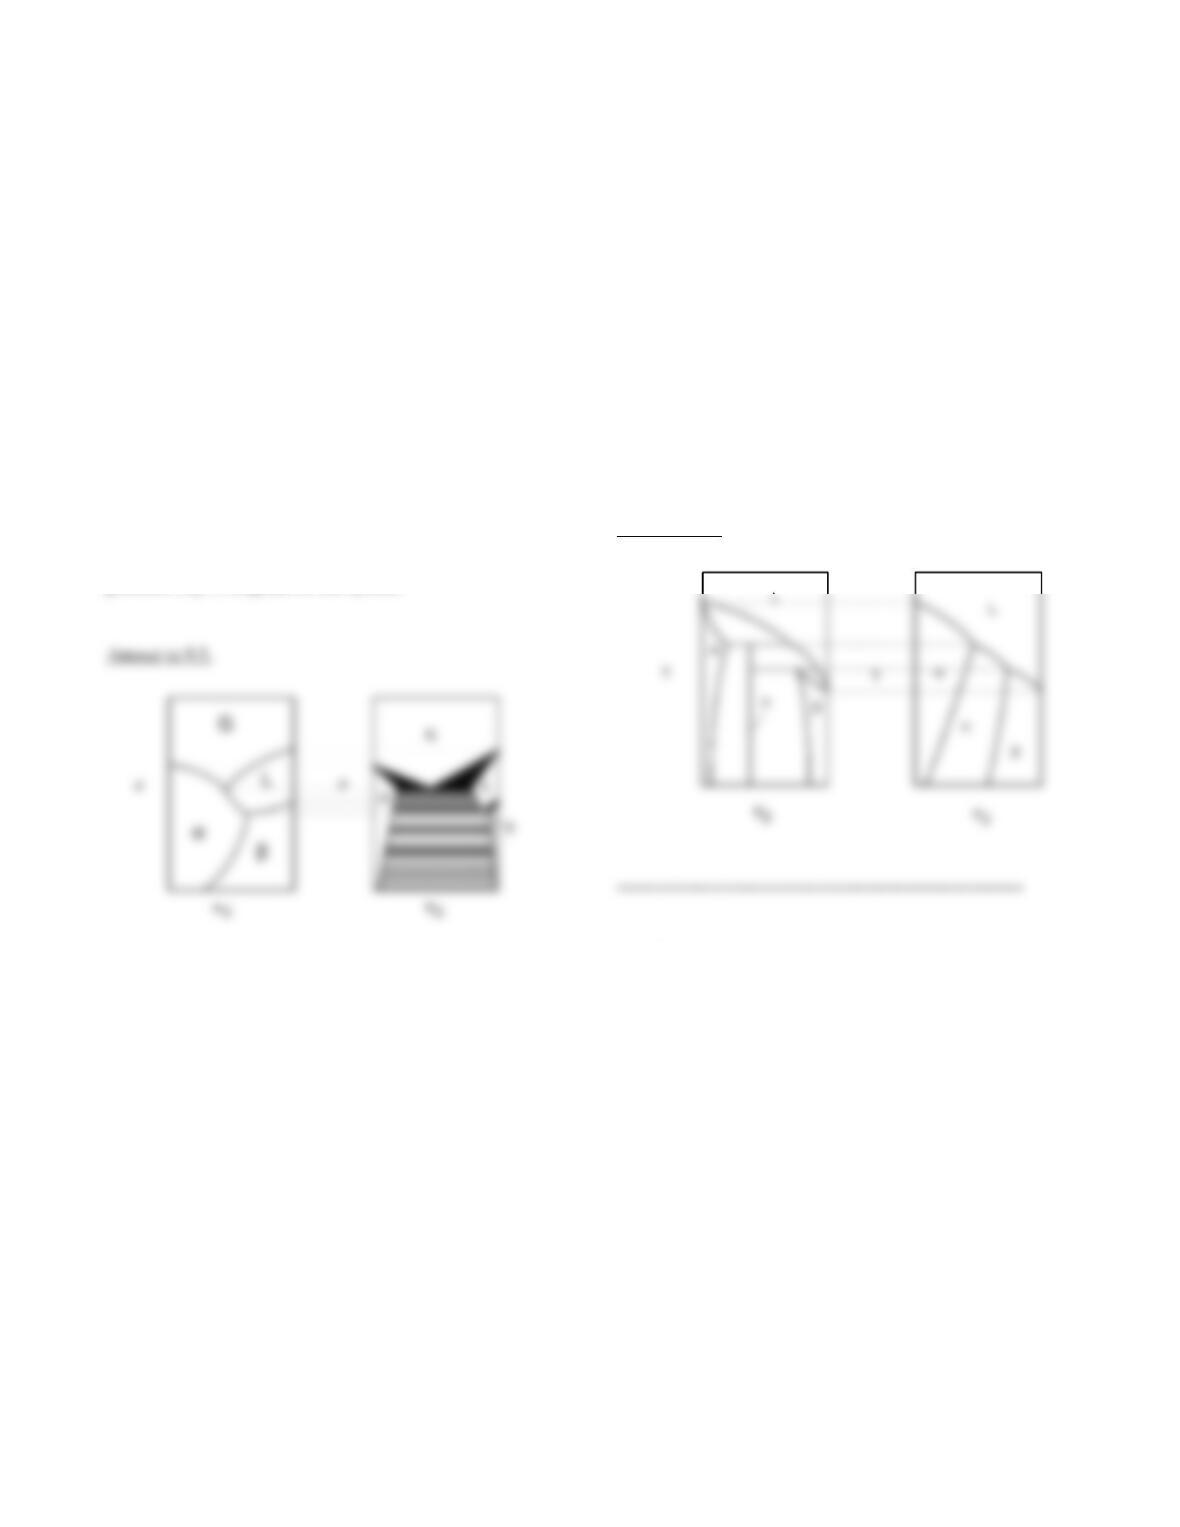
9.5. Sketch a (a2, P) section through the phase diagram for the
binary system shown in Figure 9.5a at a constant temperature.
Choose a temperature that lies between the triple points of the
pure components. Use the resulting cell structure to sketch a
plausible (X2, T) diagram for this system.
———–———–———————————–———–
9.6. Consider the phase diagram drawn in Figure 10.20, plotted
in (T, X2) space. Sketch a plausible phase diagram for this
system in (T, a2) coordinates.
Answer to 9.6.
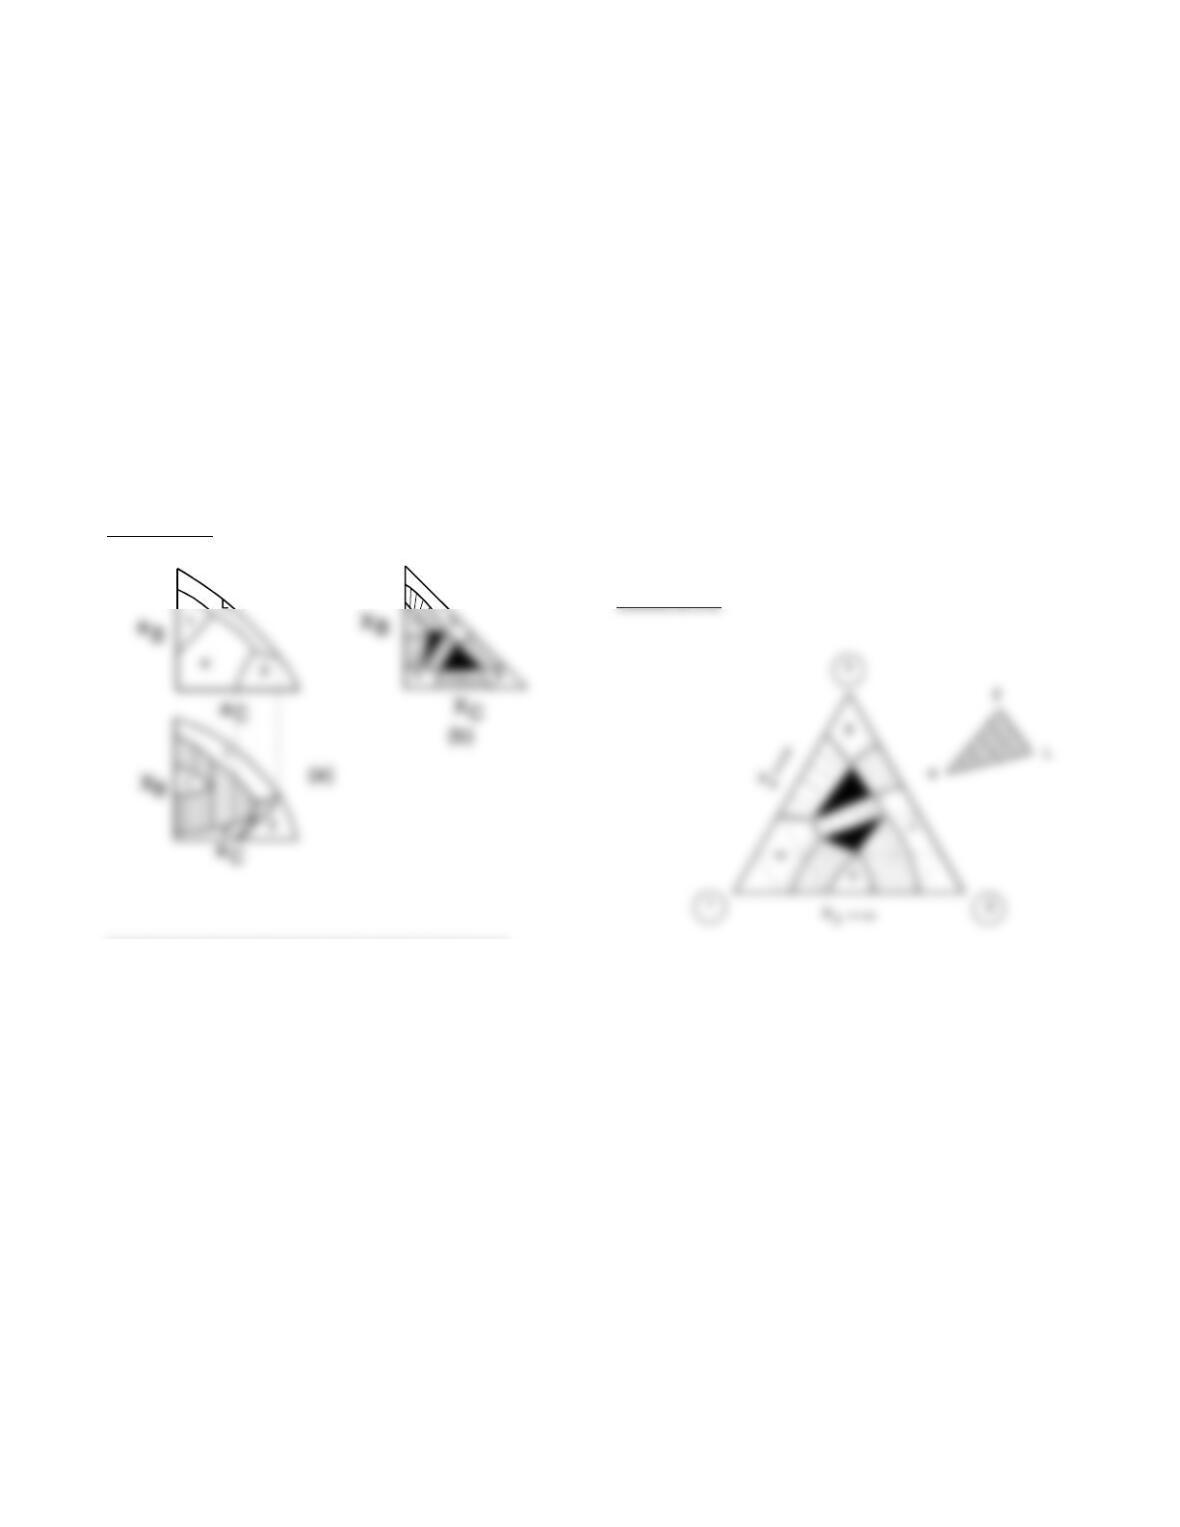
9.7. Sketch an isothermal isobaric phase diagram for the A – B –
C system in (aB, aC) space; assume this system exhibits four
different phases at the temperature of interest. Sketch equivalent
phase diagrams for this system
a. in (XB, aC) space;
b. on the Gibbs triangle in (XB, XC) space.
Chapter 9.Multicomponent Heterogeneous Systems 82
Answer to 9.7.
———–———–———————————–———-
9.8. Sketch or otherwise reproduce the phase diagram shown in
Figure 9.7c. In the two and phase three fields construct contours
that represent a constant molar fraction of the phases involved.
Use the lever rule to construct contours at fI = 0.2, 0.4, 0.6 and
0.8.
Answer to 9.8.
———–———–———————————–———
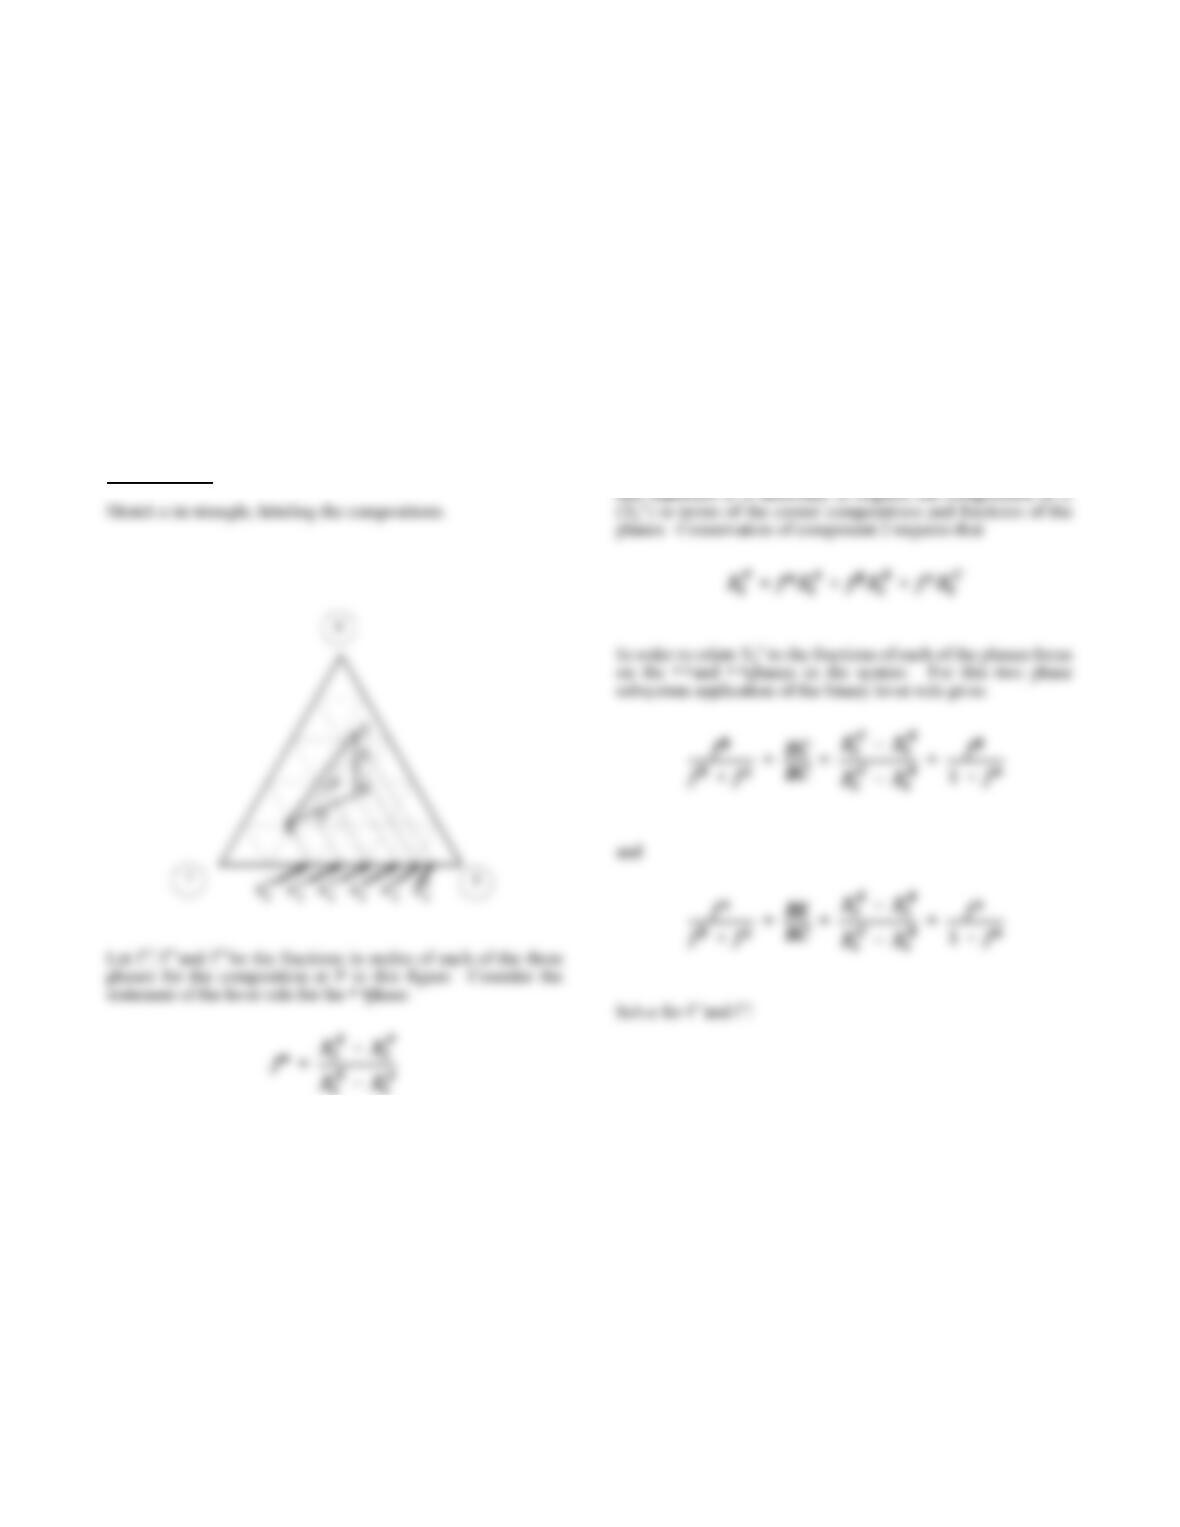
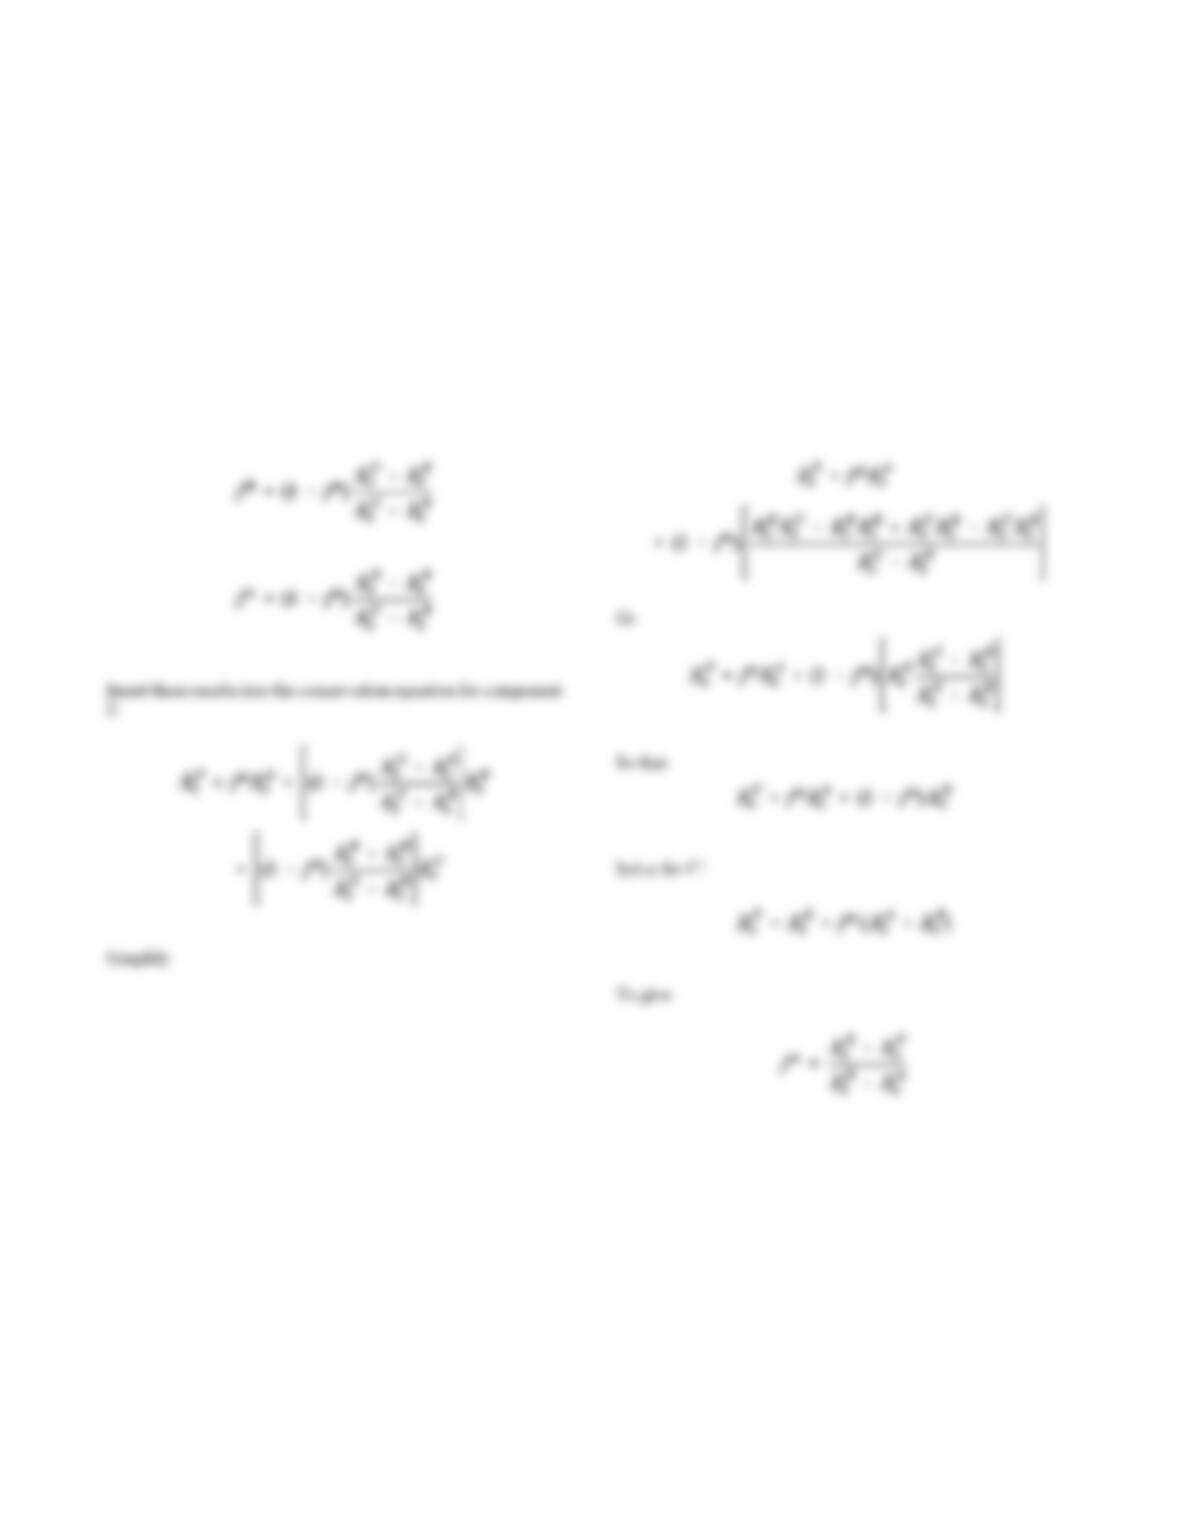
9.9. Prove the lever rule construction for tie triangles.
Chapter 9.Multicomponent Heterogeneous Systems 83
Answer to 9.9.
An analogous relation holds for the • • and • • phases. To prove
Chapter 9.Multicomponent Heterogeneous Systems 84
Chapter 9.Multicomponent Heterogeneous Systems 85
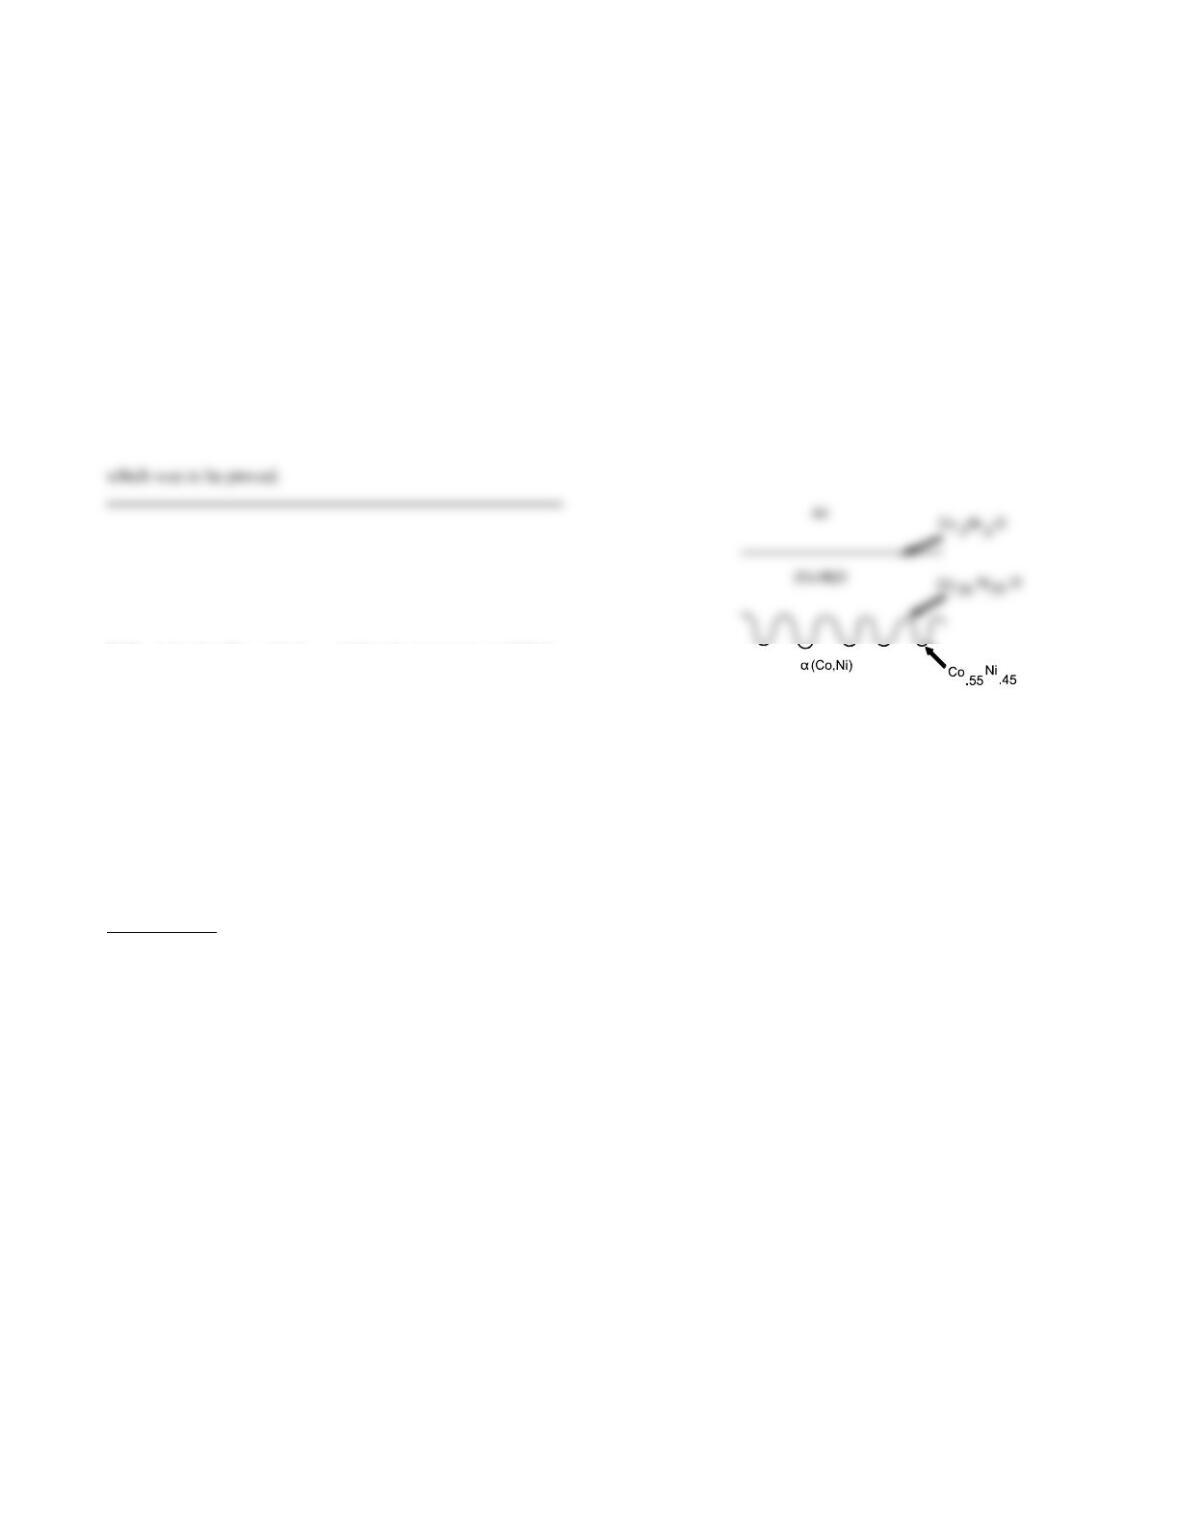
9.10. A Co-Ni alloy with XNi = 0.20 is heated in air at 1600 K.
The phase diagram for this system is shown in Figure 9.15. The
oxygen potential must vary from nearly 0 in the gas phase to a
large negative number in the alloy. This variation can contain no
discontinuities if the oxidation process is diffusion controlled.
The curve on Figure 9.15 represents the sequence of states the
system has at some point in the oxidation process.
a. Sketch a microstructure that could correspond to this
sequence.
b. Label the interfaces in your microstructure and
evaluate the compositions at the interfaces in the system.
Answer to 9.10
———–———–———————————–———–
9.11. Figure 9.14 illustrates a phase diagram and composition
profile that may characterize the early stages of precipitation of
• • from • • for an alloy of composition X2
o that was solution
treated then quenched to the temperature T2.
a. Sketch a • • precipitate particle in its • • matrix.
b. Sketch the composition profile that would result if this
sample were taken to equilibrium at T2.
c. Use the structure in part b as the starting structure.
Imagine the sample is heated rapidly (upquenched) to T1
and held. Use the principle of local equilibrium and the
phase diagram to determine the interface compositions at
T1. Sketch the composition profile that must develop
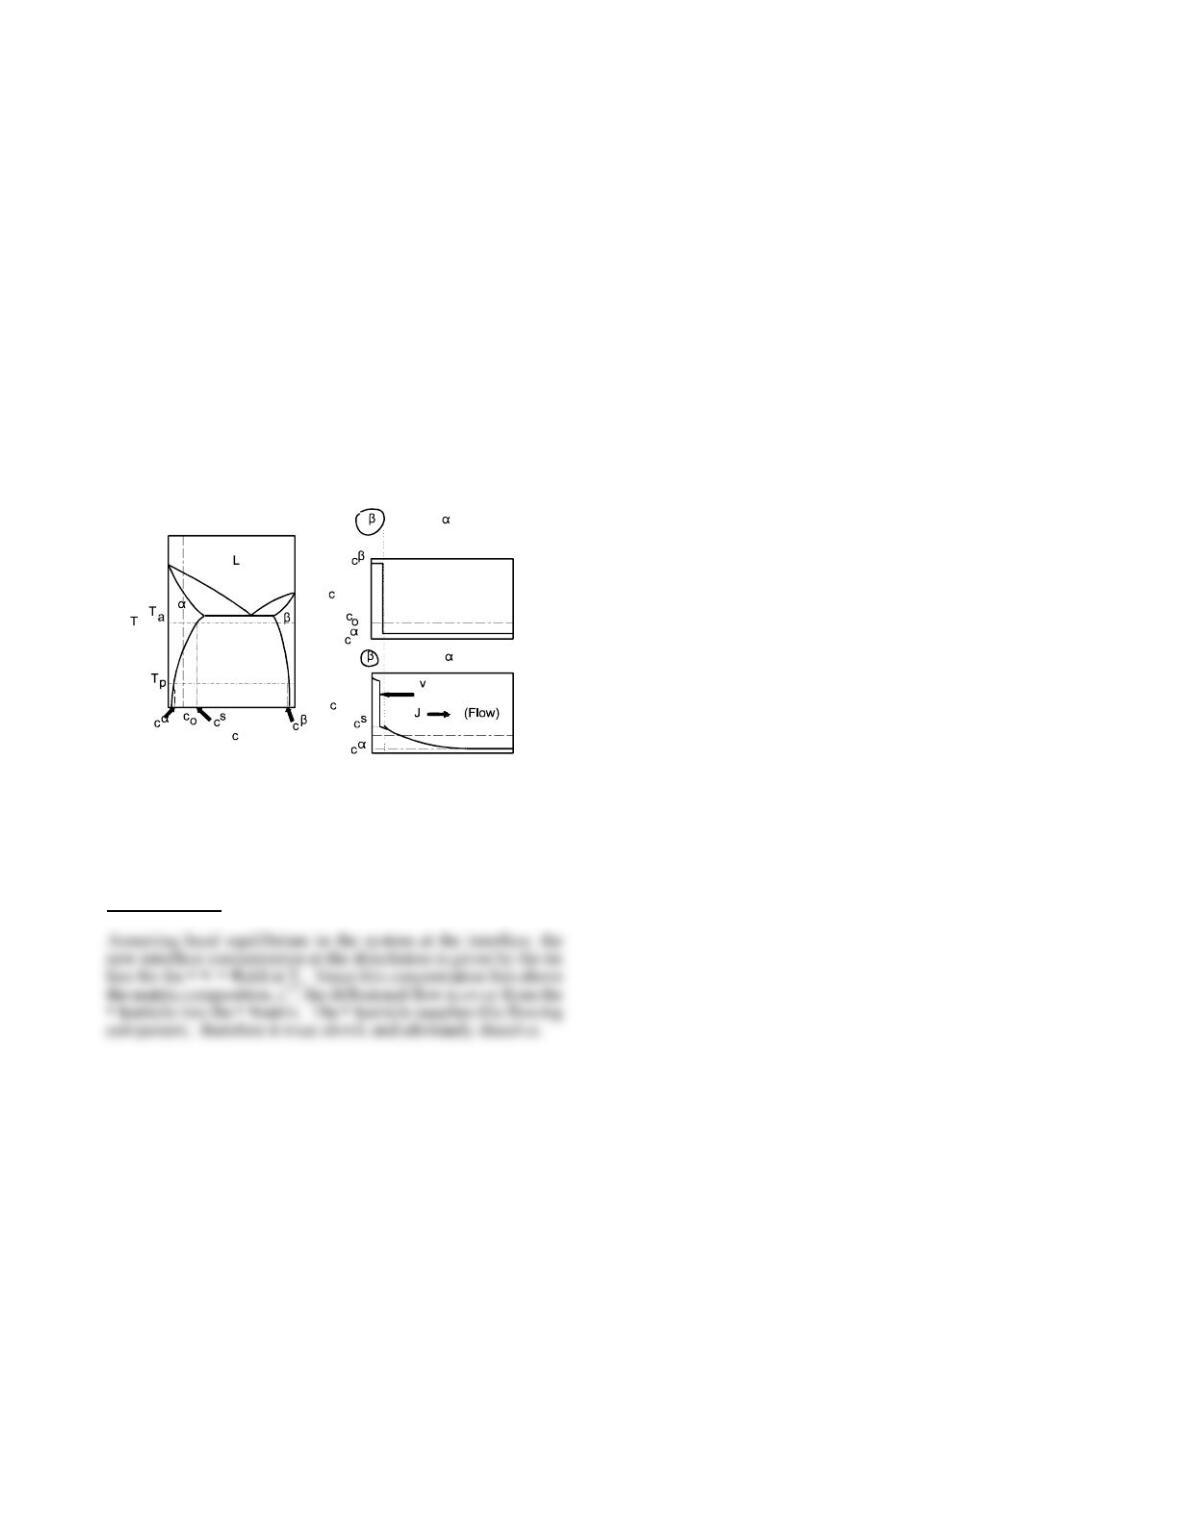
Chapter 9.Multicomponent Heterogeneous Systems 86
from the starting structure obtained in part (b).
d. Argue that this composition is precisely what is
needed to dissolve the • • particle.
Answer to 9.11.