Chapter 10. Phase Diagrams
Chapter 10. Thermodynamics of Phase
Diagrams
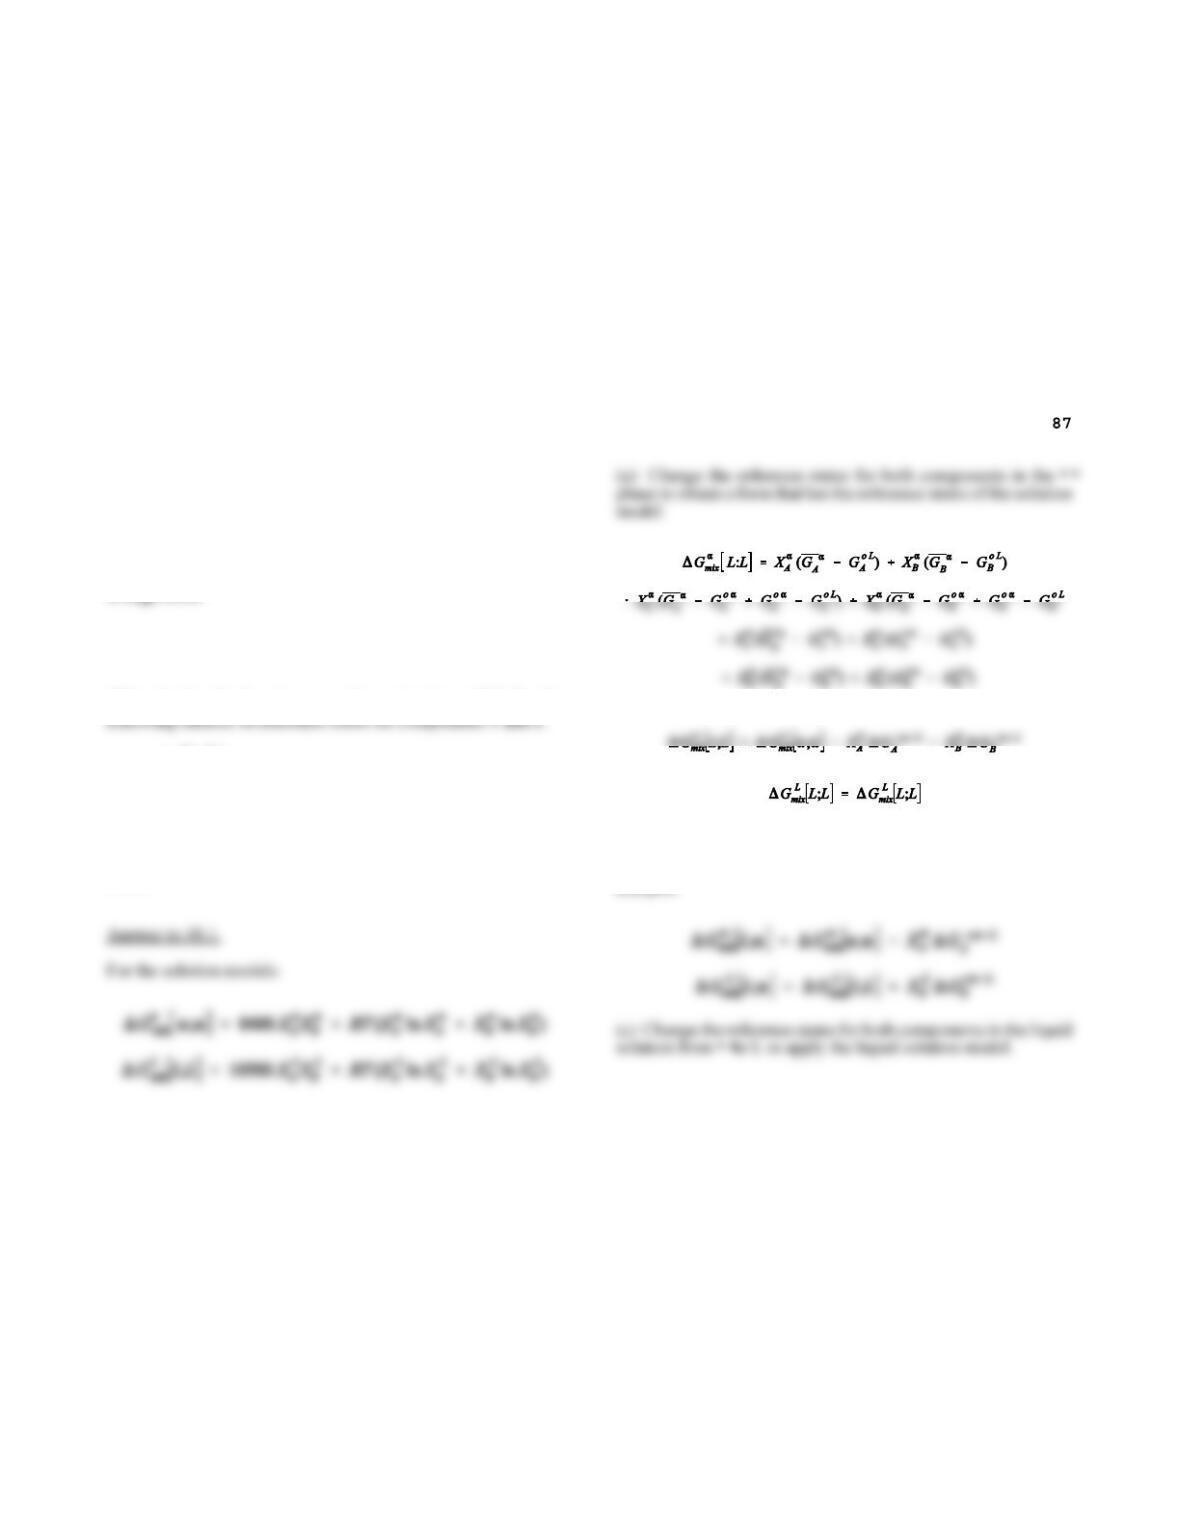
10.1. Replot the G – X curves shown in Figure 10.2 for the
a. {L; L};
b. {L; • •};
c. {• •;• •}.
Curves are computed with the following information: solution
models are simple regular solutions.Tm1 = 1500 K; Tm2 = 850 K;
• •Sm1 = 9 J/mol; • •Sm2 = 7 J/mol; a0
• •
= 8,400 J/mol; a0
L = 10,500
J/mol.
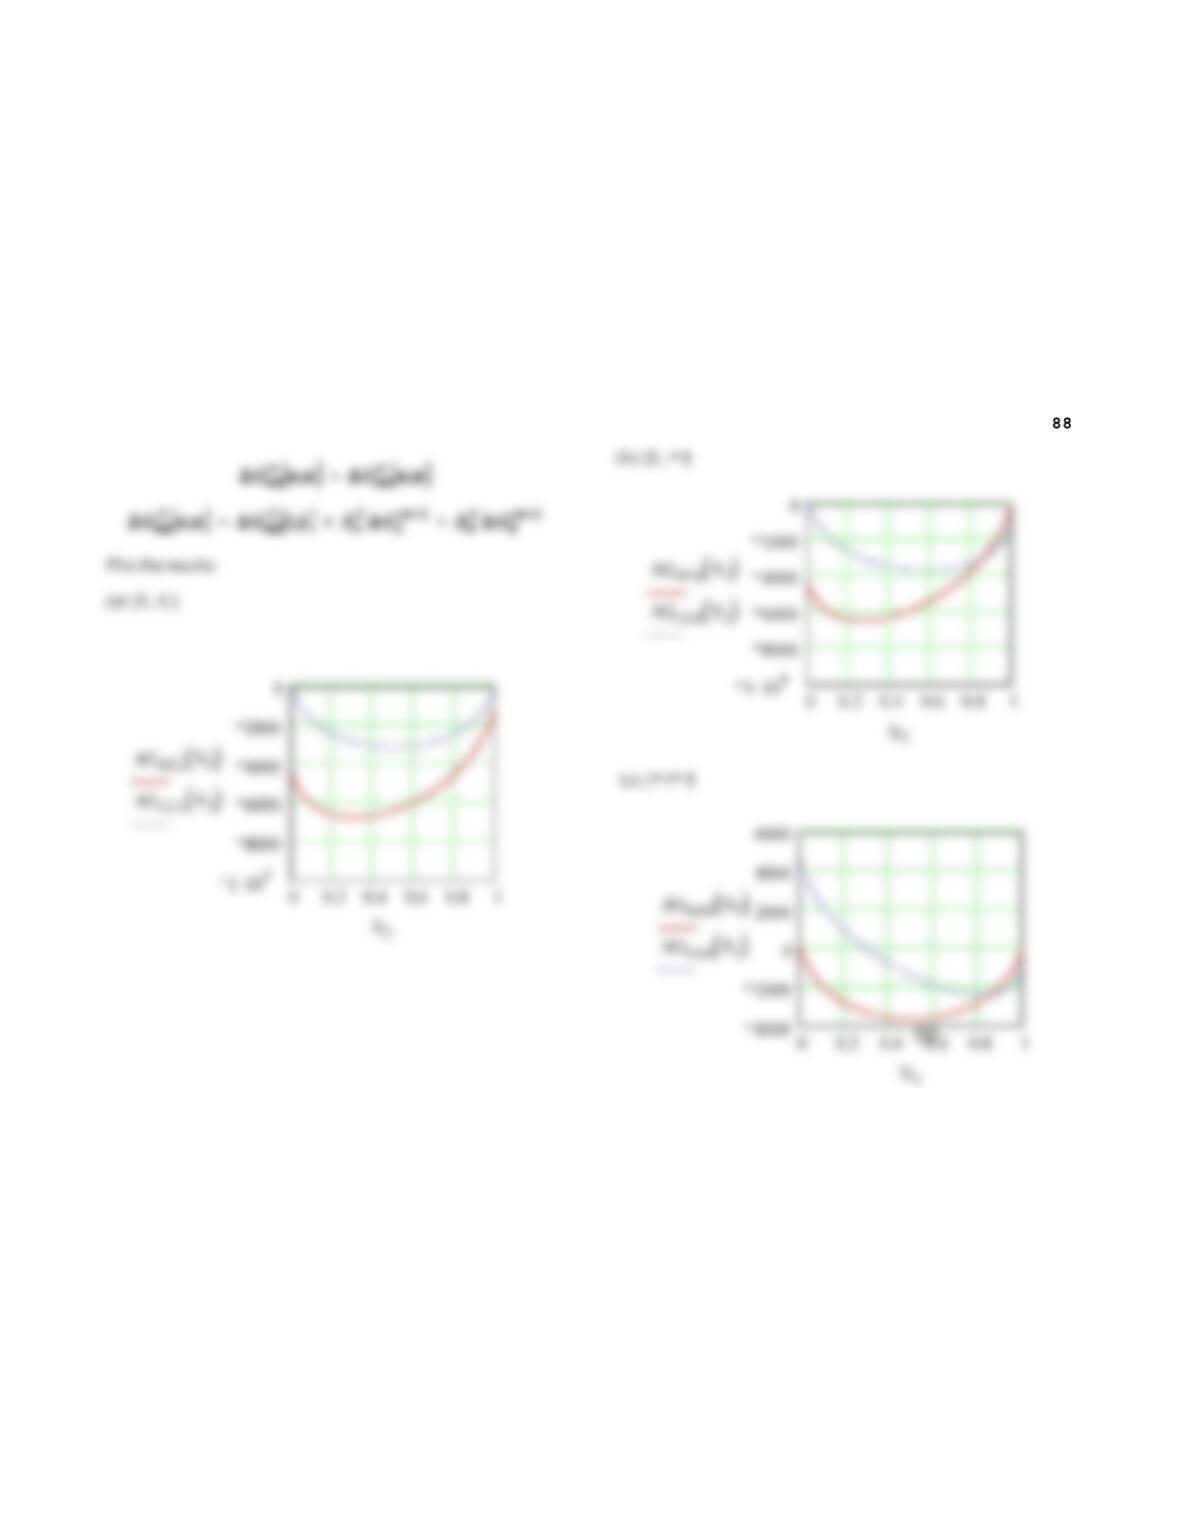
(b) Change the reference state for A in the • • solution from L to
• •; change that for B in the liquid solution from • • to L. Compute
and plot:
Chapter 10. Phase Diagrams
Chapter 10. Phase Diagrams
10.2. The A-B system forms regular solutions in both the • • and
liquid phase forms. Parameters for the heat of mixing for these
phases are a0
• •
= -8200 J/mole and a0
L = -10500.
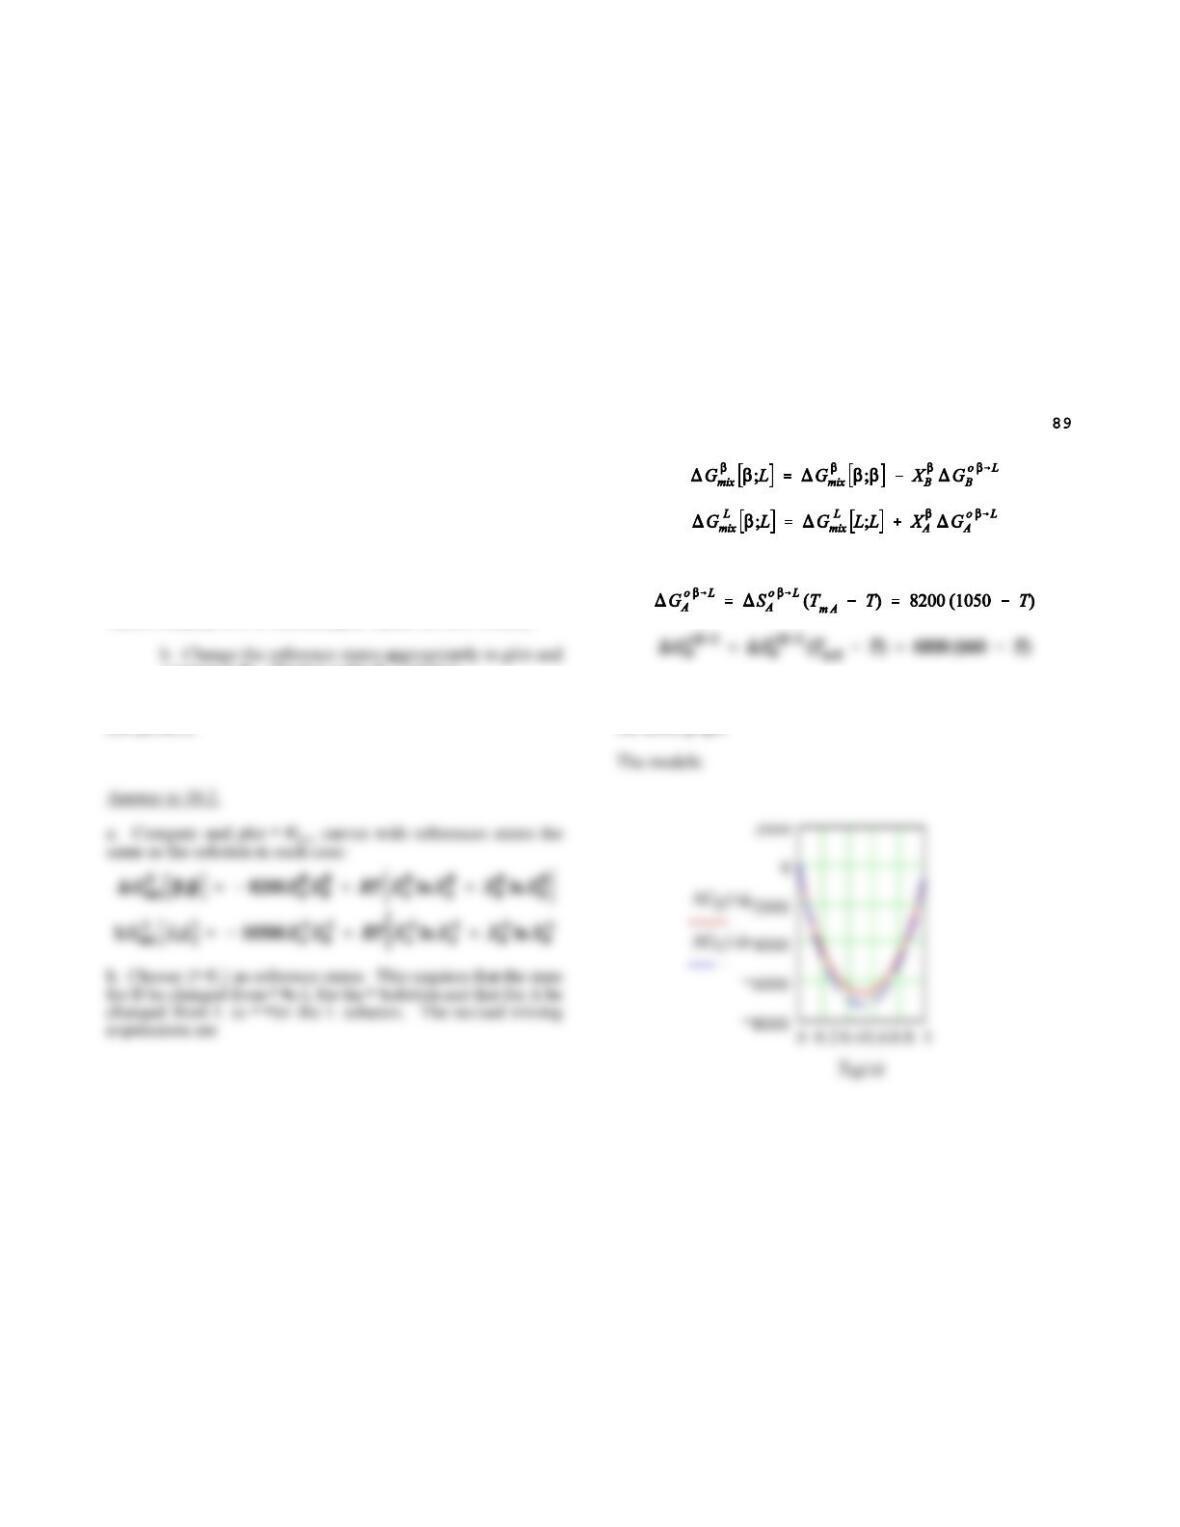
a. Compute and plot curves for • •Gmix for the • • and
liquid phases for these models at 800 K.
Pure A melts at 1050 K with a heat of fusion of 8200 J/mole.
Pure B melts at 660 K with a heat of fusion of 6800 J/mole.
compare • •Gmix
• •
{• •; L} and • •Gmix
L{• •; L}.
Neglect differences in heat capacities for the phases for the pure
components.
where
Set T = 800 K as stated in the problem, compute • •GA
o and • •GB
o,
insert in the expressions for • •Gmix for each solution and plot on
the same graph.
Chapter 10. Phase Diagrams
0
2000
With {• •; L} reference states:
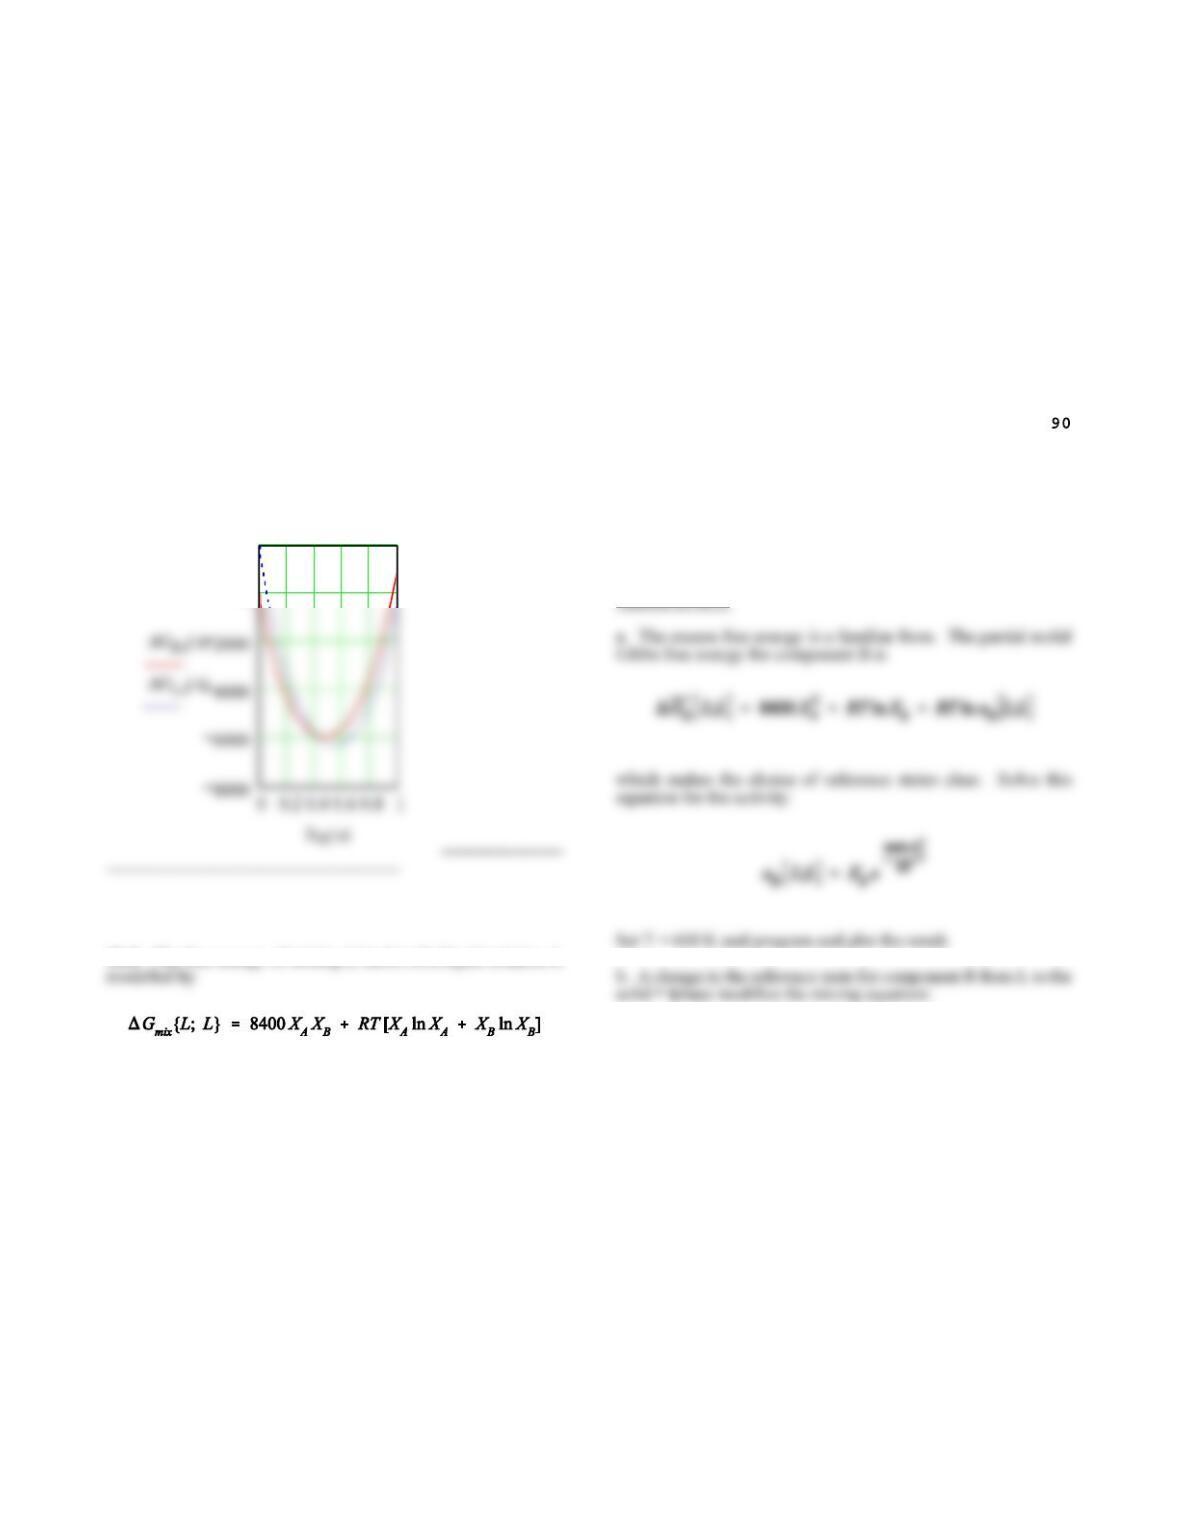
10.3. The free energy of mixing (J/mole) of a liquid solution is
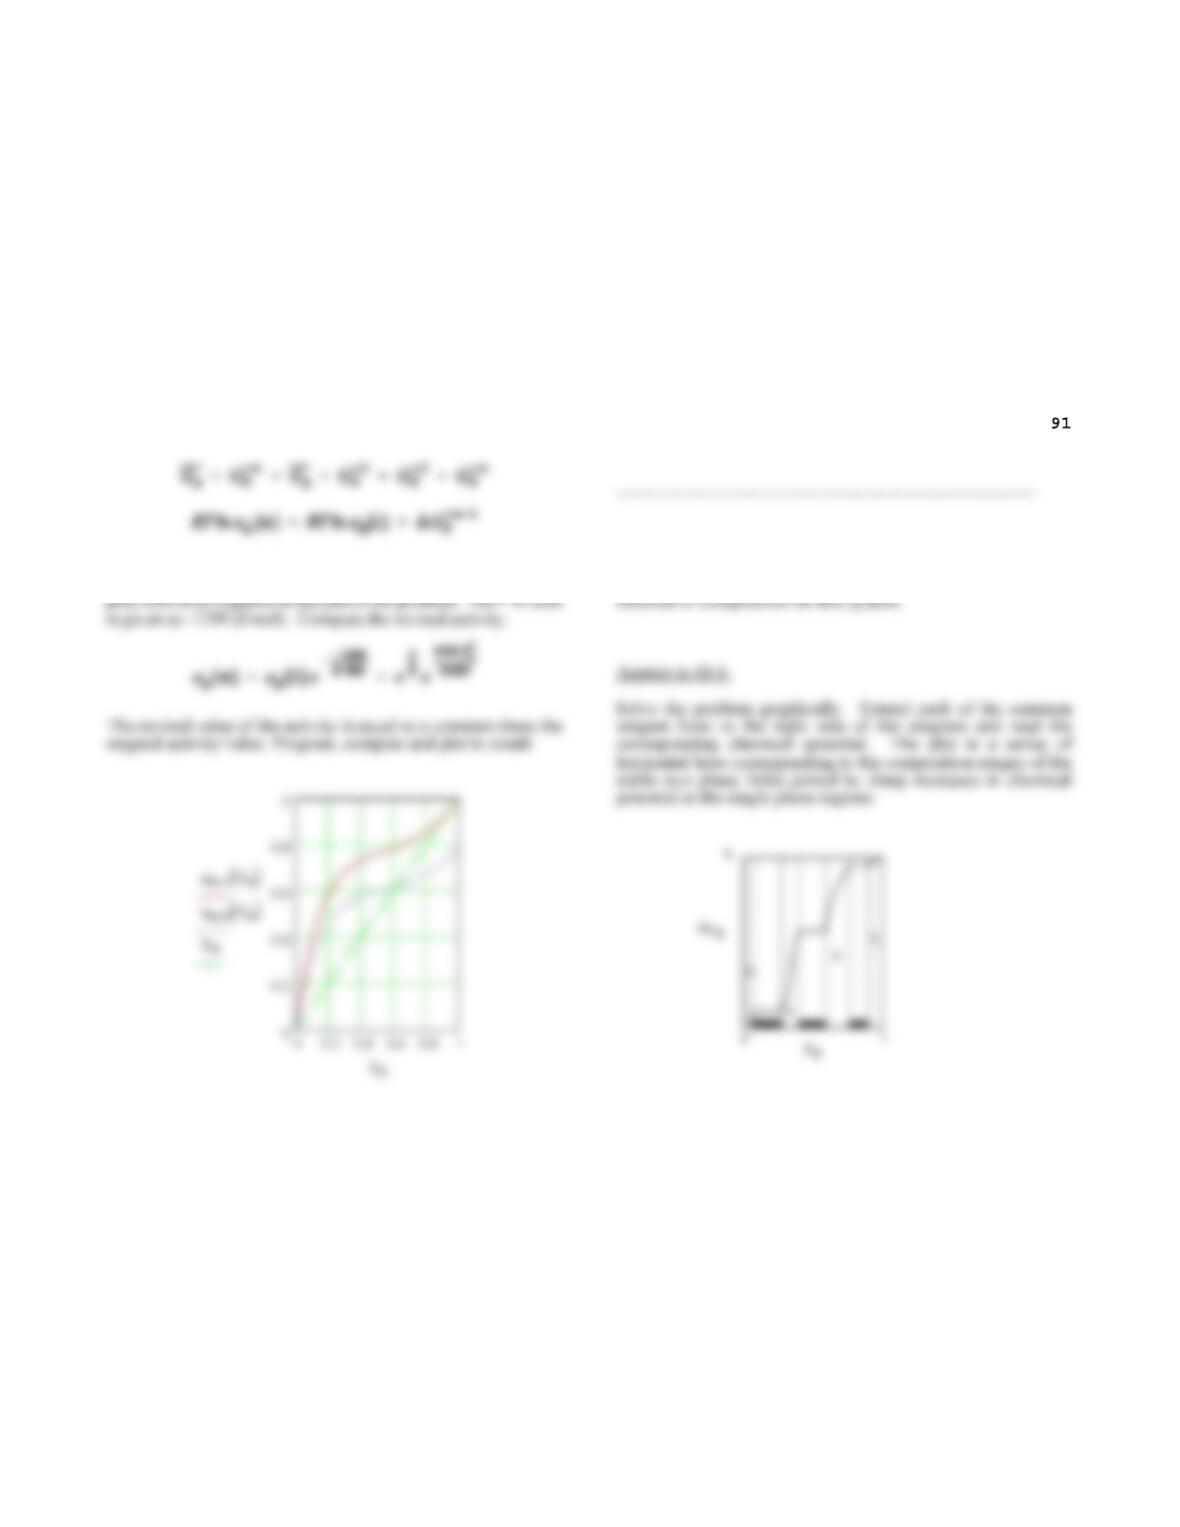
a. Compute and plot aB as a function of composition at
600K for this solution.
b. The free energy of fusion of pure B at 600 K is
computed to be -1200 J/mole. Compute and plot the
activity of B as a function of composition for the choice
of reference states {L; • •}.
Answer to 10.3.
Chapter 10. Phase Diagrams
where aB[L] is the activity of B referred to a liquid reference
state as computed in part (a) and aB[• •] is the activity referred to
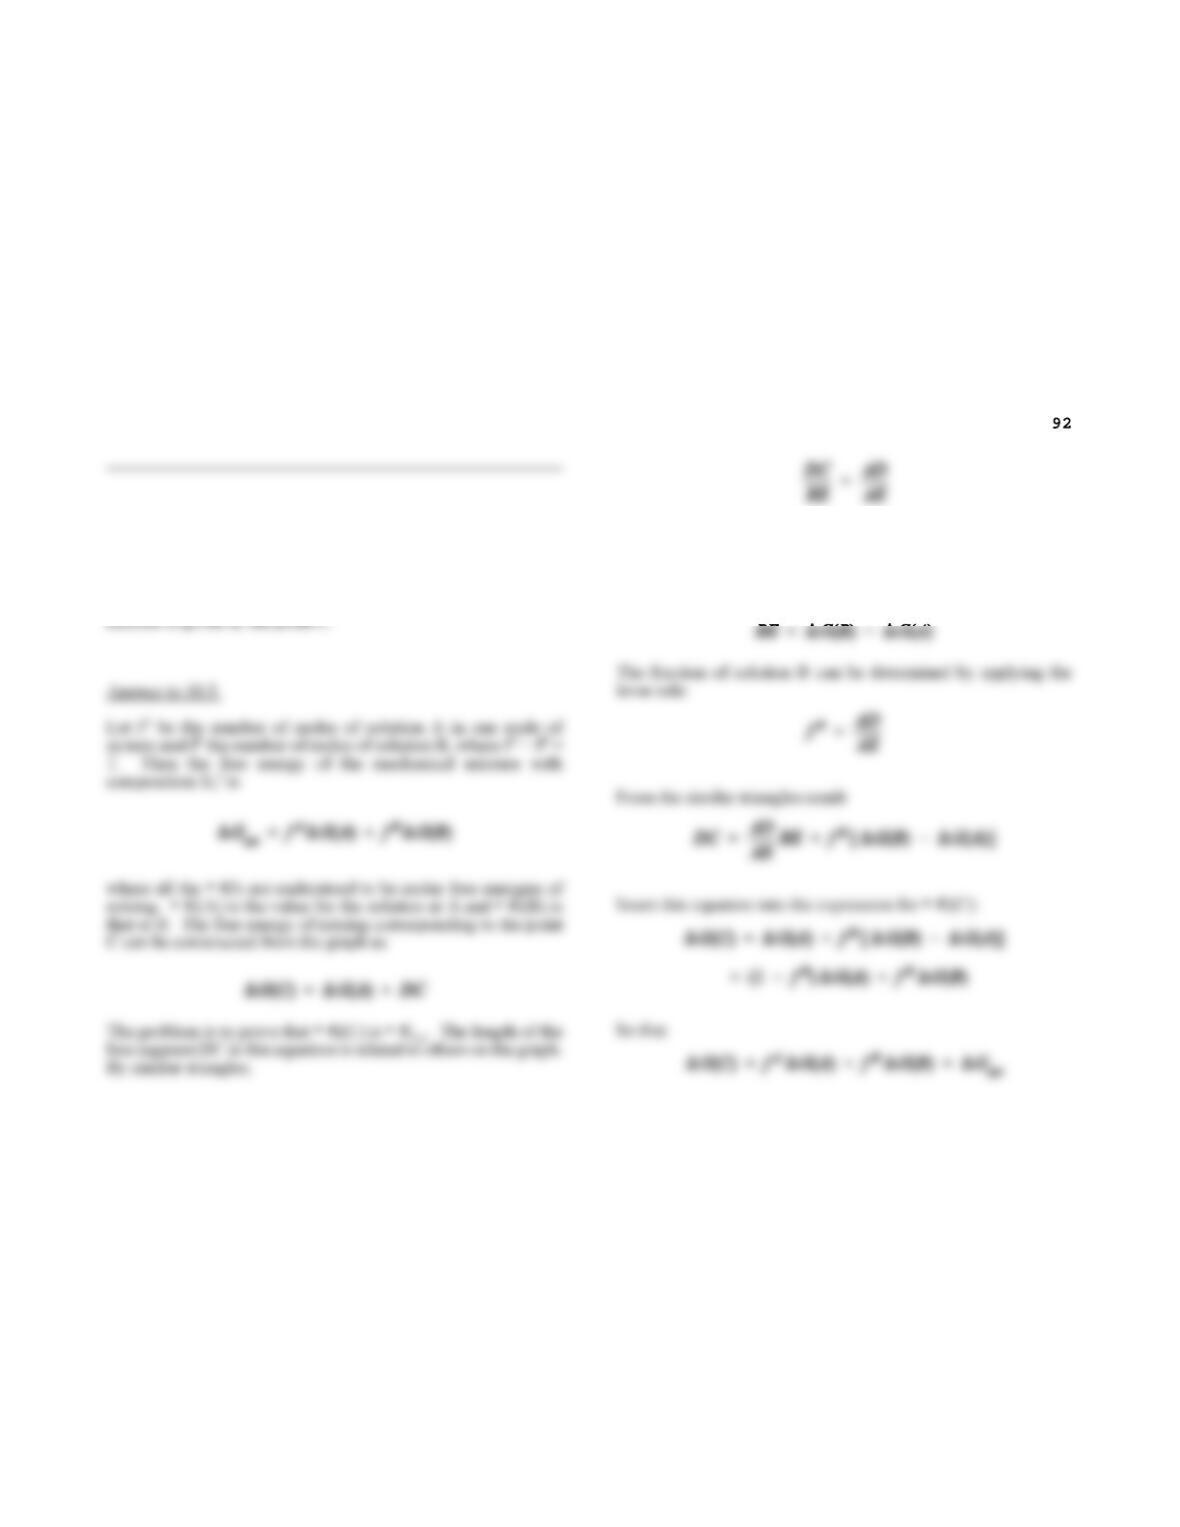
10.4. Use the taught string construction given in Figure 10.8 to
construct a plot of the chemical potential of component 2 as a
Chapter 10. Phase Diagrams
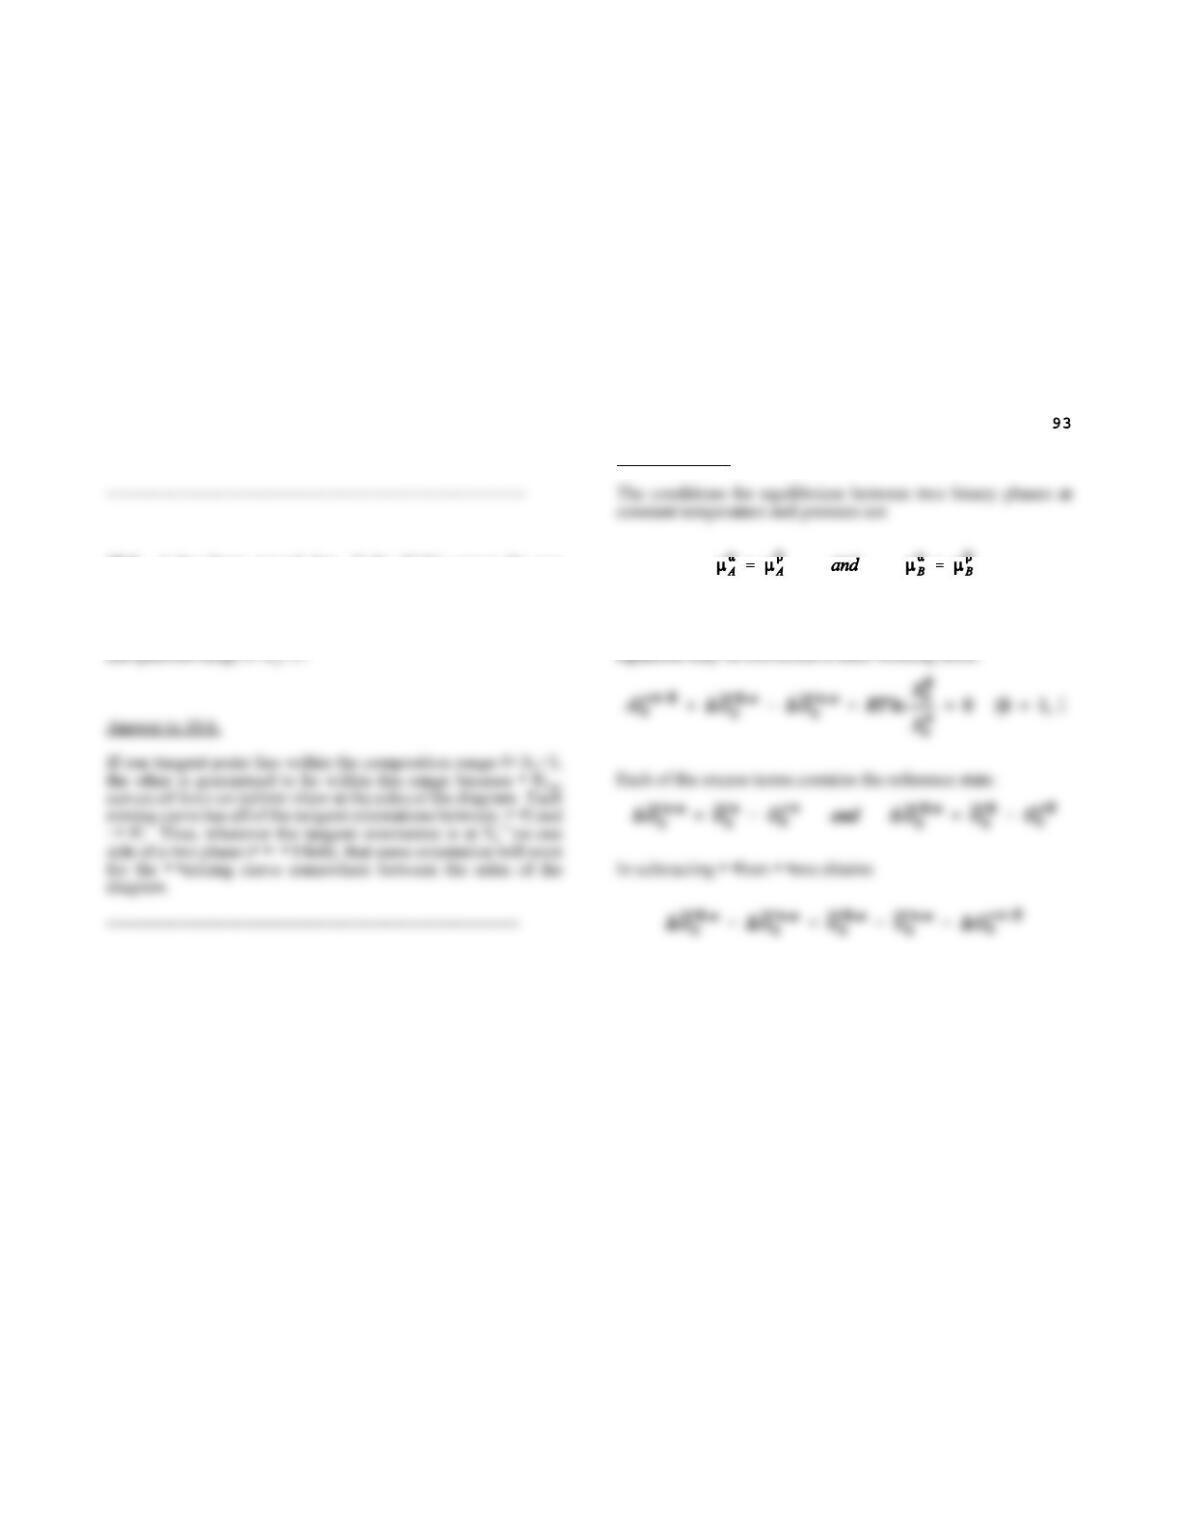
10.5. Consider the (G/X) curve plotted in Figure 10.5. A
mechanical mixture is formed by taking quantities of two
solutions with compositions given by the points A and B in this
figure so as to give a system with an average composition X2
o.
Prove that the Gibbs free energy of mixing for this two-solution
Note that the line length
Chapter 10. Phase Diagrams
as was to be demonstrated.
10.6. It has been argued that, if the (G/X) curves for two
different phases cross within the diagram, then it is always
possible to construct a common tangent line that straddles the
crossing point. What aspect of the behavior of (G/X) curves
guarantees that both tangent points will in fact lie within the
10.7. Prove that a change in the reference states of either or both
of the (G/X) curves producing a common tangent construction at
some temperature will not alter the compositions at which the
tangents occur.
Answer to 10.7.
The equations do not involve the reference states. These
Upon substitution of this result into the original equation it is
noted that the two • •Gk
o terms cancel.
———–——–——————–———-——–————
Chapter 10. Phase Diagrams
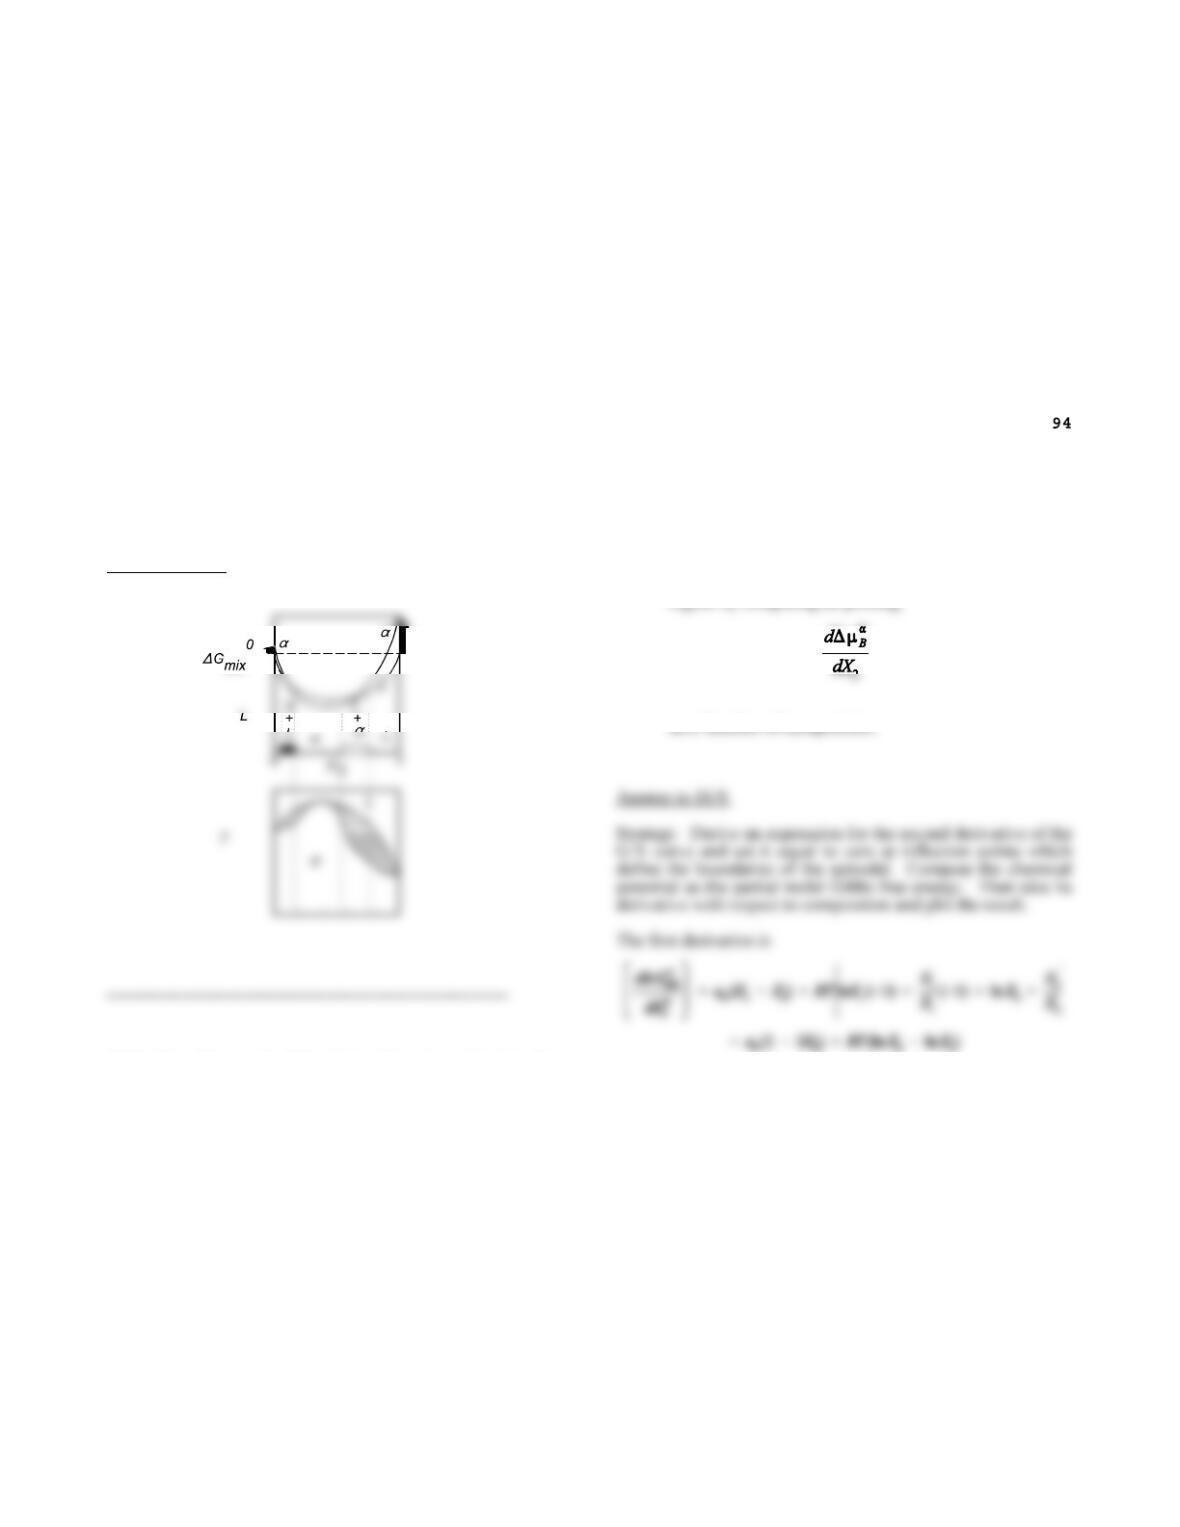
10.8. Sketch a sequence of (G/X) curves that would produce a
maximum in an (• • + L) two phase field.
Solution to 10.8.
10.9. Consider an • • solid solution that obeys the “simplest
regular solution” model, with the interaction parameter a0 =
12,700 (J/mole). This solution exhibits a miscibility gap below
Tc = 746 K. At 650 K,
a. Compute the compositions of the limits of the spinodal
region.
b. Compute and plot • • • •
B
• •
= • •
B
• •
– • •
B
o• •
as a function of
composition.
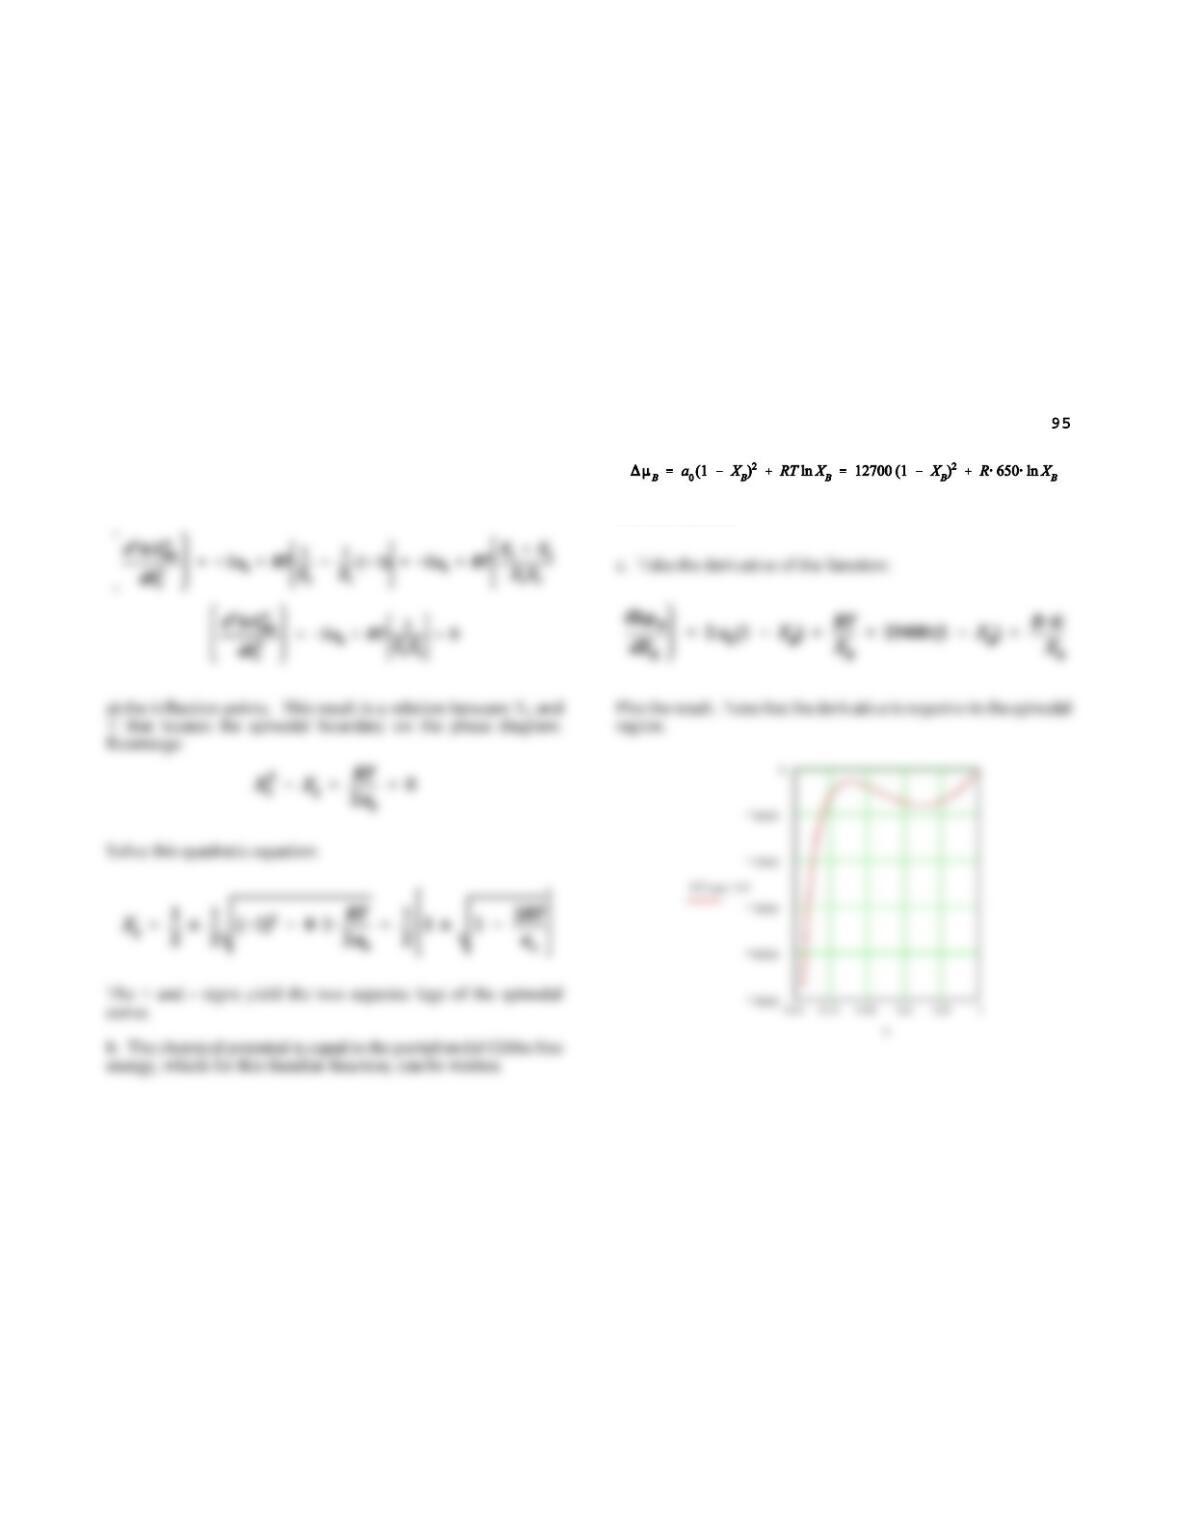
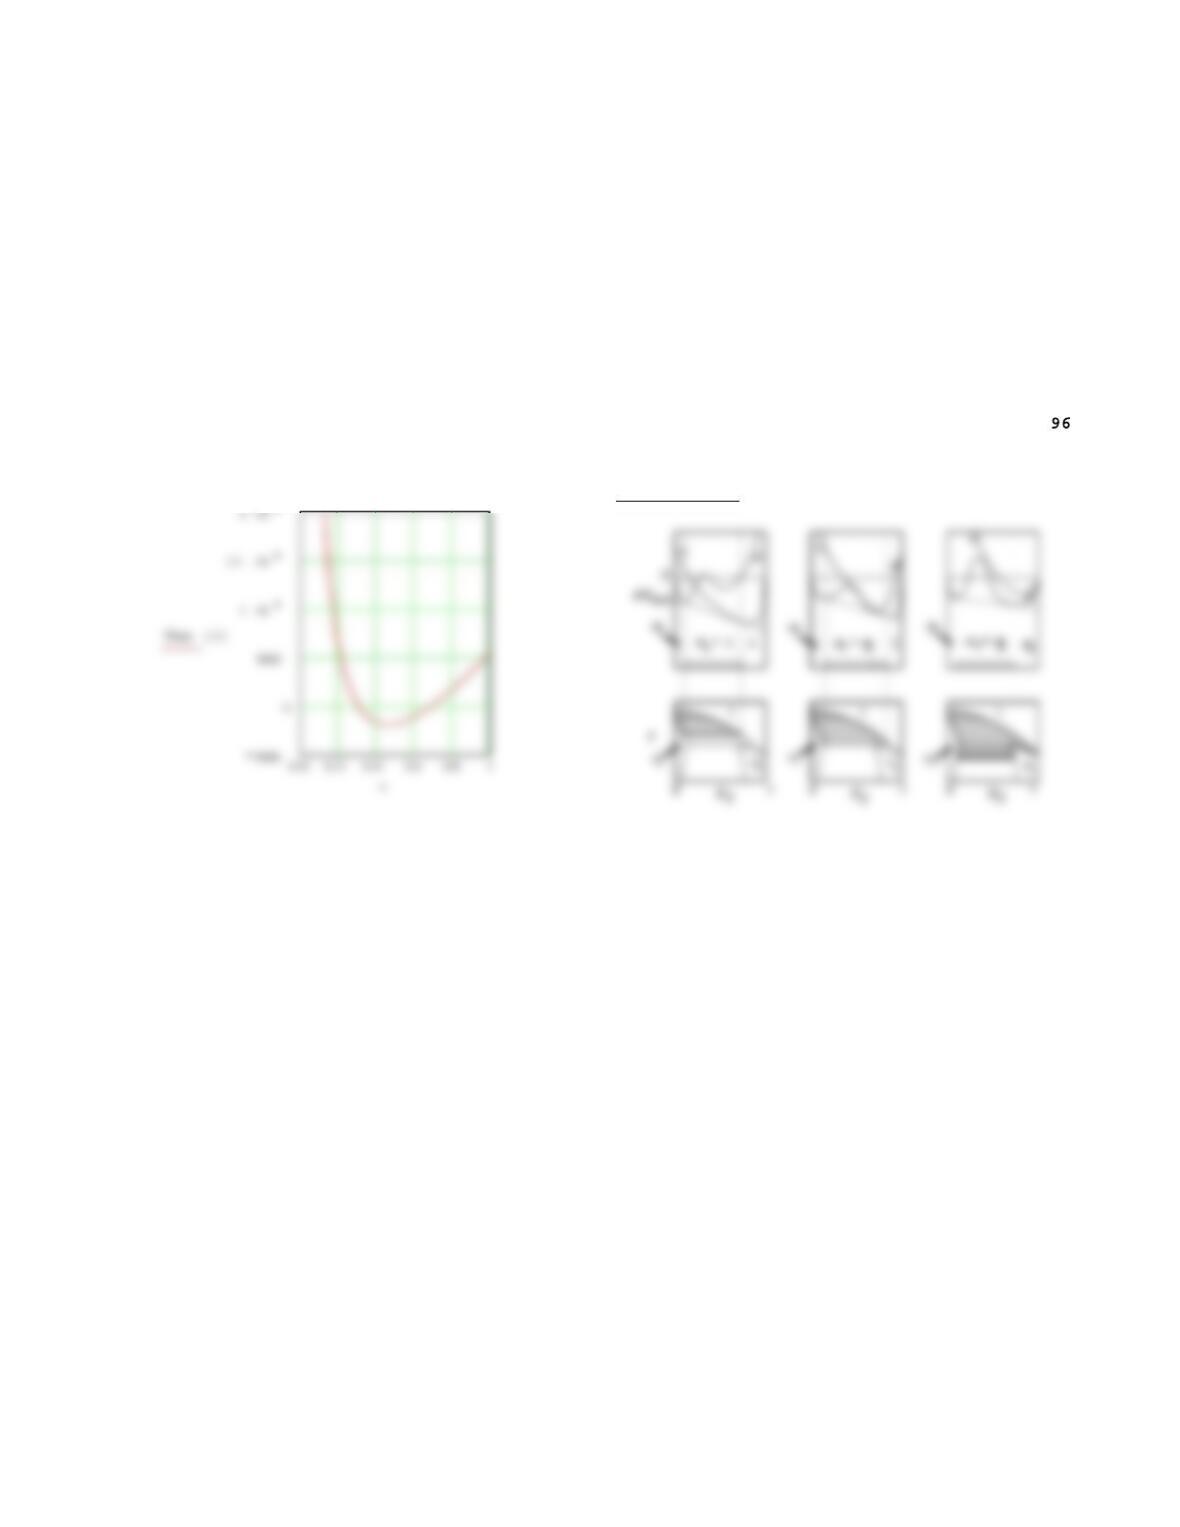
c. Illustrate the peculiar behavior inside the spinodal
region by computing an plotting
The second derivative:
Chapter 10. Phase Diagrams
Plot the function.
Chapter 10. Phase Diagrams
——–————————–———-——————-——–
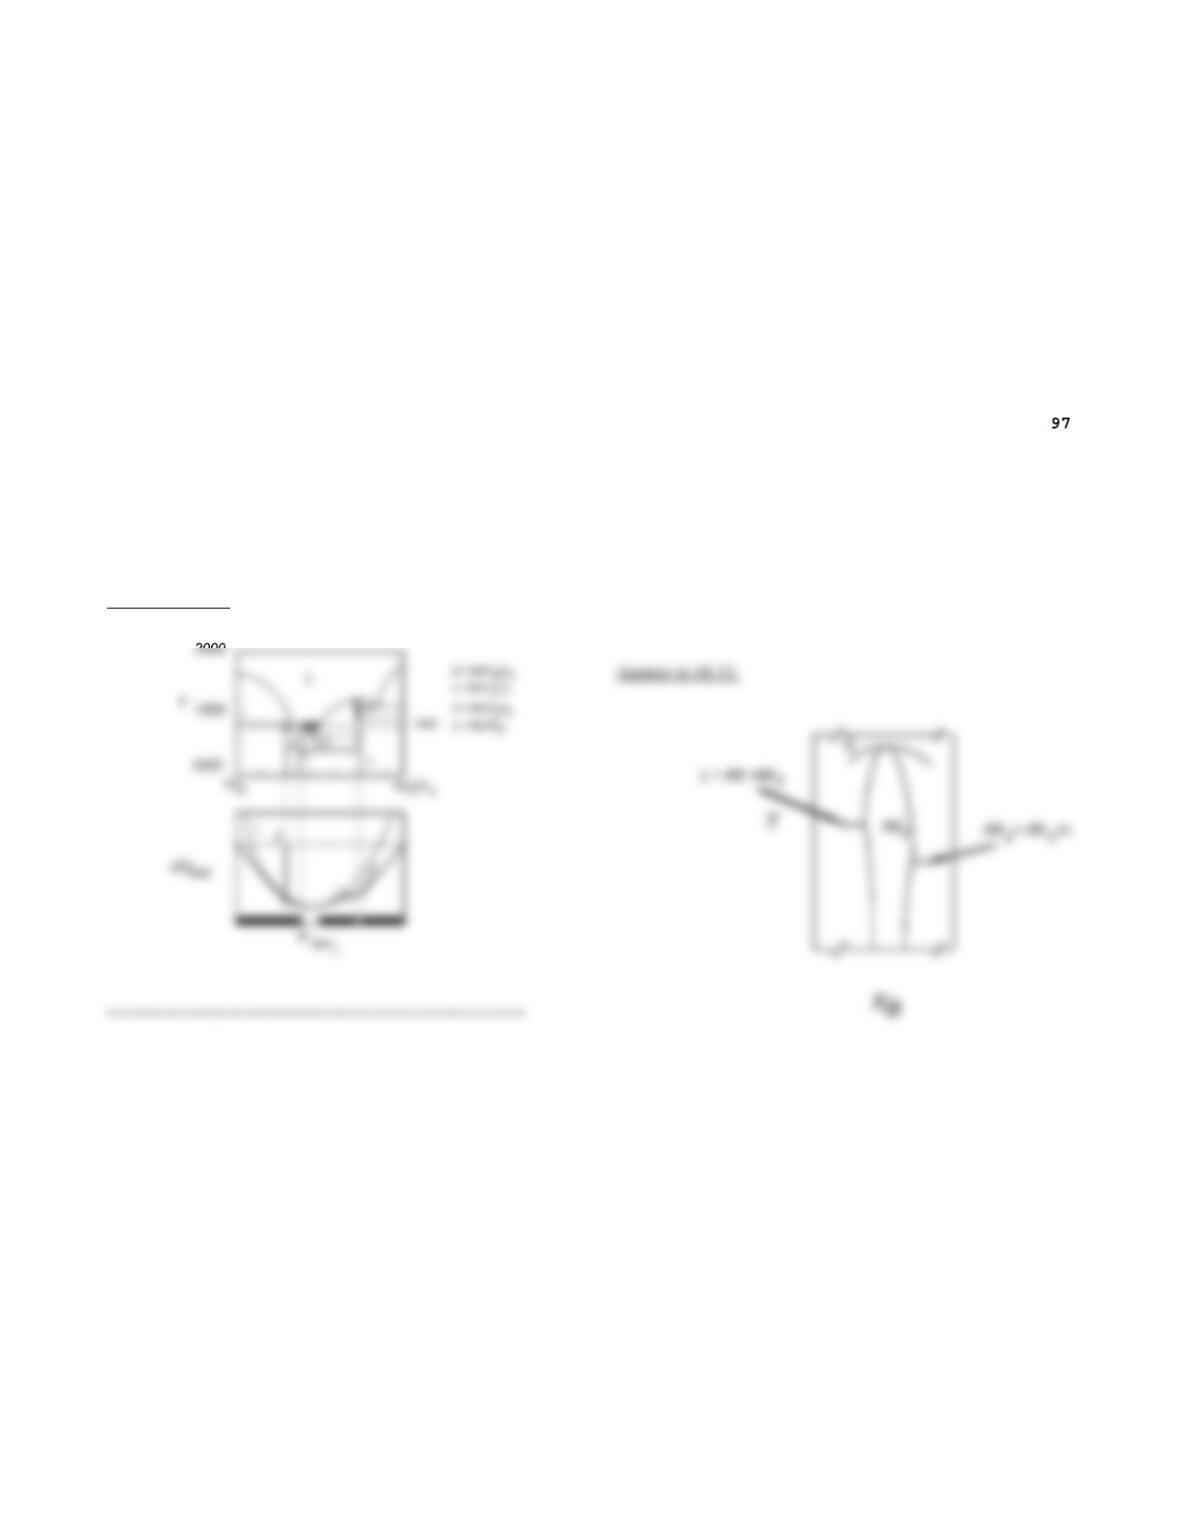
10.10. Sketch a series of (G/X) curves that will produce a
peritectic phase diagram in which both solid phases are the same
phase form, • •, so that the solid-solid two phase field is a
miscibility gap.
Answer to 10.10.
———–——–——————–———-——–————-
Chapter 10. Phase Diagrams
10.11. Look up the phase diagram for the BaO2 -TiO2 system.
Sketch a plausible (G/X) diagram for this system at 1400oC.
Answer to 10.11.
10.12. In Figure 10.28 one of the intermediate compounds forms
at the composition AB2. Sketch the phase diagram in the vicinity
of this composition, expanding the composition axis by a factor
of, say, 1000, so that the departures from stoichiometry may be
displayed.
———–——–——————–———-——–————
Chapter 10. Phase Diagrams
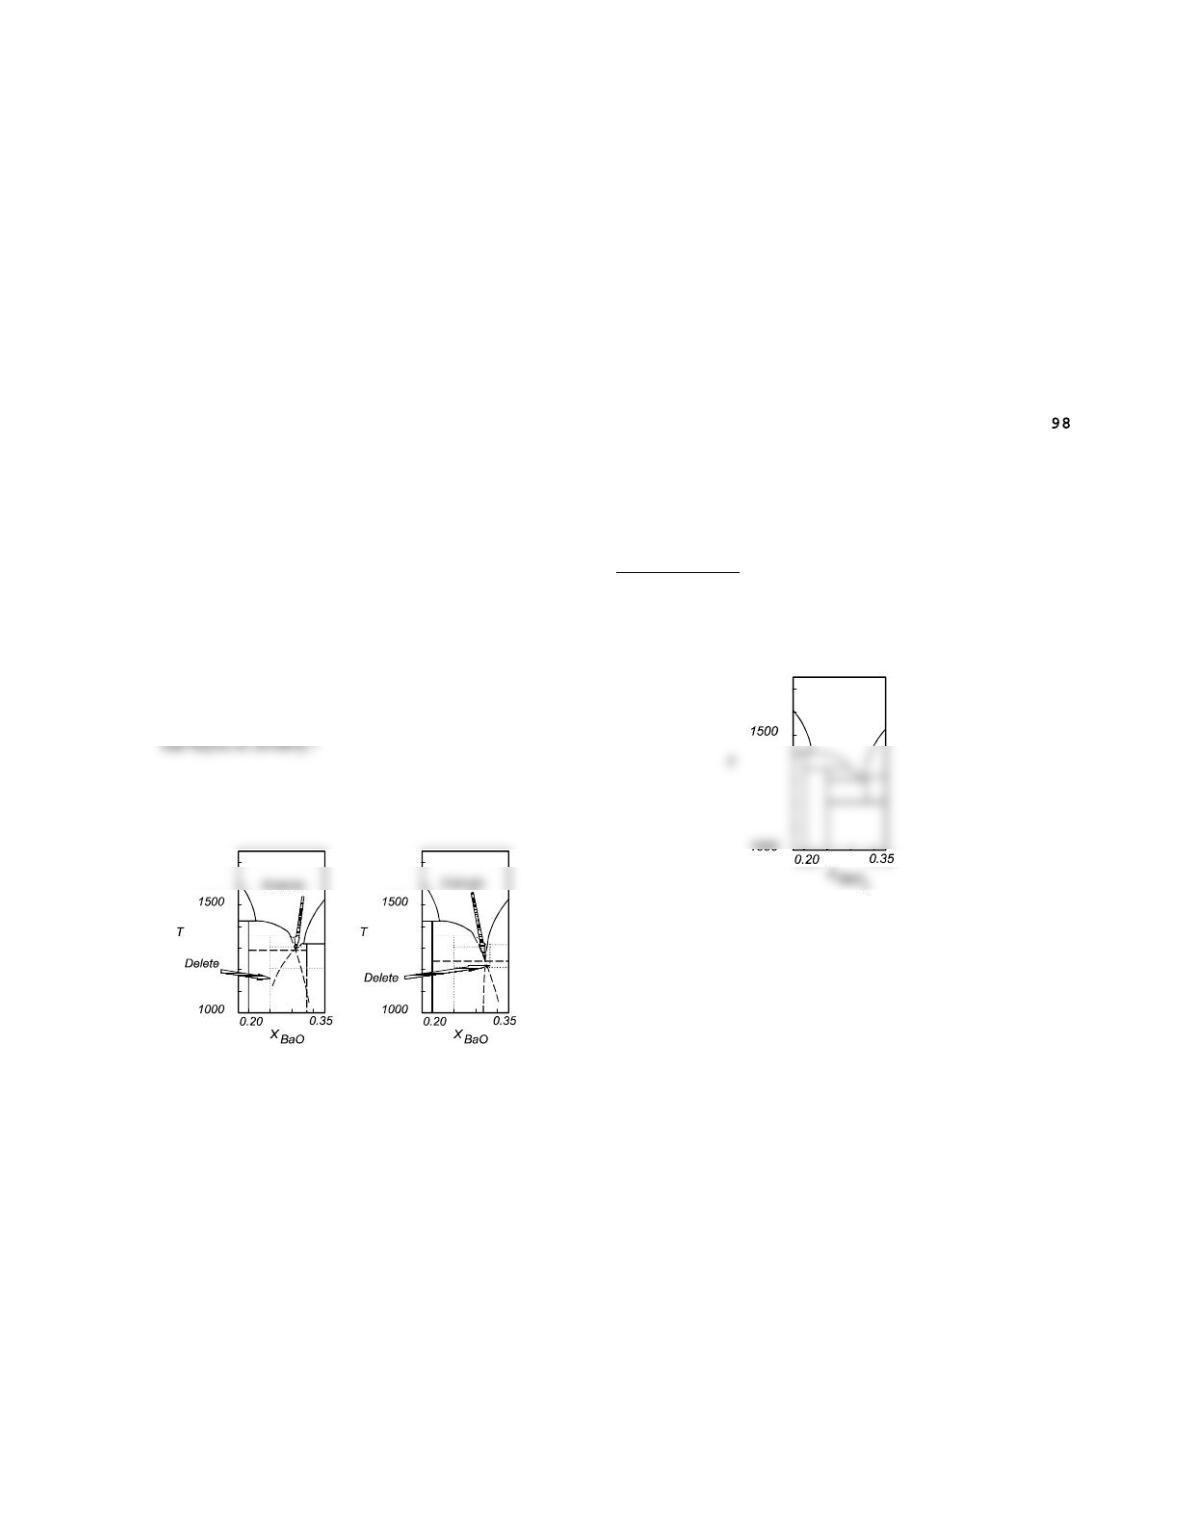
10.13. Refer again to the phase diagram for the BaO2-TiO2
system obtained for Problem 10.11. Suppose that, under practical
solidification conditions in this system the BaTi3O7 phase does
not form.
a. Estimate the composition and temperature of the last
liquid to solidify in this system if this phase does not
form.
b. Suppose also that the BaTi2O5 phase is also sluggish to
form; then what is the temperature and composition of the
Answer to 10.13.
Strategy: Delete the BaTi3O7 phase and extrapolate the liquidus
curves in equilibrium with the adjacent phases.
———–——–——————–———-——–——-