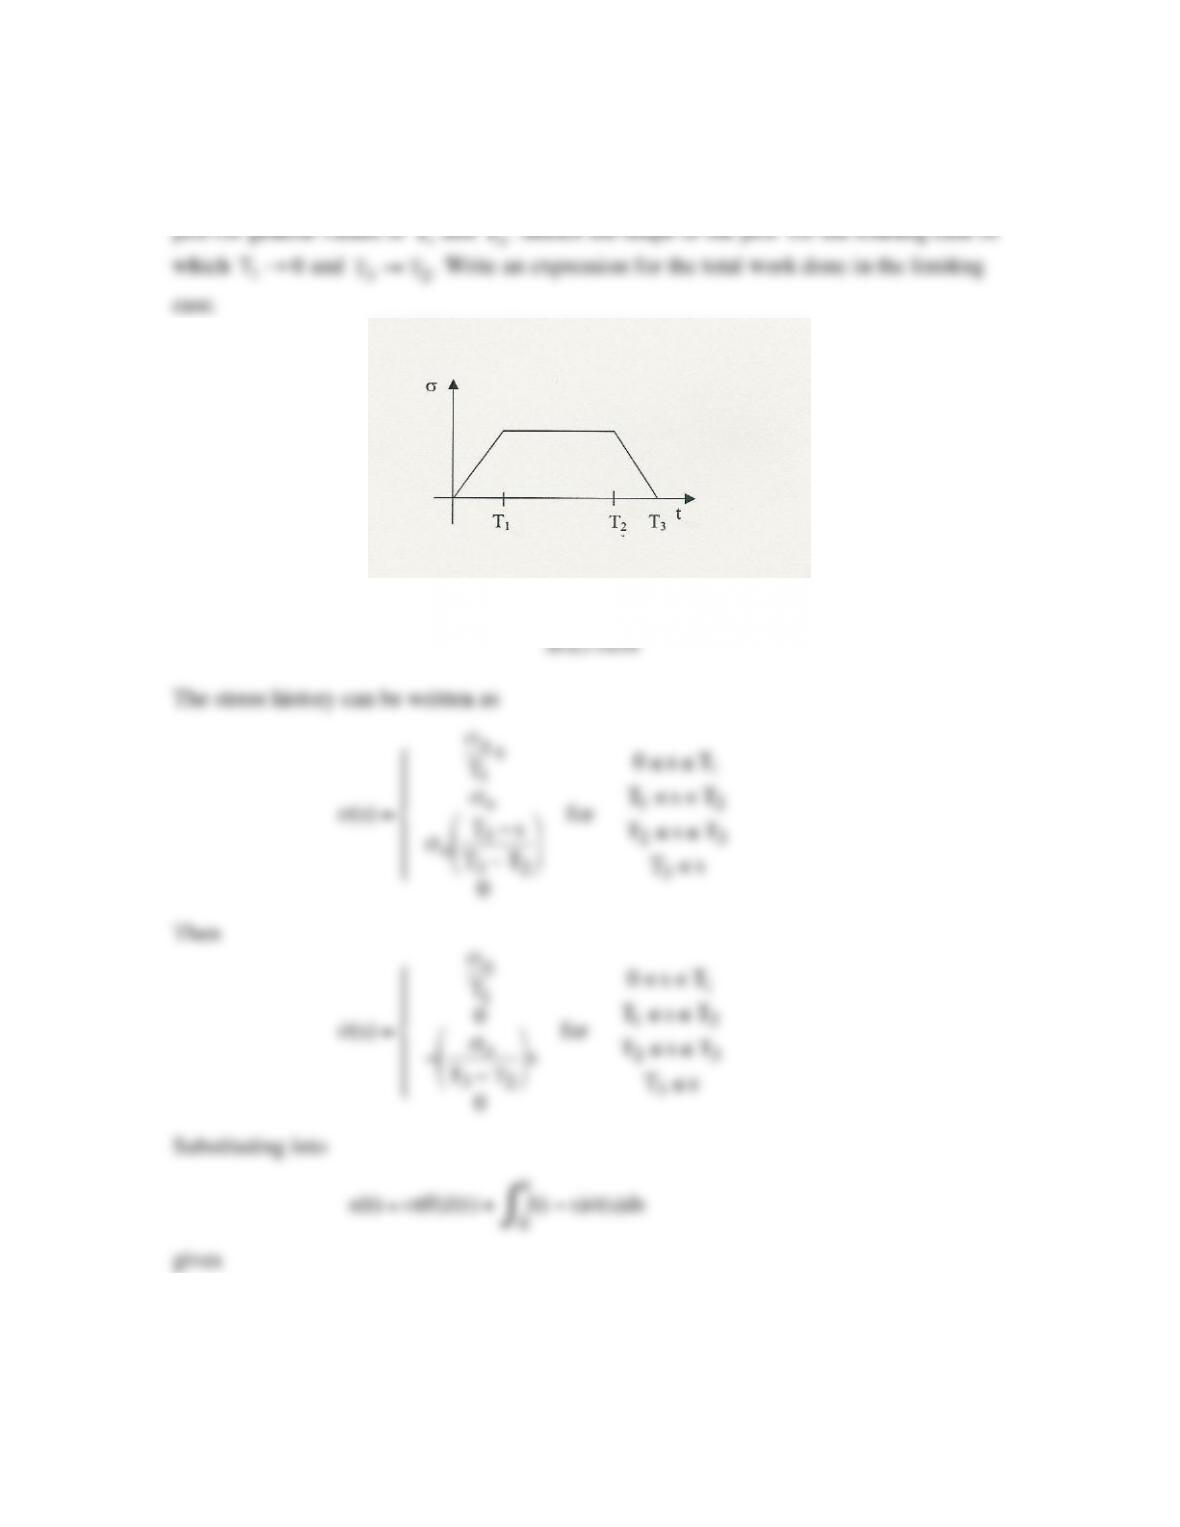
5.11 Consider the stress history shown in Figure-Problem 5.11. Sketch the
!
“ # $
plot for general values of
!
T
1
and
!
T3
. Sketch the shape of the plot for the limiting case in
which
!
T
1“0
and
!
T3“T2
. Write an expression for the total work done in the limiting
case.
Figure-Problem 5.11
SOLUTION
!
gives
!
“(t) =
#
$
%
%
&
%
!
“o
T
1
J(t #s)ds
0
t
$0%t%T
1
“o
T
1
J(t #s)ds
0
T1
$T
1%t%T2
“o
T
1
J(t #s)ds
0
T1
$#“o
T3#T2
( )
J(t #s)ds
T2
t
$T2%t%T3
“o
T
1
J(t #s)ds
0
T1
$#“o
T3#T2
( )
J(t #s)ds
T2
T3
$T3%t
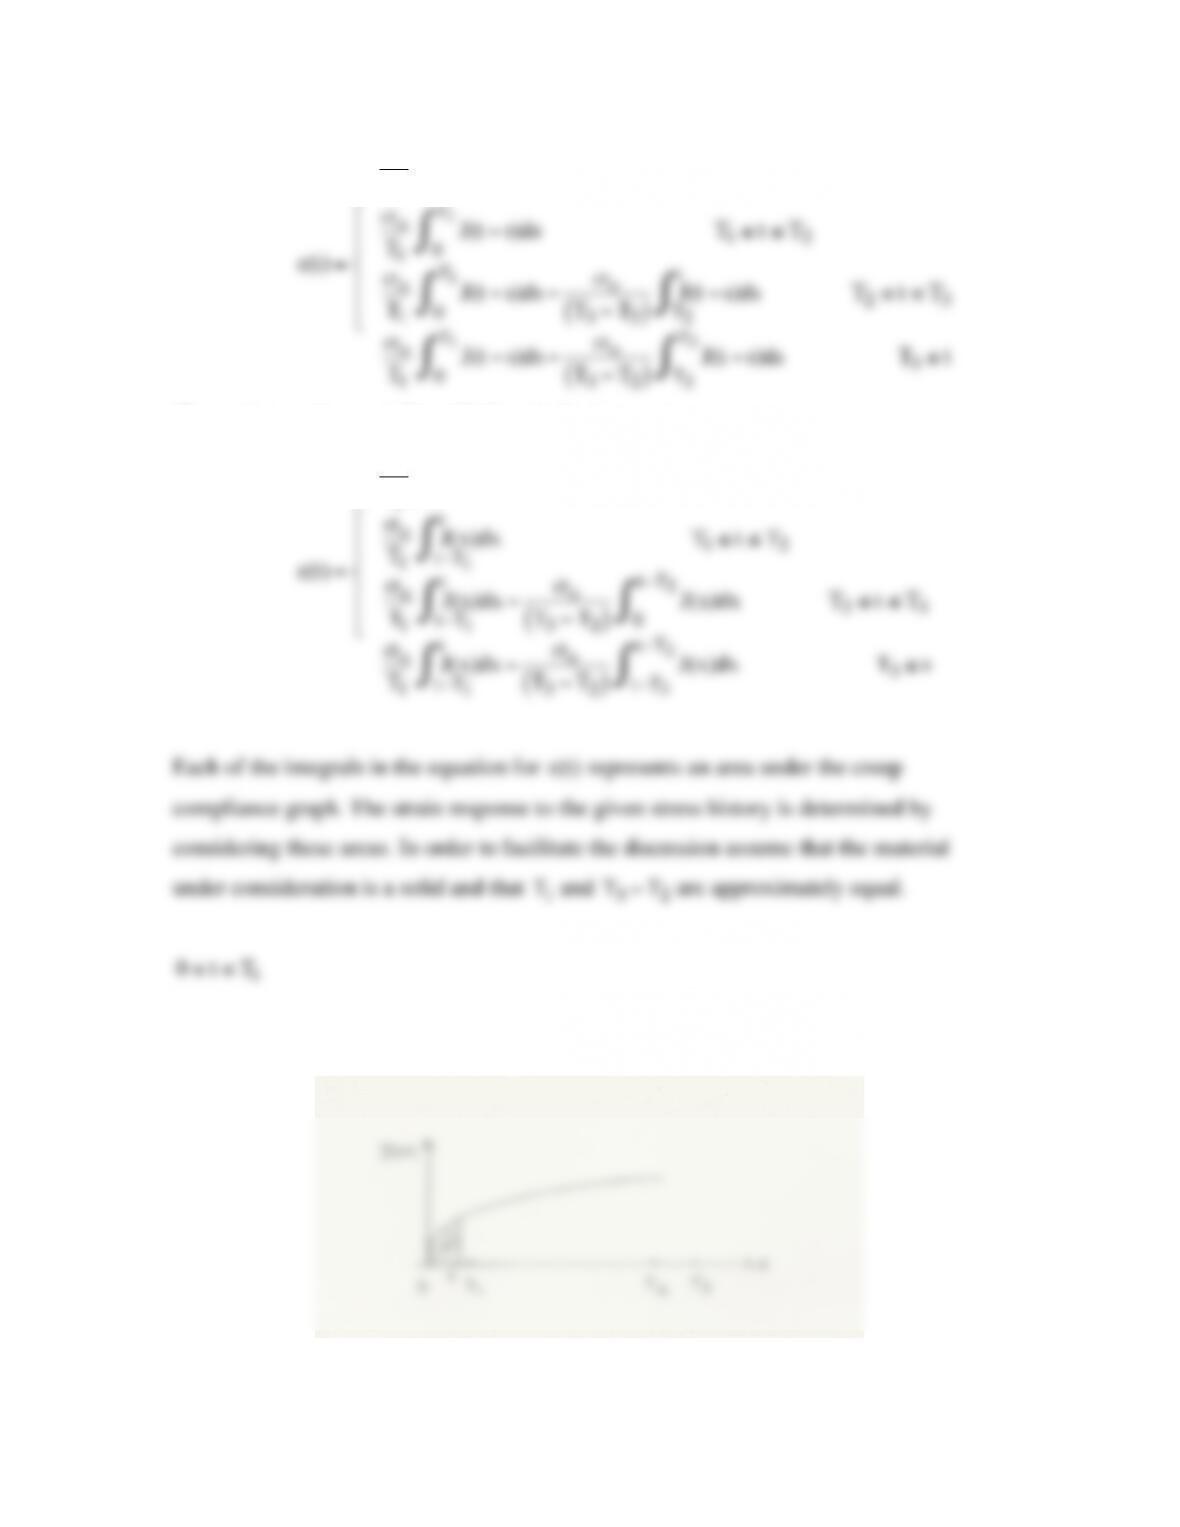
Change integration variable with the substitution
!
x=t“s
“(t) =
#
$
%
%
“o
T
1
J(x)dx
0
t
#0$t$T
1
“o
T
1
J(x)dx
t%T1
t
#T
1$t$T2
“o
t
t%T2
This part of the strain history has the form shown in Problem 5.9 and is indicated on the
total strain history graph at the end of the problem.
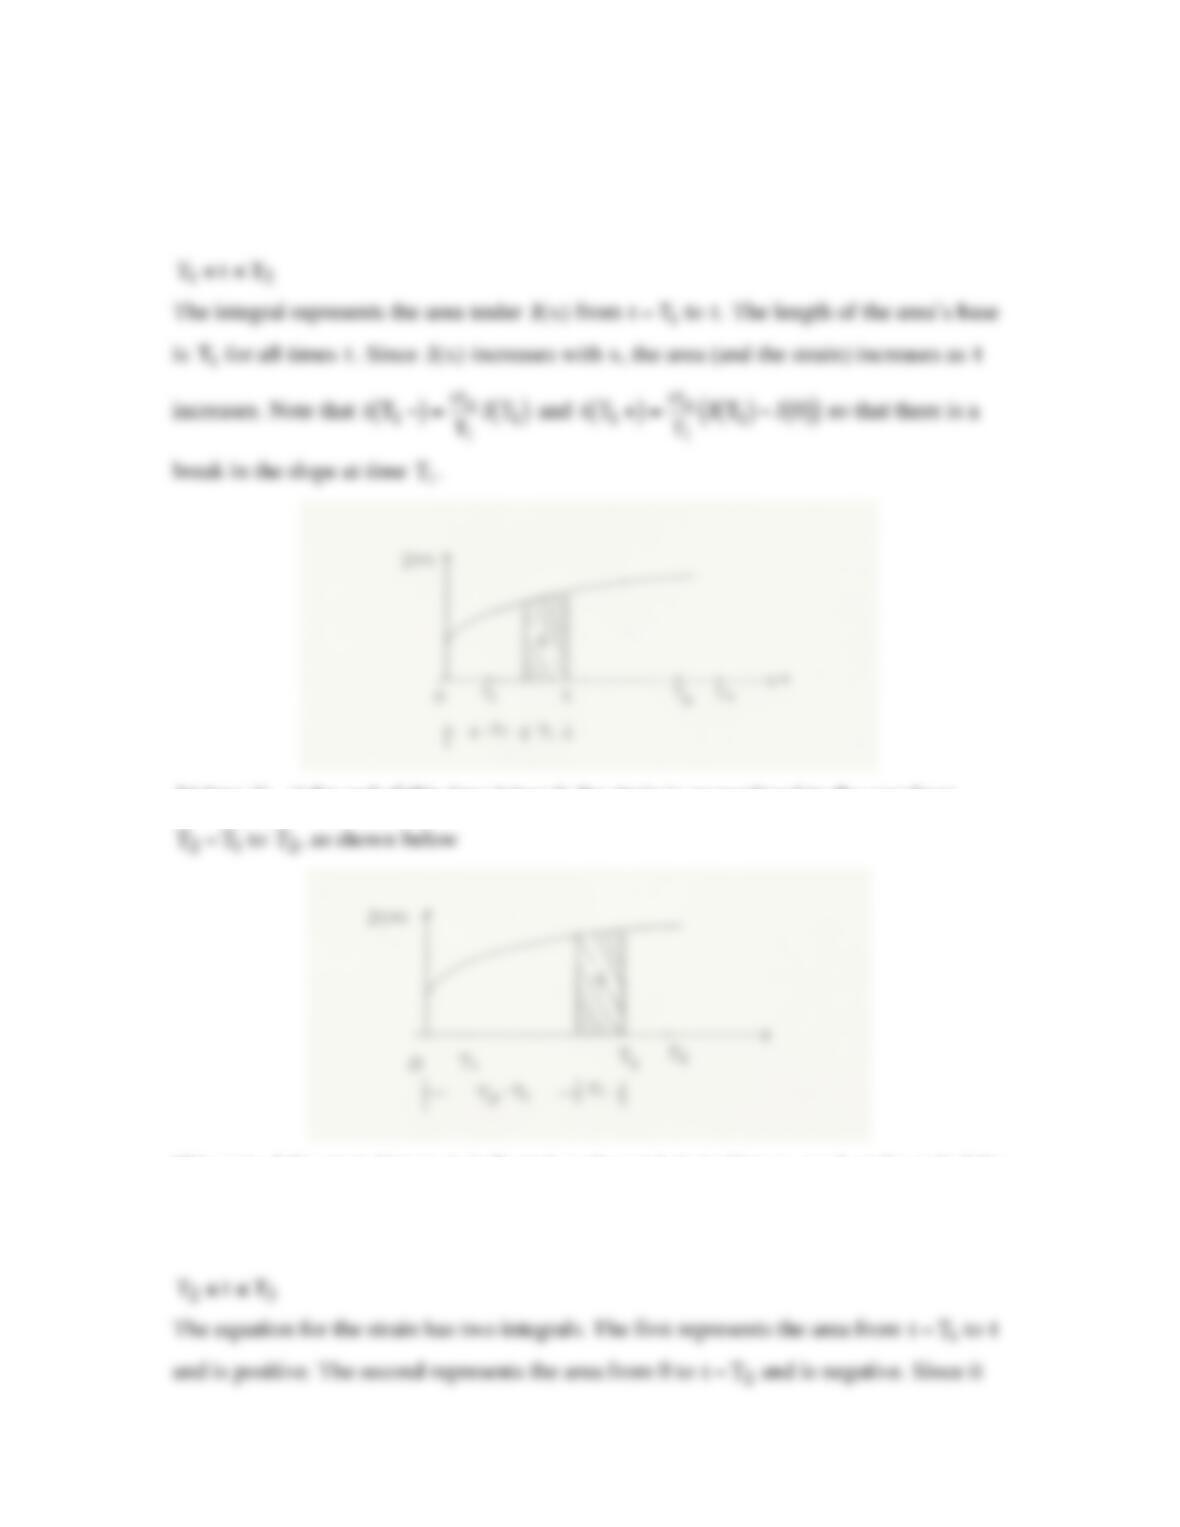
!
T
1“t“T2
The integral represents the area under
!
J(x)
from
!
t“T
1
to
!
t
. The length of the area’s base
is
!
T
1
for all times
!
t
. Since
!
J(x)
increases with x, the area (and the strain) increases as
!
t
increases. Note that
!
˙
“ T
1#
( )
=$o
T
1
J T
1
( )
and
!
˙
“ T
1+
( )
=#o
T
1
J T
1
( )
$J 0
( )
( )
so that there is a
break in the slope at time
!
T
1
.
At time
!
T2
, at the end of this time interval, the strain is proportional to the area from
!
T2“T
1
to
!
T2
, as shown below
This part of the strain history is indicated on the total strain history graph at the end of the
problem.
!
T2“t“T3
The equation for the strain has two integrals. The first represents the area from
!
t“T
1
to
!
t
and is positive. The second represents the area from 0 to
!
t“T2
and is negative. Since it
was assumed that
!
T3“T2
is approximately equal to
!
T
1
the strain is approximately
proportional to the difference of these areas. The area for the first integral is indicated
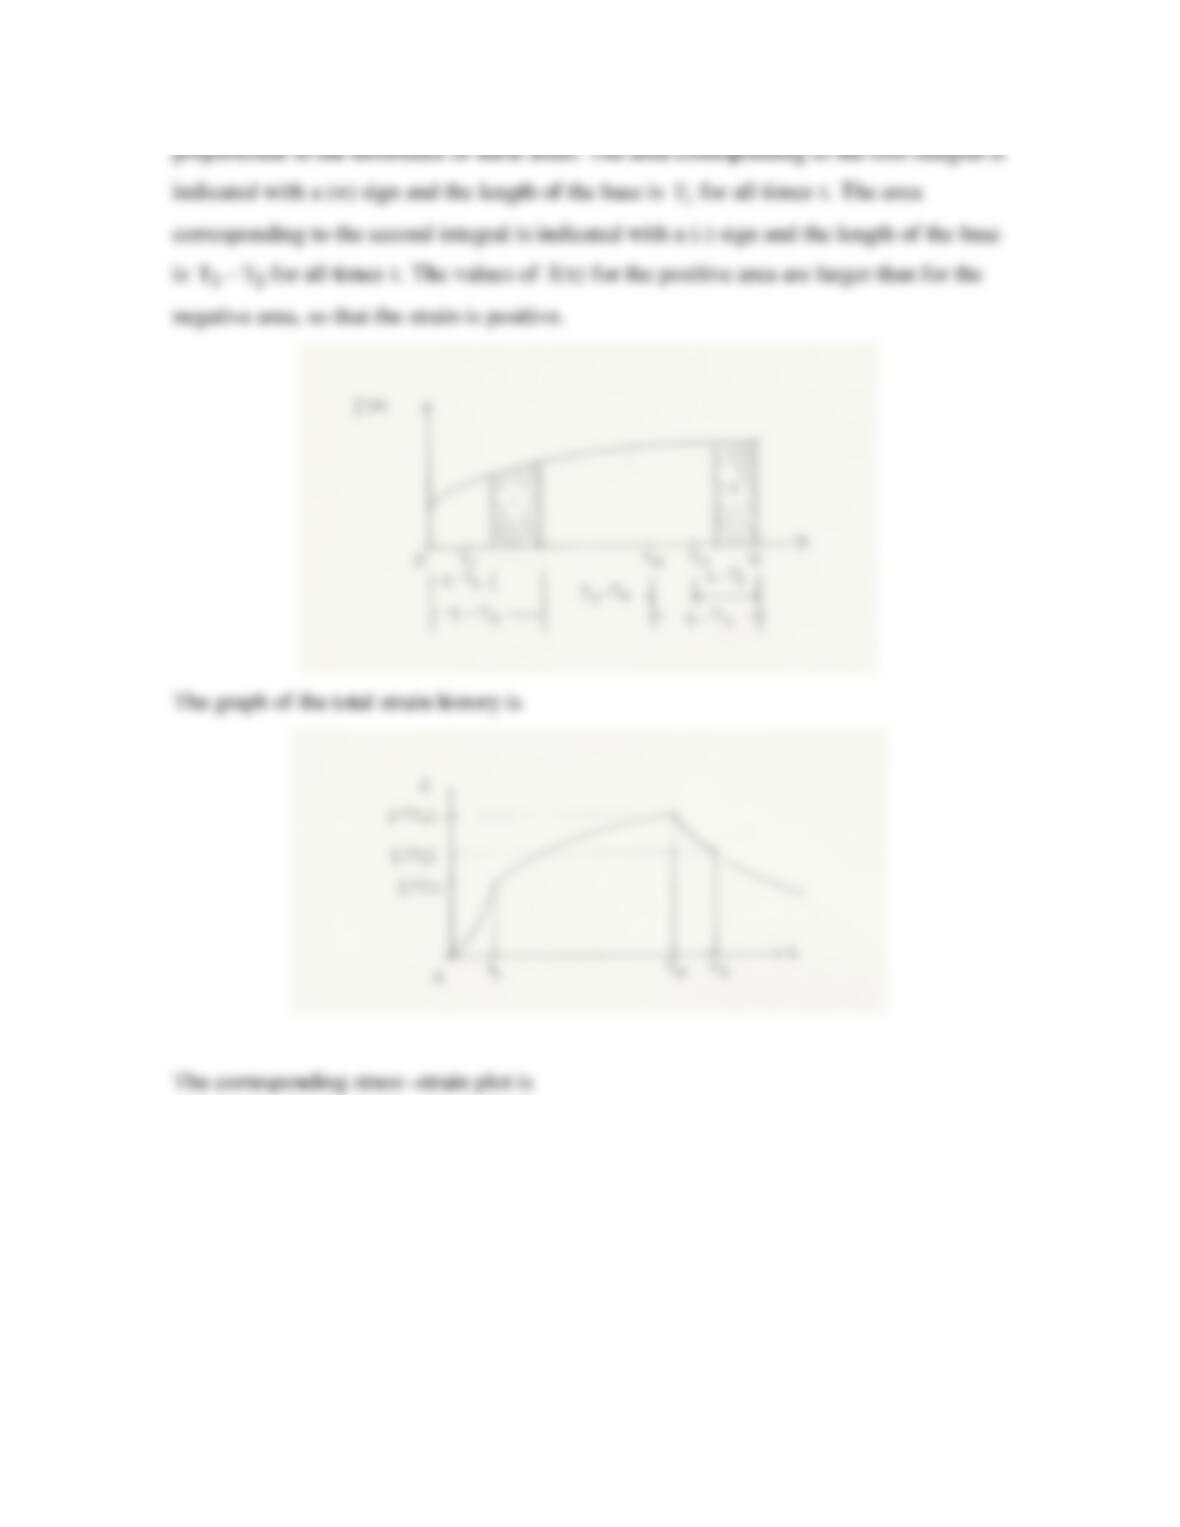
with a plus sign and the area for the second integral is indicated with a minus sign.
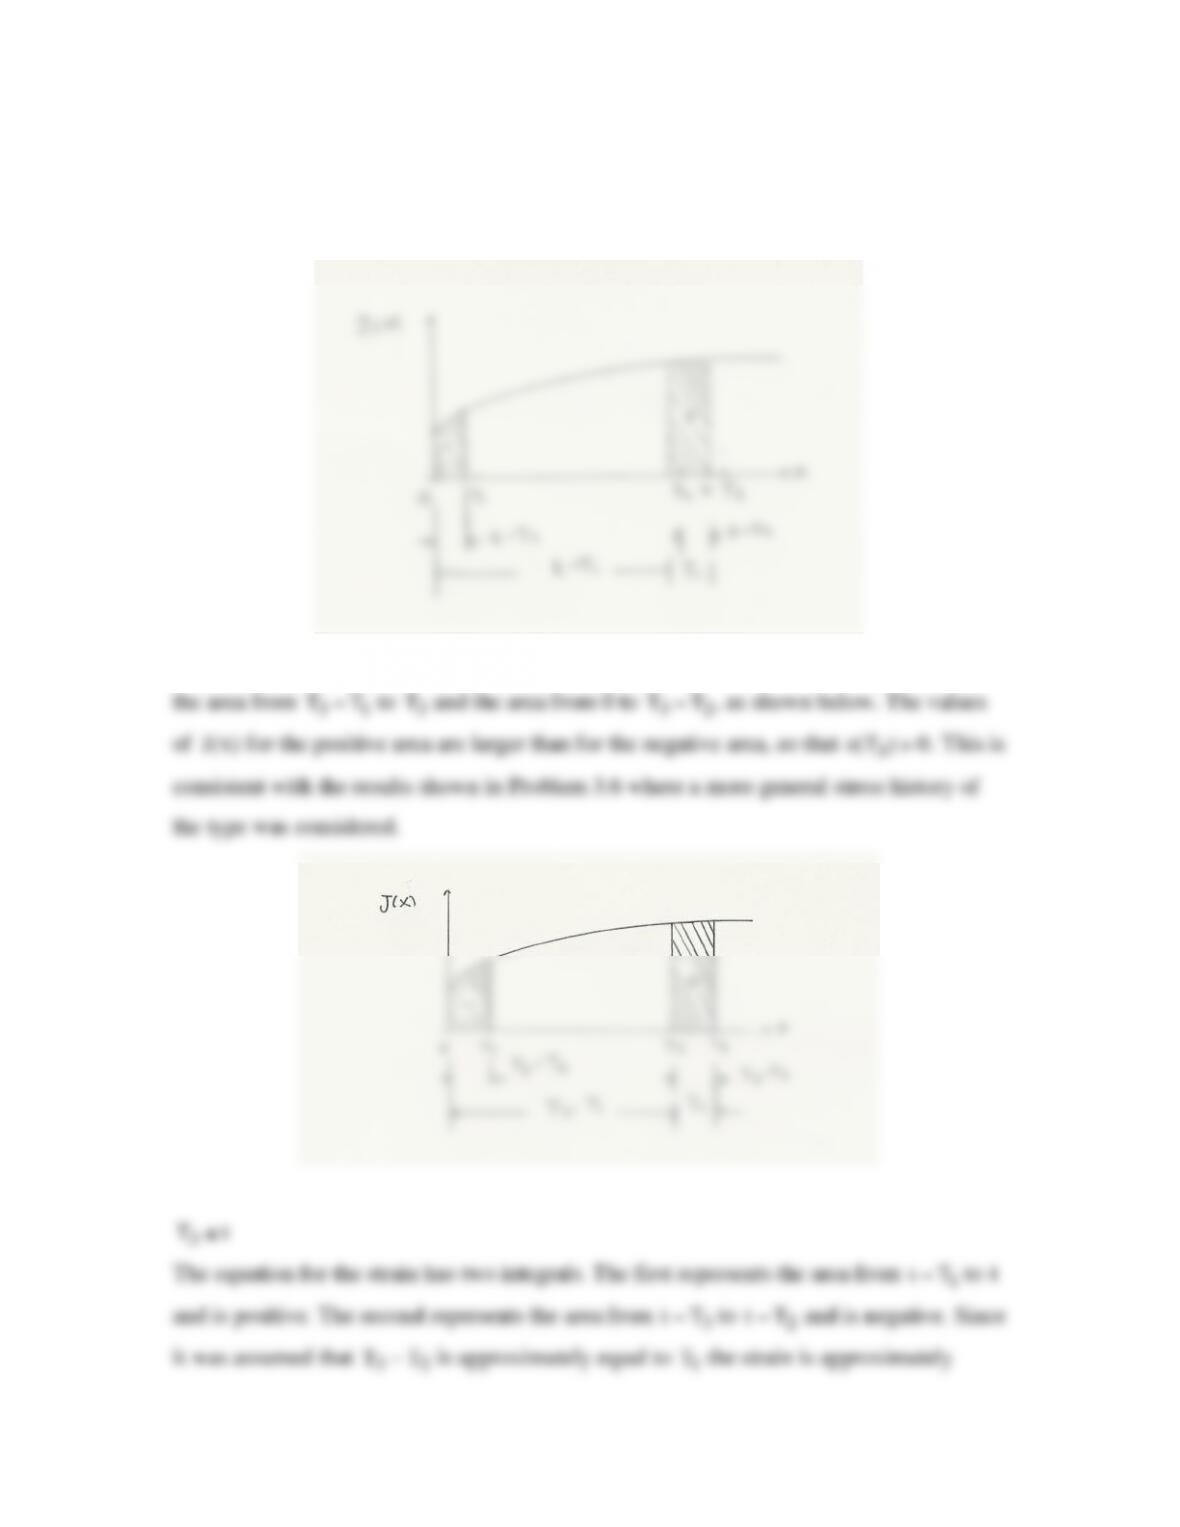
At time
T3
, at the end of this time interval, the strain is proportional to the difference of
the area from
T3“T
1
to
T3
and the area from 0 to
T3“T2
, as shown below. The values
!
!
!
!
proportional to the difference of these areas. The area corresponding to the first integral is
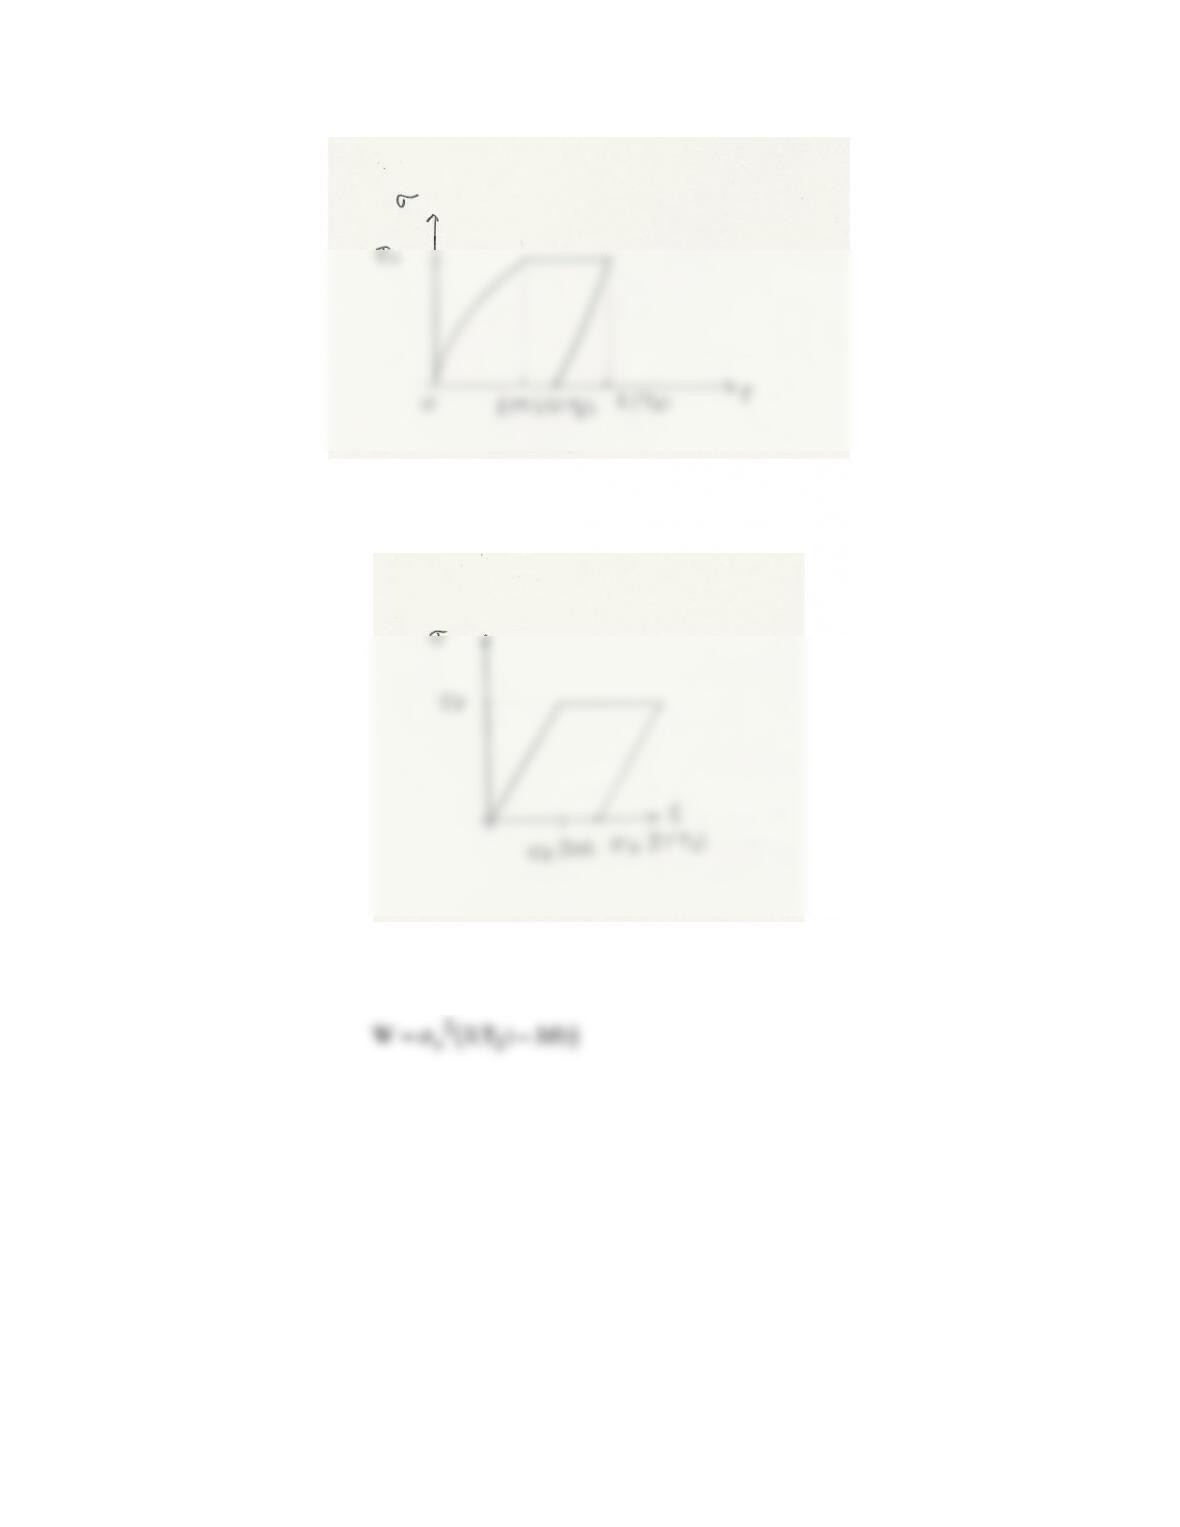
As
!
T
1“0
and
!
T3“T2
, the strain approaches rapid elastic response in the rising and
falling parts of the plot. The limiting plot is a parallelogram
The work done during this strain history is the area the parallelogram
!
W=“o2J(T2)#J(0)
( )