4 1
12–41.
SOLUTION
Thus
Thus,
10 h=160 –4h
t1=0.4 t2
+cv2=v1+act1
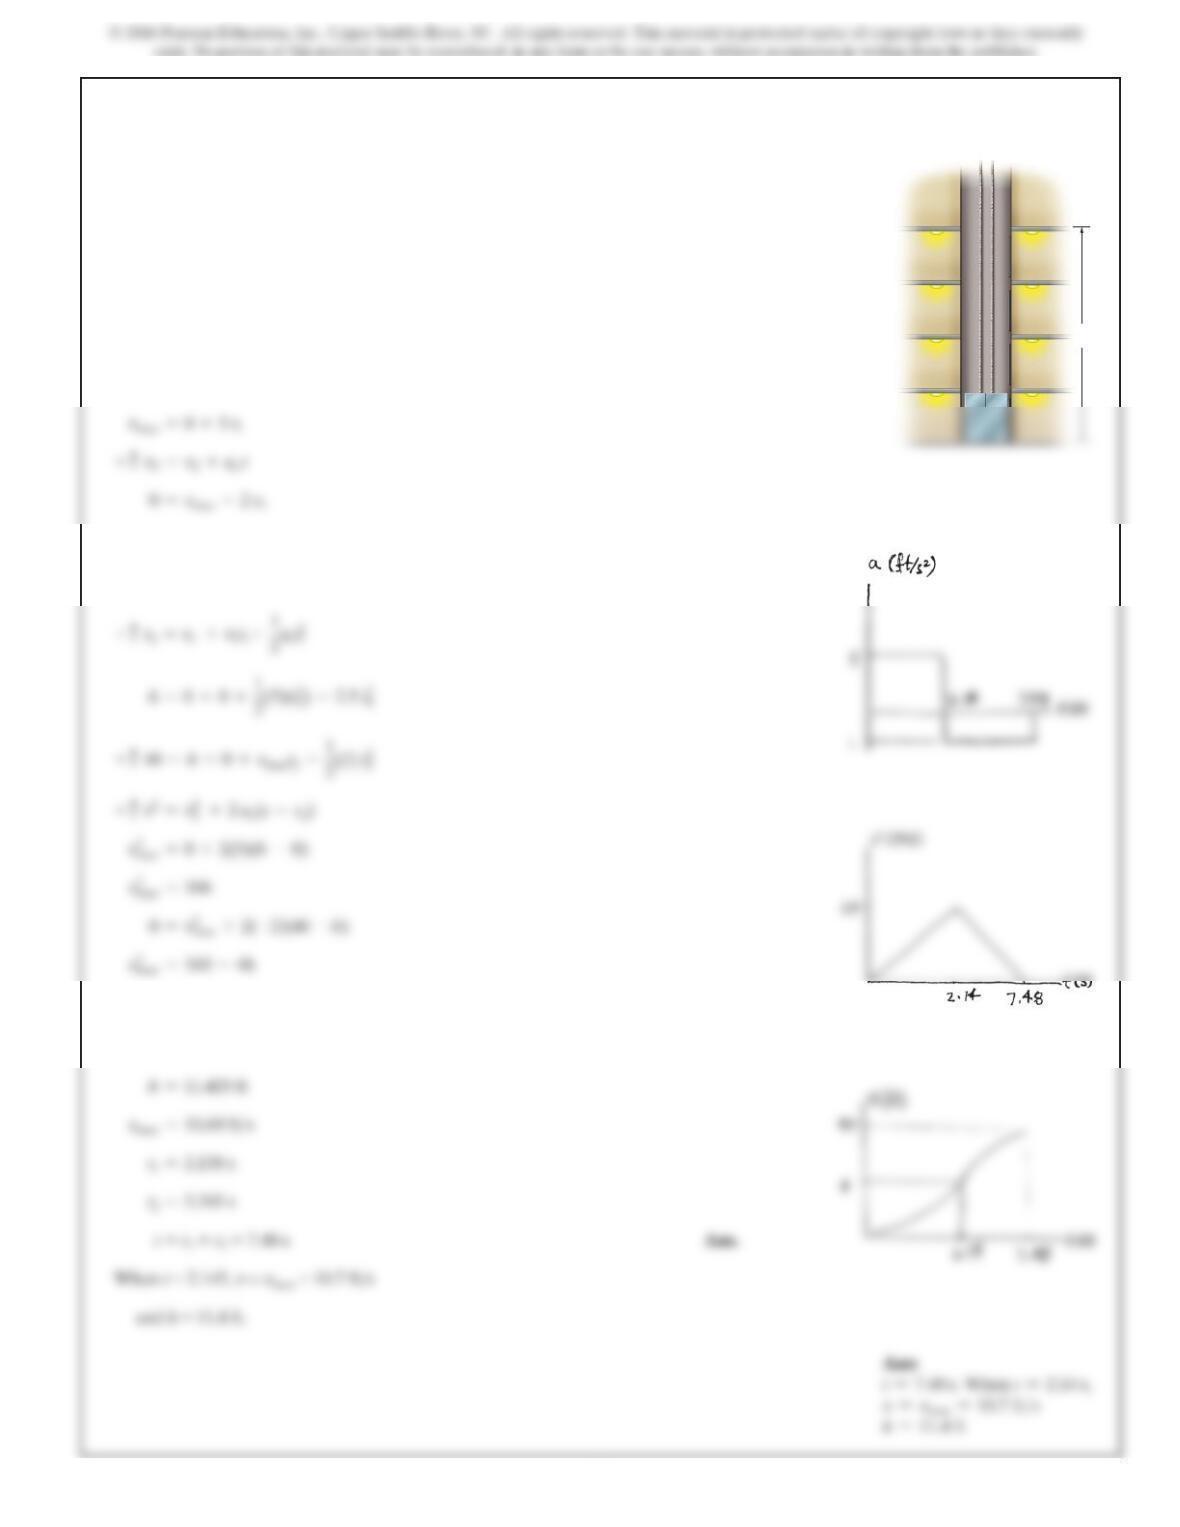
The elevator starts from rest at the first floor of the
building. It can accelerate at and then decelerate at
Determine the shortest time it takes to reach a floor
40 ft above the ground. The elevator starts from rest and
then stops. Draw the a–t,v–t, and s–tgraphs for the motion.
2ft>s2.
5ft>s2
40 ft
4 2
12–42.
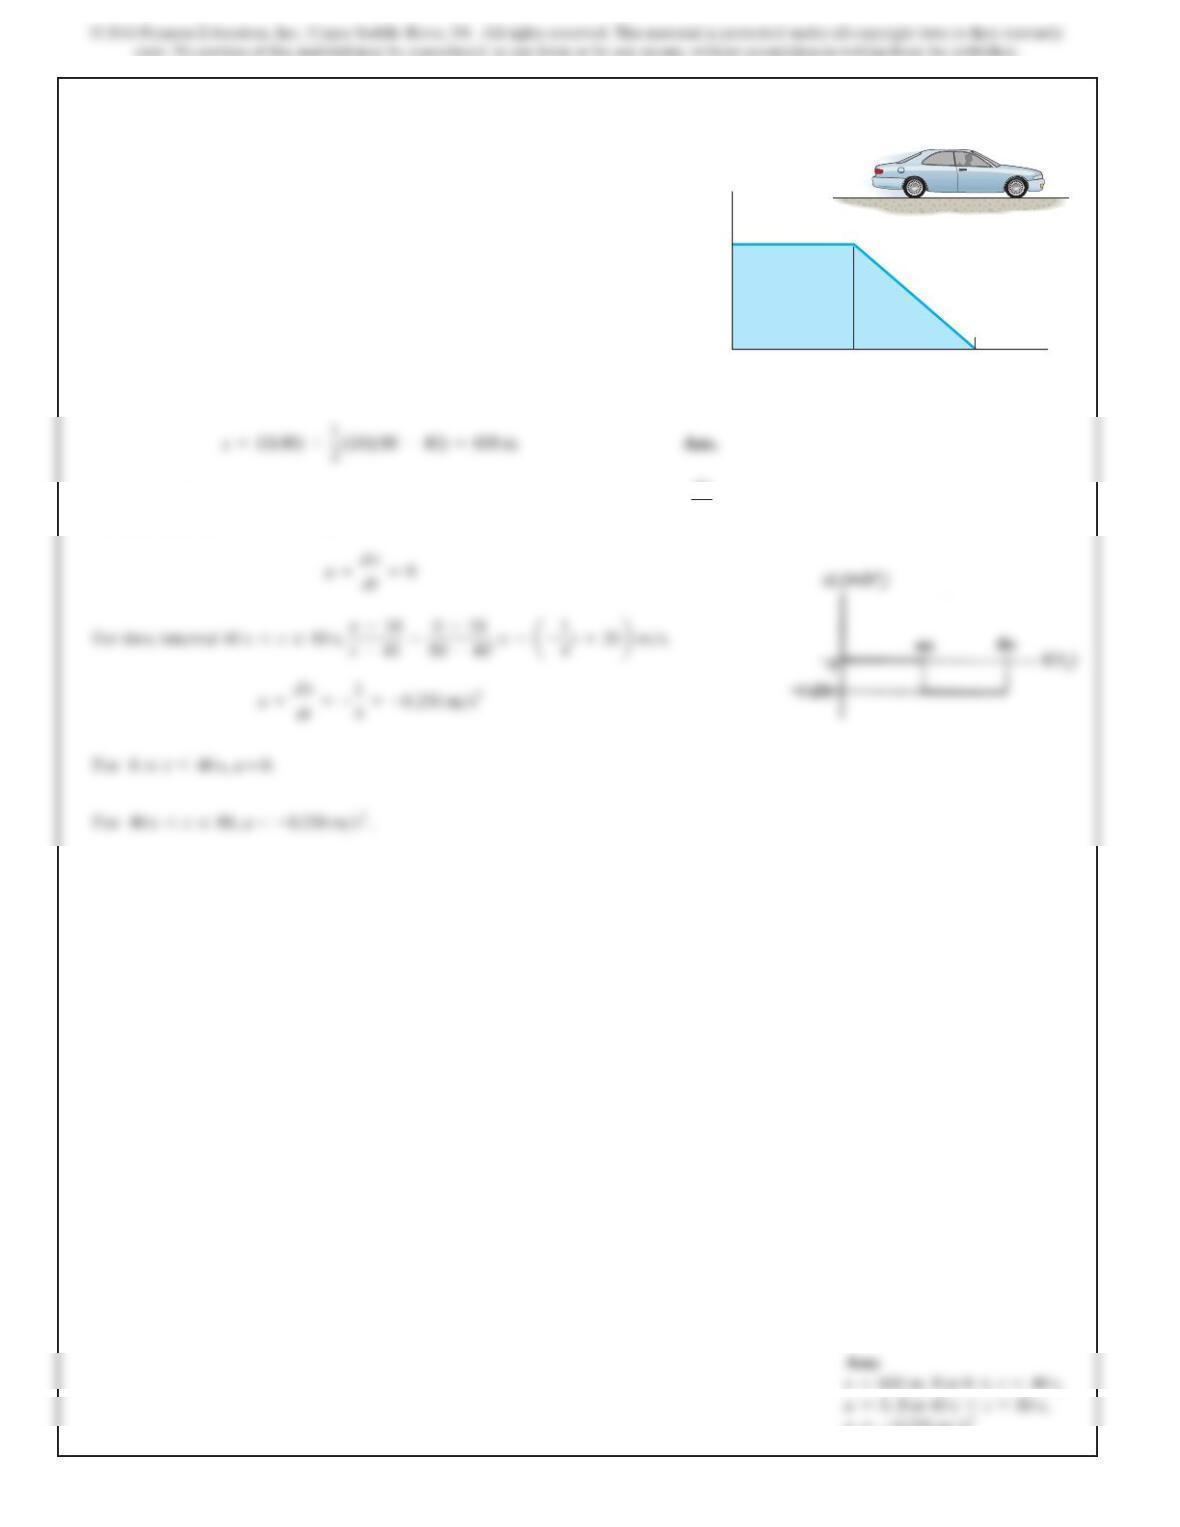
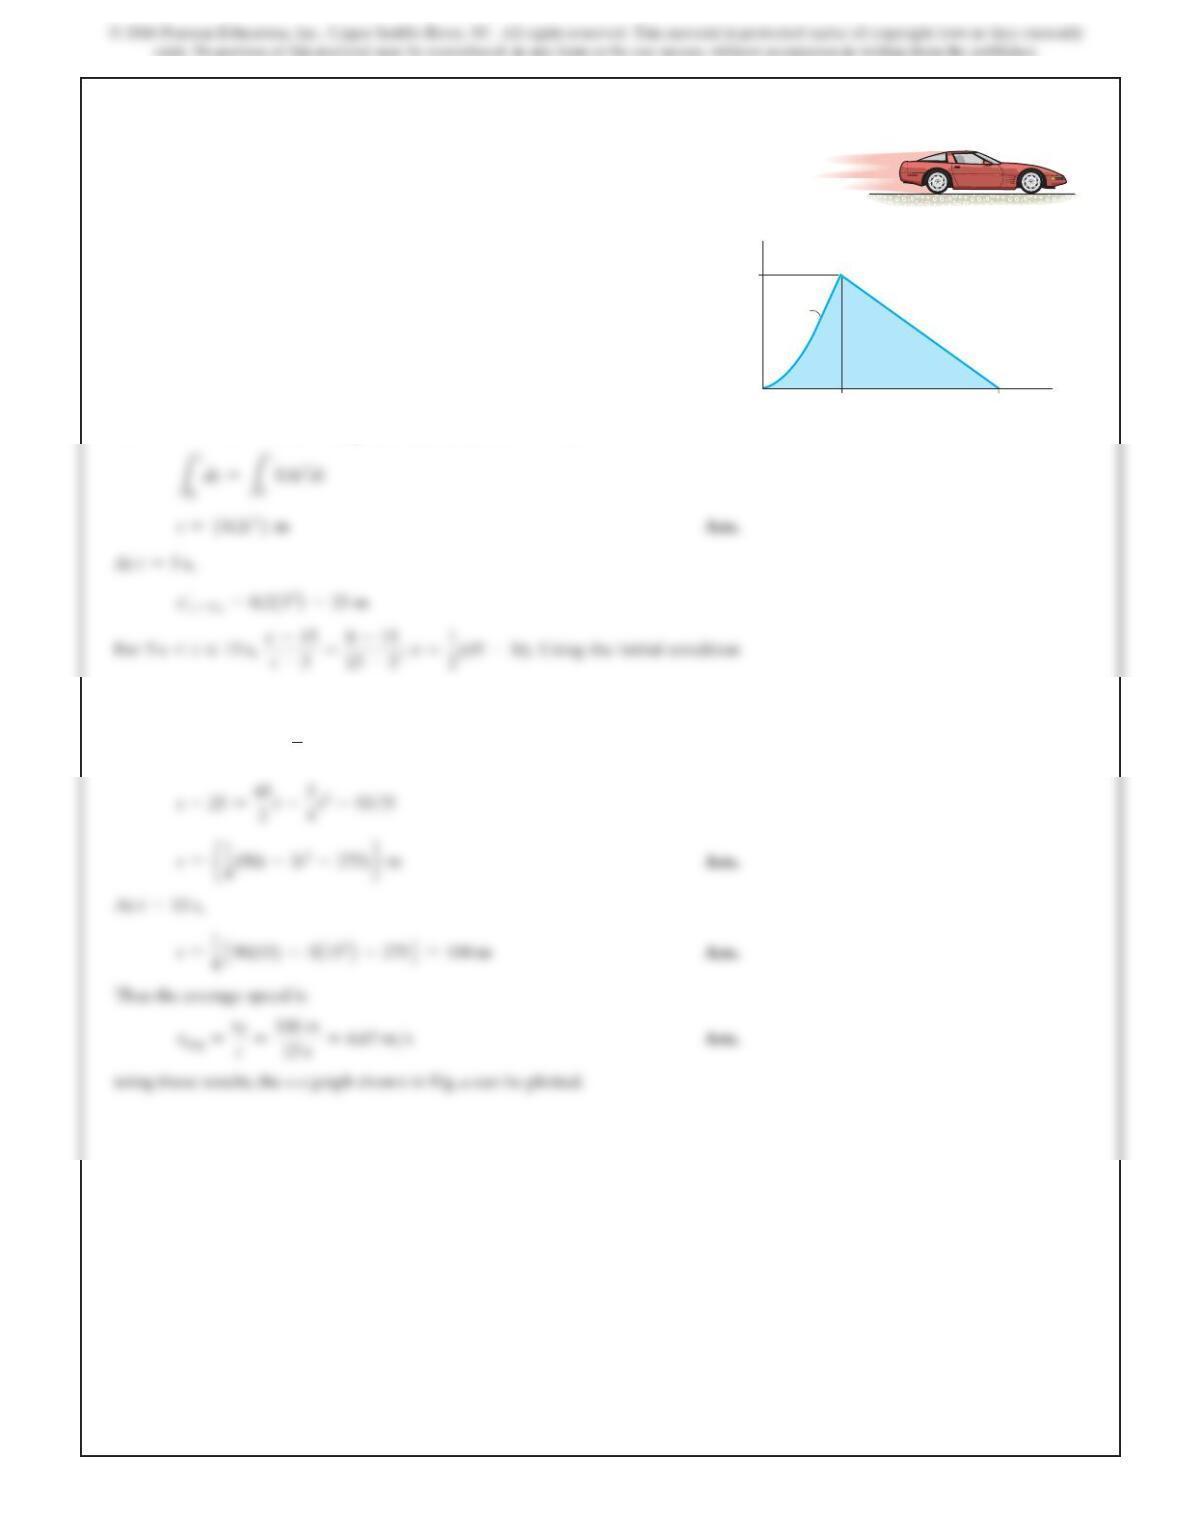
The velocity of a car is plotted as shown. Determine the
total distance the car moves until it stops
Construct the a–t graph. 1t=80 s2.
t(s)
10
40 80
v
(m/s)
SOLUTION
Distance Traveled:The total distance traveled can be obtained by computing the
area under the graph.
a–tGraph:The acceleration in terms of time tcan be obtained by applying .
For time interval ,
0s …t640 s
a=dv
dt
v–t
a
=–
0.250 m
>
s
4 3
SOLUTION
v–t Graph. The v–t function can be determined by integrating
dv=a dt
.
For
0…t610 s,
a=0
. Using the initial condition
v=300 ft>s
at
t=0,
>
t
L
300 ft
>
s
dv=L
t
10 s
(t–30) dt
At
t=20 s,
t=20 s,
L
150 ft
>
s
dv=L
t
20 s
–10 dt
t=t′,
Using these results, the
v9t
graph shown in Fig. a can be plotted s-t Graph.
The
s9t
function can be determined by integrating
ds =v dt
. For
0…t610 s,
the
12–43.
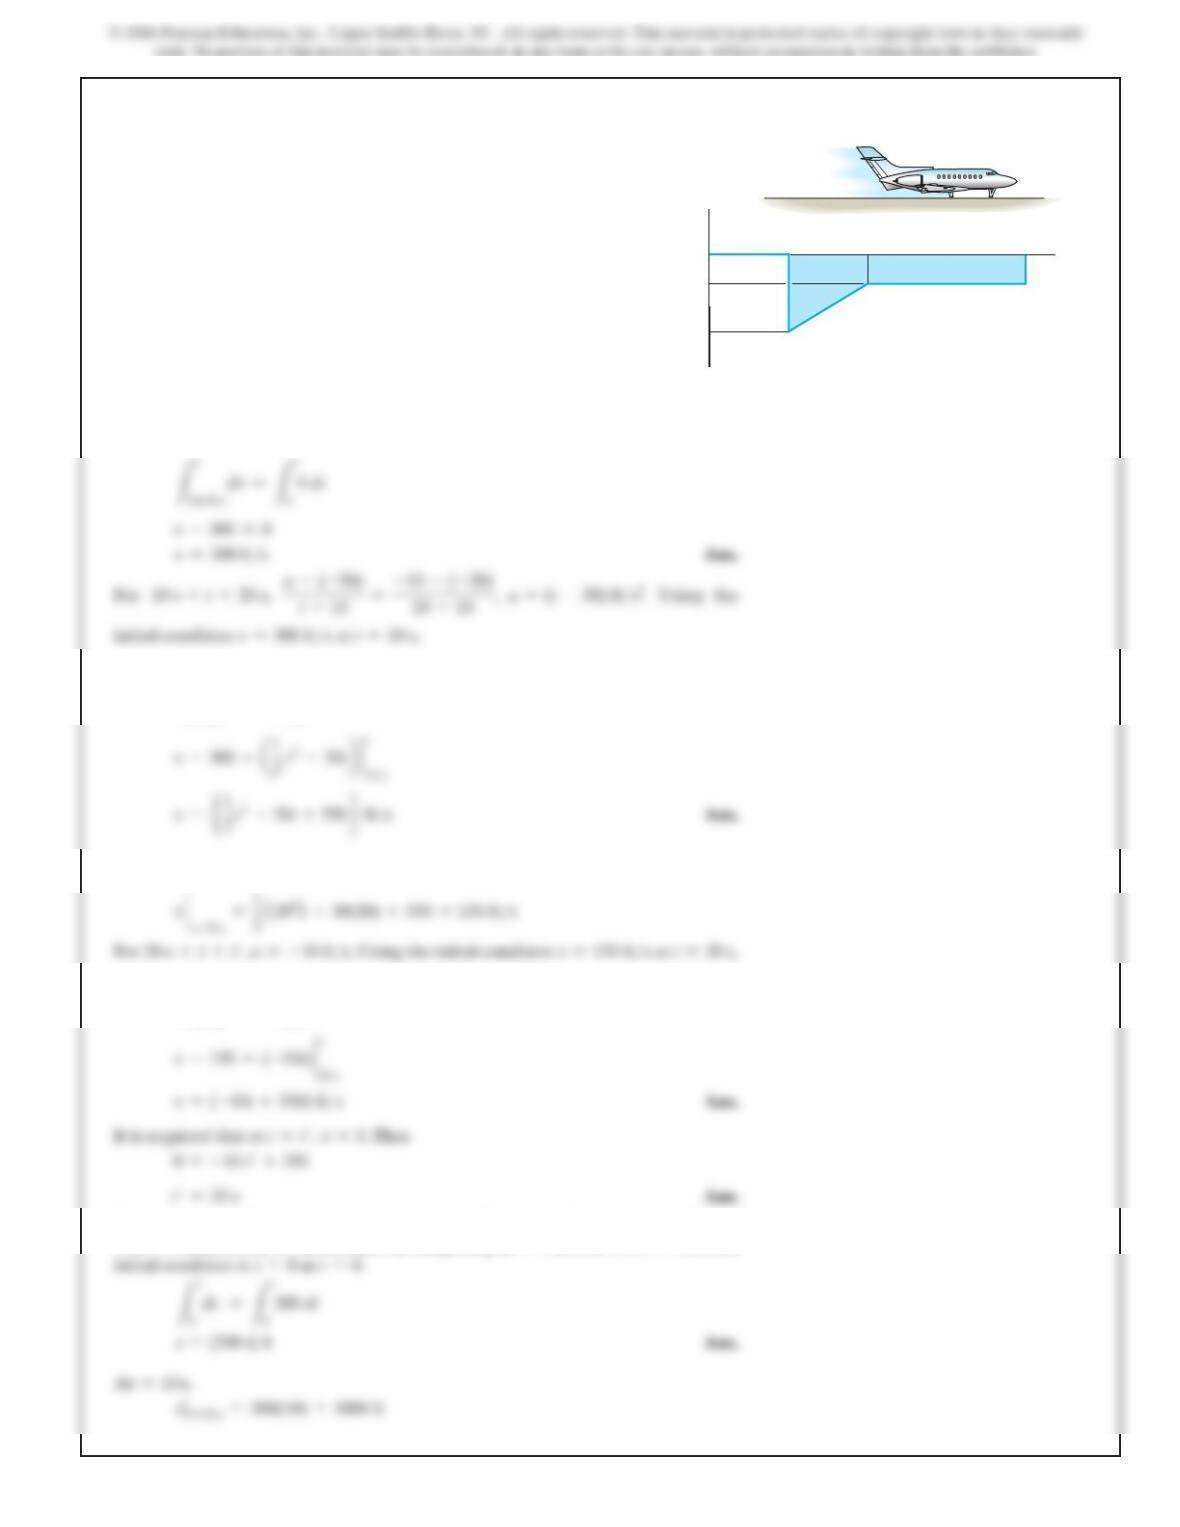
The motion of a jet plane just after landing on a runway
is described by the a–t graph. Determine the time t
′
when
the jet plane stops. Construct the v–t and s–t graphs for the
motion. Here s = 0, and v = 300 ft
>
s when t = 0.
t (s)
10
a (m/s2)
10
20 t¿
20
v
v
4 4
12–43. Continued
For 10 s
6
t
6
20 s, the initial condition is s = 3000 ft at t = 10 s.
Ls
3000 ft
At t=20 s,
For
20 s 6t…35 s,
the initial condition is s
=
5167 ft at t
=
20 s.
Ls
5167 ft
ds =
Lt
20 s
(–10t+350) dt
At t=35 s,
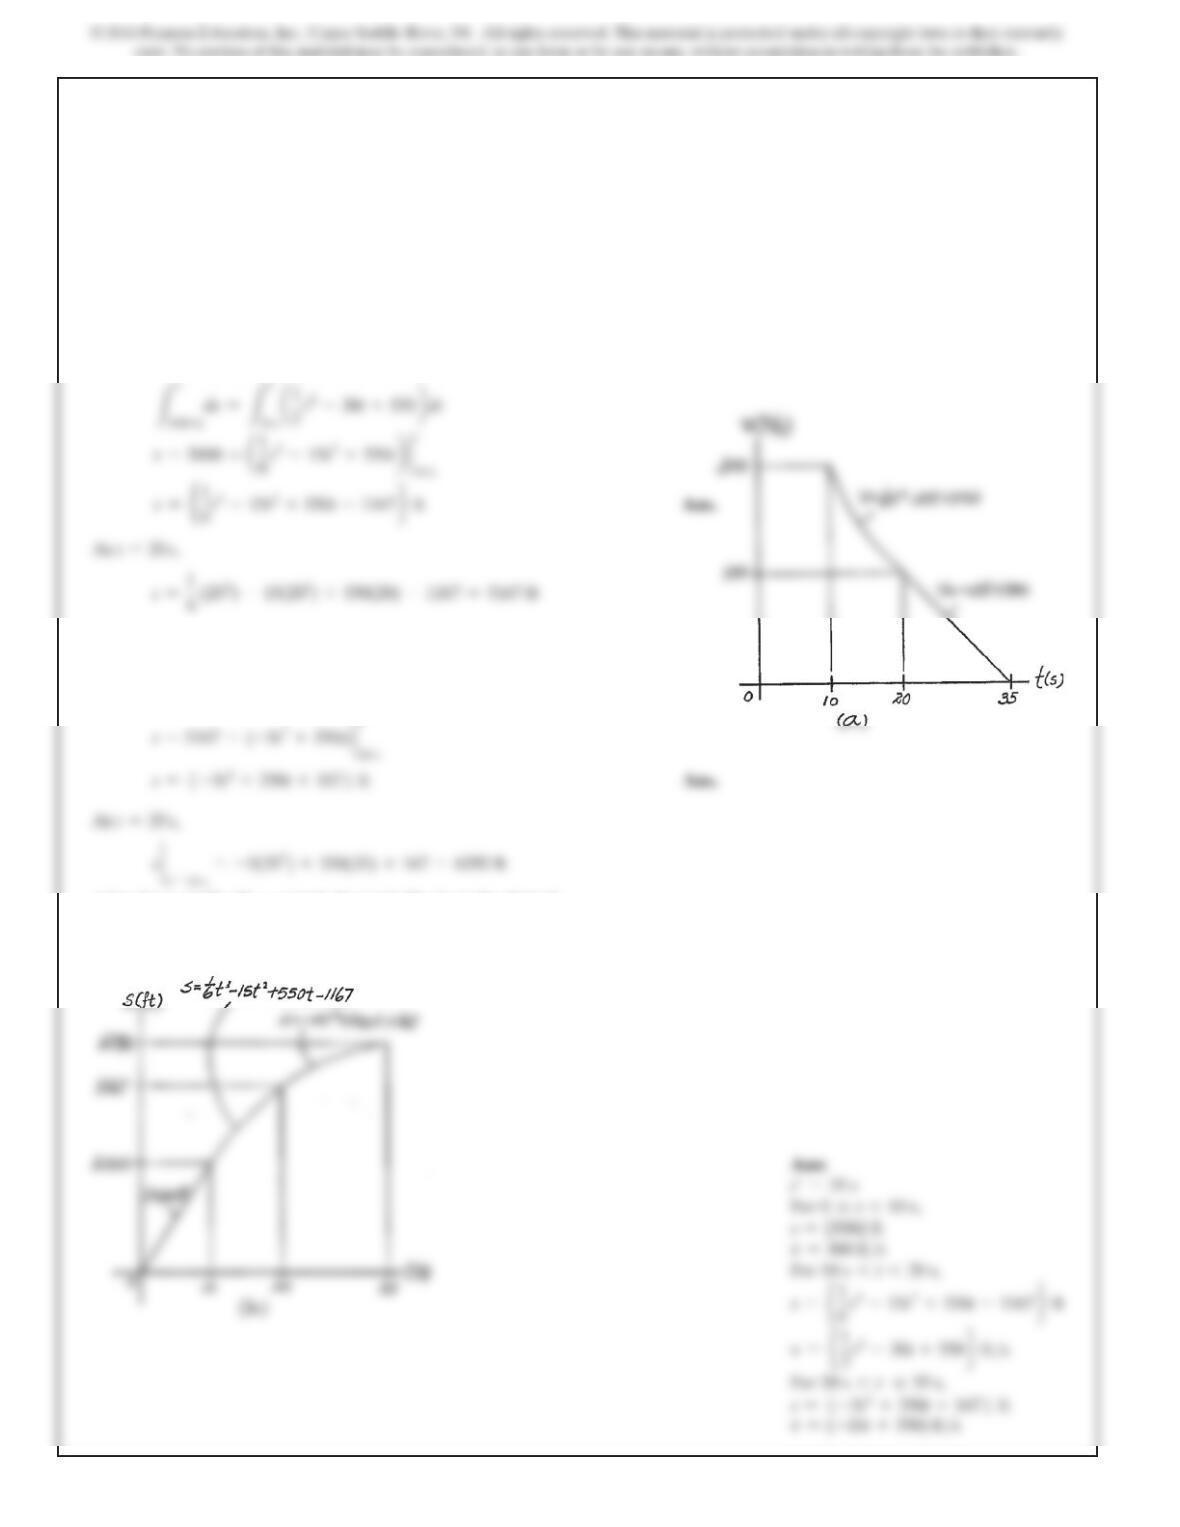
using these results, the s-t graph shown in Fig. b can be plotted.
4 5
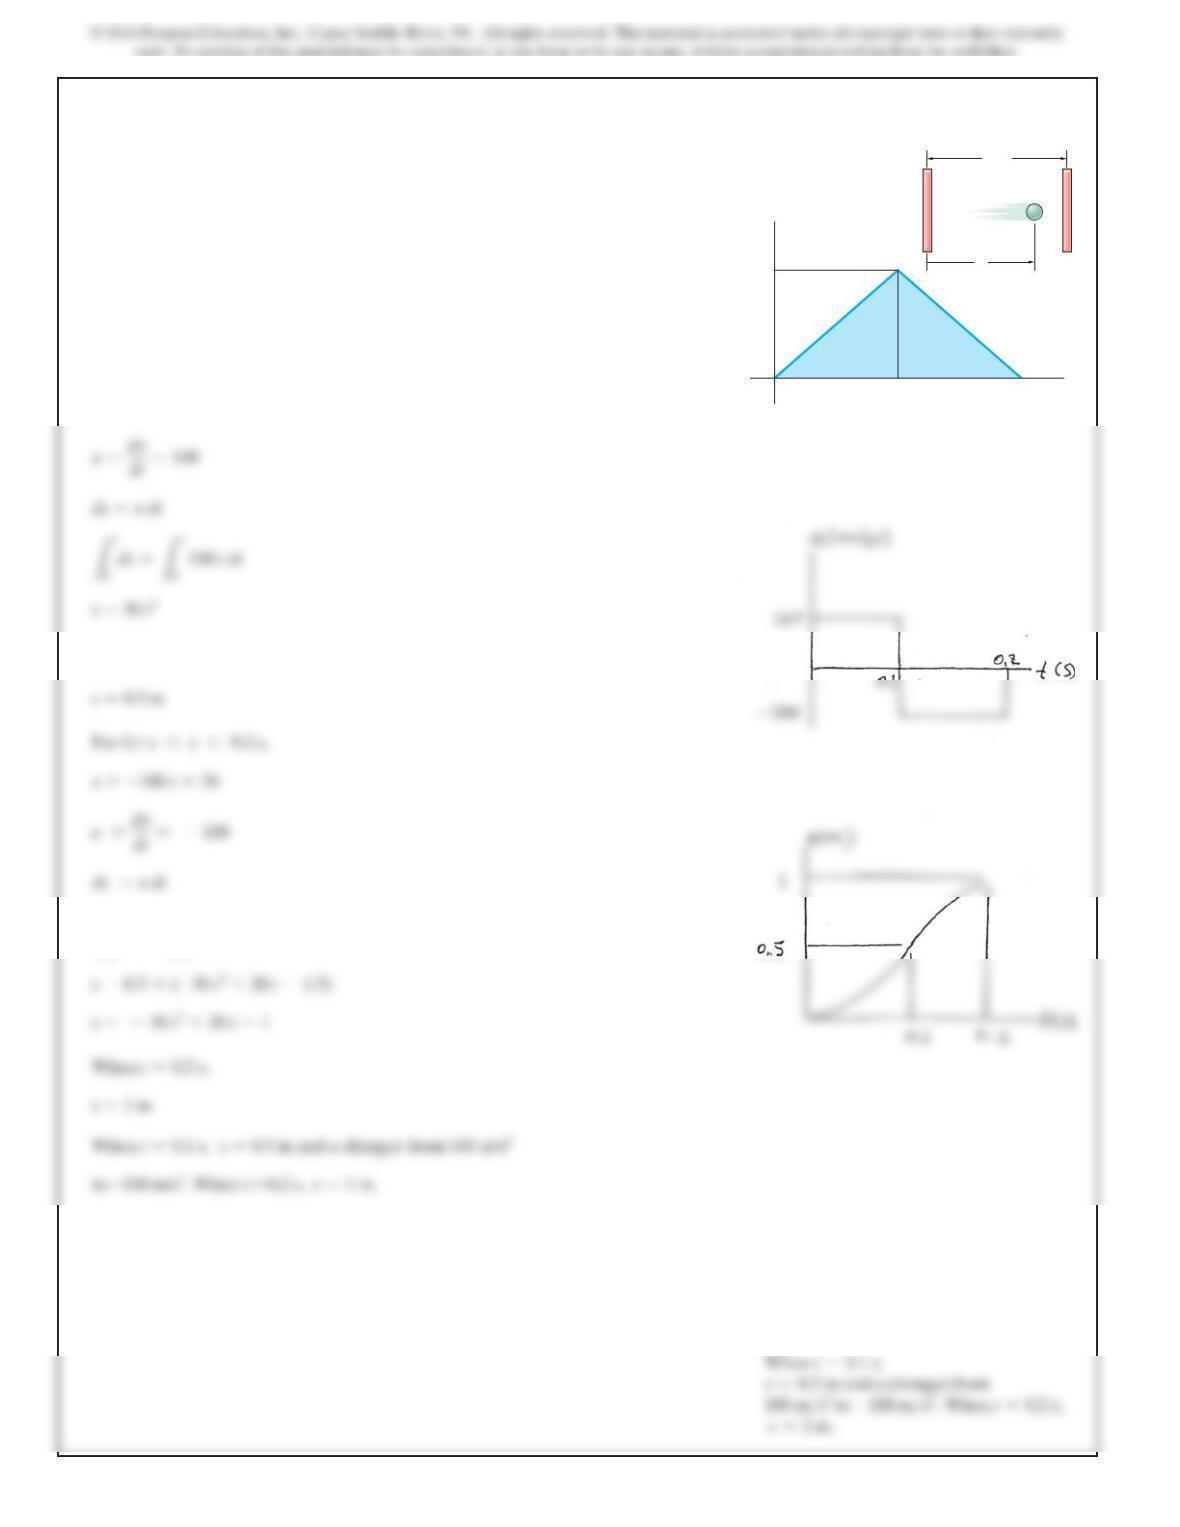
*12–44.
The v–tgraph for a particle moving through an electric field
from one plate to another has the shape shown in the figure.
The acceleration and deceleration that occur are constant
and both have a magnitude of If the plates are
spaced 200 mm apart, determine the maximum velocity
and the time for the particle to travel from one plate to
the other. Also draw the s–tgraph. When the
particle is at s=100 mm.
t=t¿>2
t¿
vmax
4m>s2.
SOLUTION
ac=4 m/s2
t¿/2t¿t
v
s
max
v
max
s
4 6
12–45.
SOLUTION
For ,
When ,
Ls
0.5
ds =Lt
0.11–100t+202dt
t=0.1 s
v=100 t
06t60.1 s
t¿/2t¿t
v
s
max
v
max
s
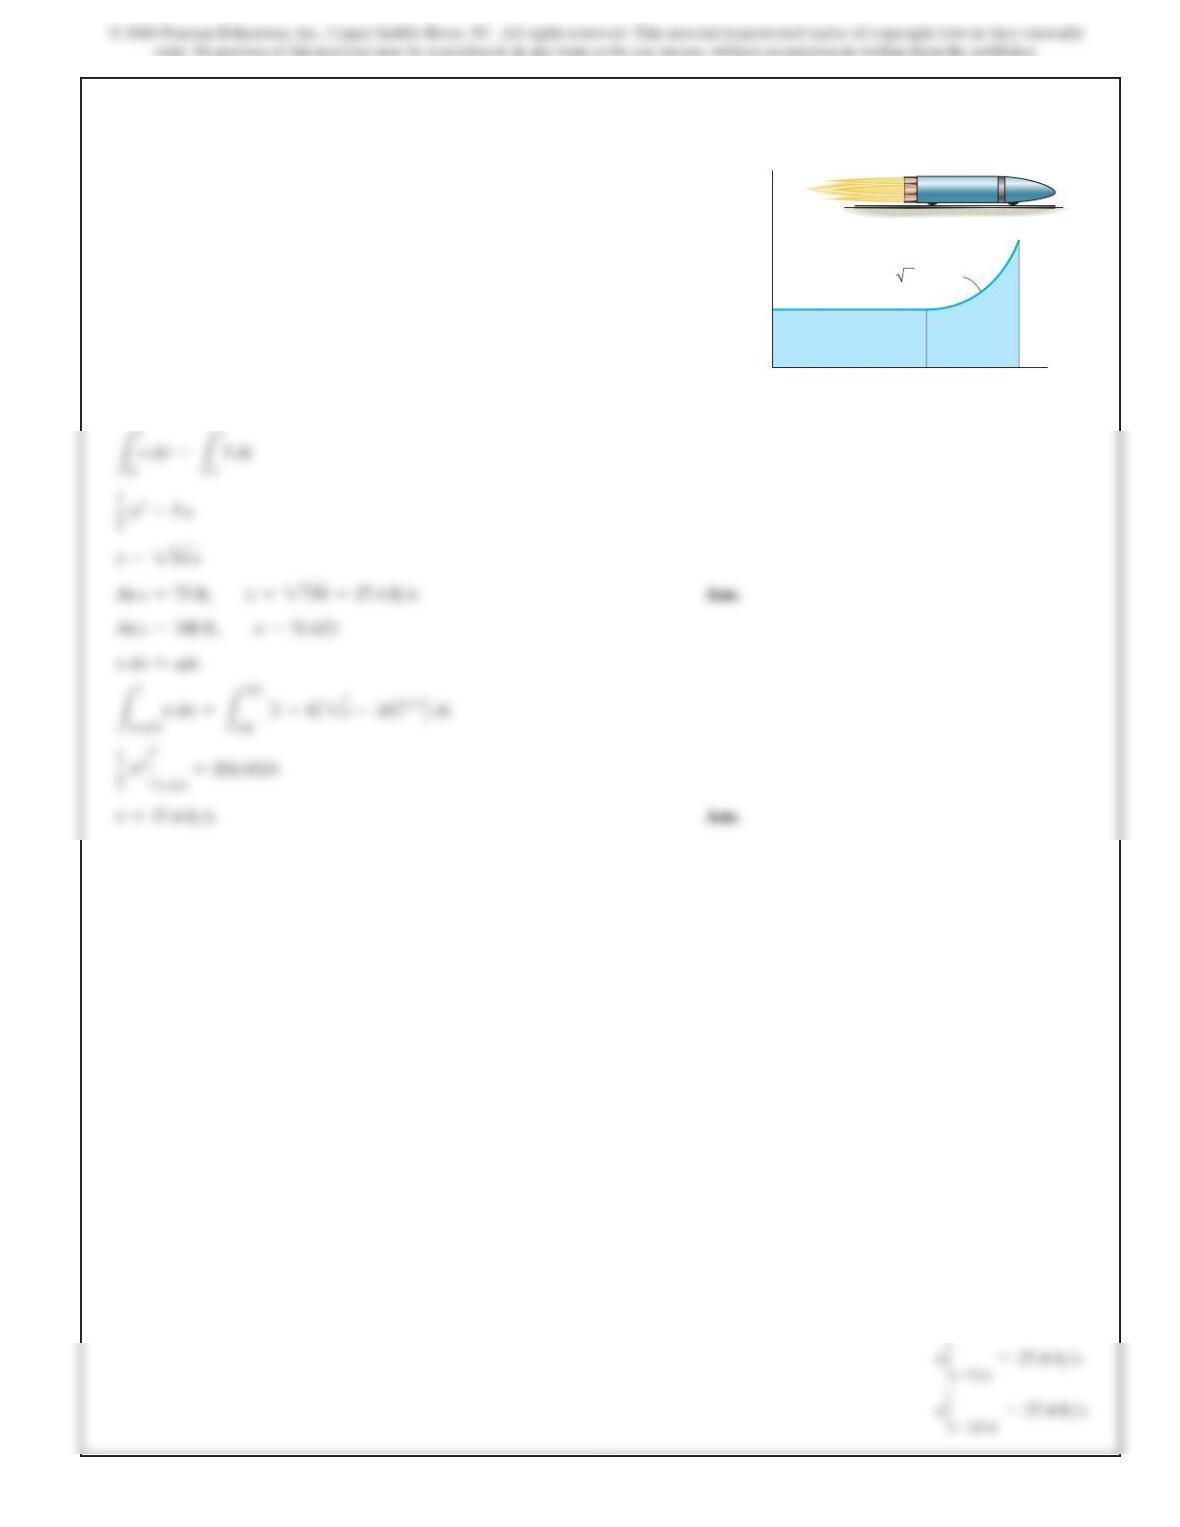
The v–t graph for a particle moving through an electric field
from one plate to another has the shape shown in the figure,
where t¿ = 0.2 s and vmax = 10 m>s. Draw the s–t and a–t graphs
for the particle. When t = t¿>2 the particle is at s = 0.5 m.
Ans:
4 7
SOLUTION
0…s6100
12–46.
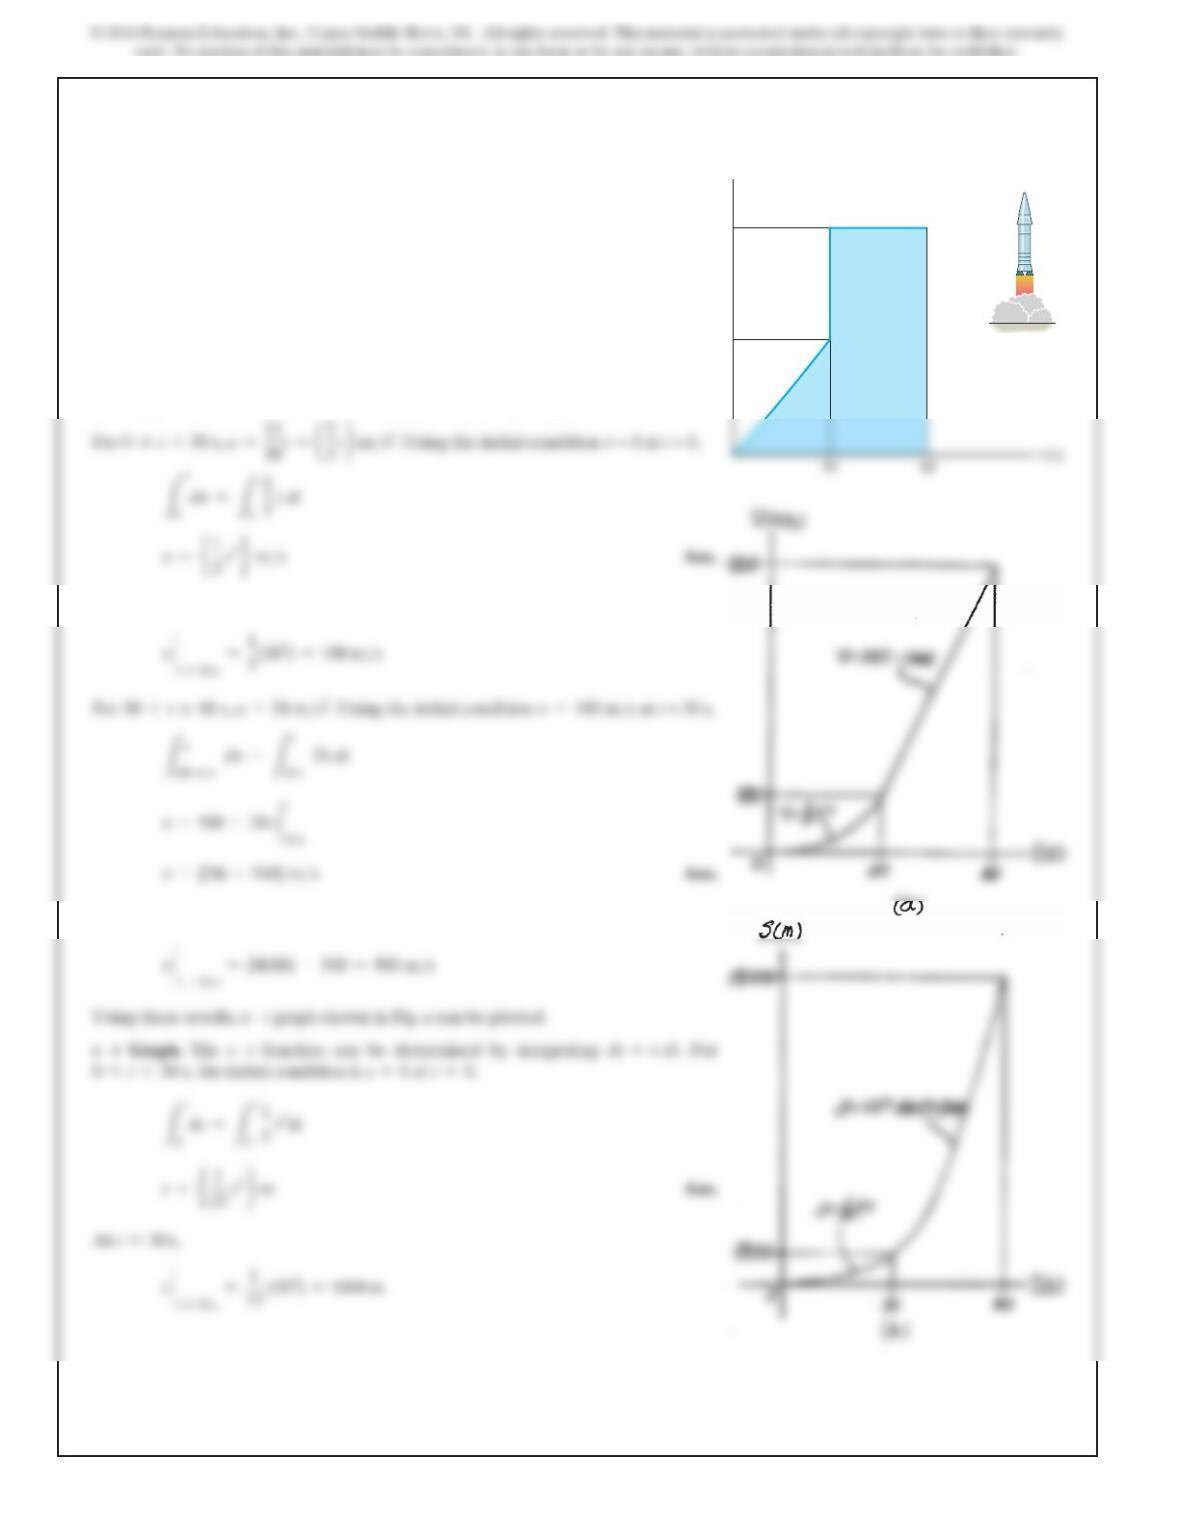
The a–s graph for a rocket moving along a straight track has
been experimentally determined. If the rocket starts at s = 0
when v = 0, determine its speed when it is at
s = 75 ft, and 125 ft, respectively. Use Simpson’s rule with
n = 100 to evaluate v at s = 125 ft.
Ans:
s (ft)
a (ft/s2)
100
5
a 5 6(s 10)5/3
4 8
12–47.
A two-stage rocket is fired vertically from rest at s = 0 with
the acceleration as shown. After 30 s the first stage, A, burns
out and the second stage, B, ignites. Plot the v–t and s–t
graphs which describe the motion of the second stage for
0… t … 60 s.
SOLUTION
v9t
Graph. The
v–t
function can be determined by integrating
dv=a dt
.
At t=30 s,
At t=60 s,
At t=30 s,
24
12
A
B
a (m/s2)
4 9
For
30 s 6t…60 s
, the initial condition is
s=1800 m
at t = 30 s.
12–47. Continued
Ans:
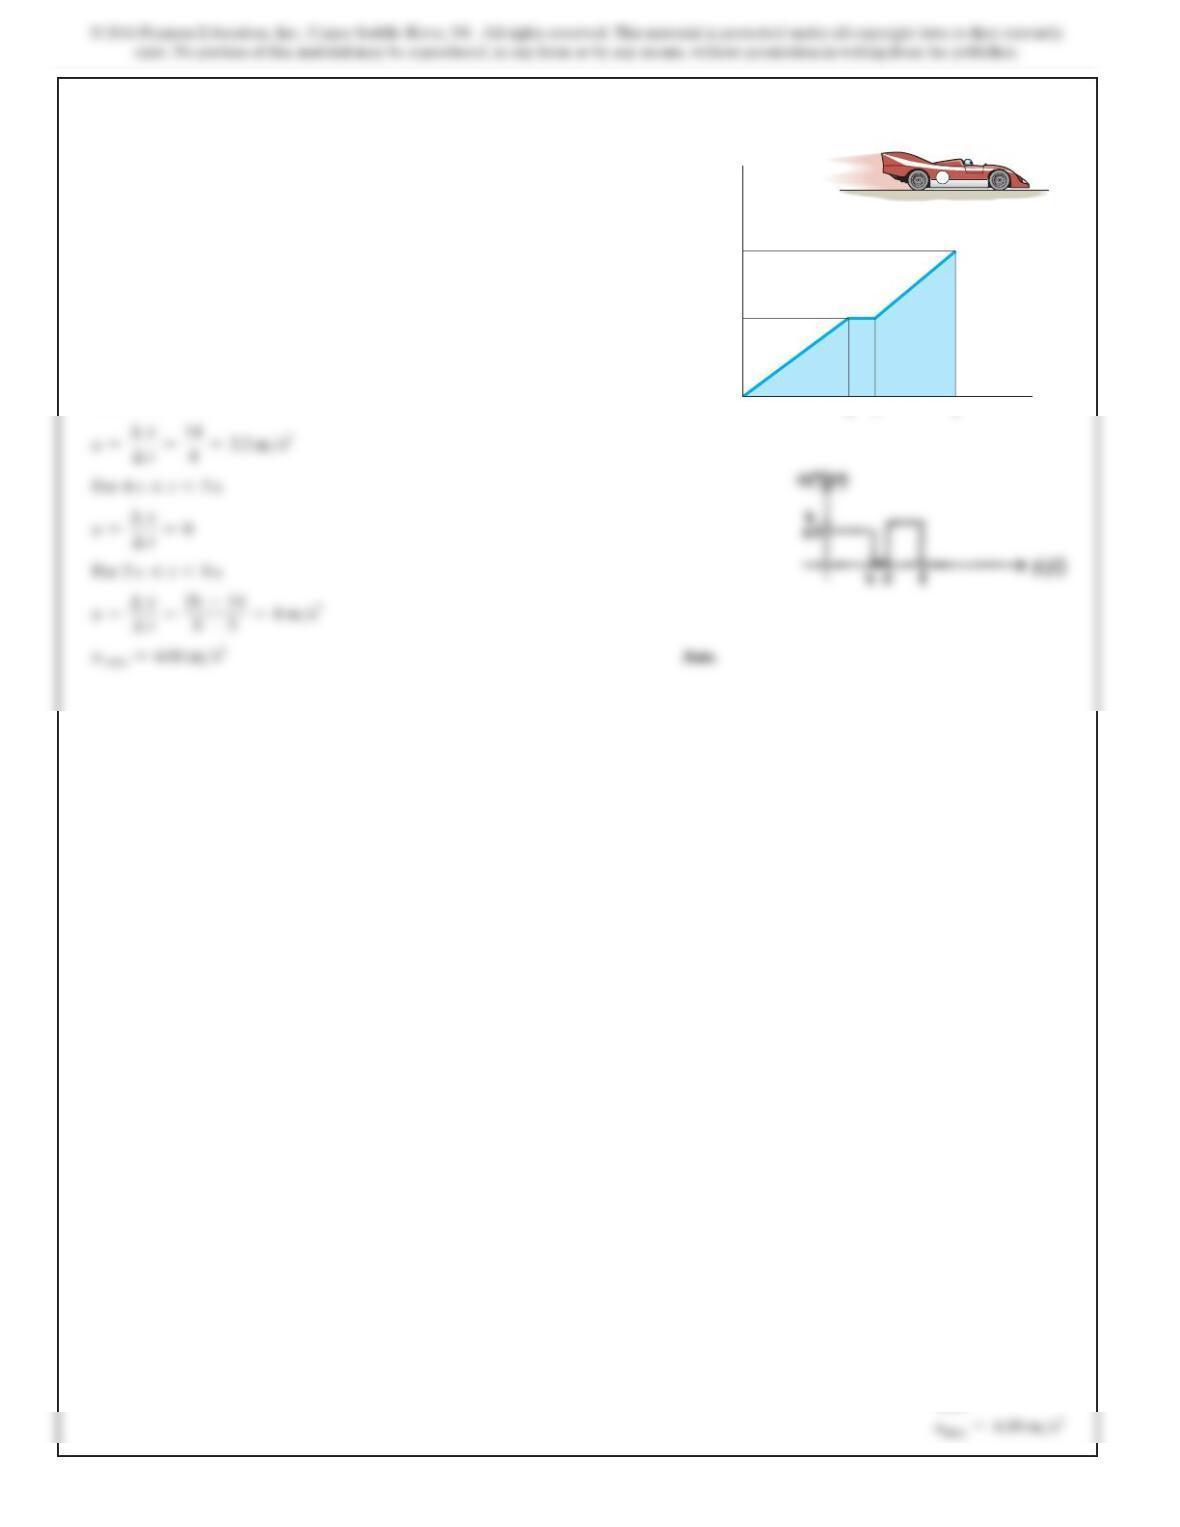
5 0
SOLUTION
For
0…t64 s
*12–48.
The race car starts from rest and travels along a straight
road until it reaches a speed of 26 m
>
s in 8 s as shown on the
v–t graph. The flat part of the graph is caused by shifting
gears. Draw the a–t graph and determine the maximum
acceleration of the car. 26
14
584
t (s)
v (m/s)
v 3.5t
v 4t 6
6
Ans:
5 1
12–49.
SOLUTION
v9t
Function. The
v–t
function can be determined by integrating
dv=a dt
. For
0…t615 s
,
a=6 m>s2.
Using the initial condition
v=10 m>s
at
t=0
,
v={6t+10} m>s
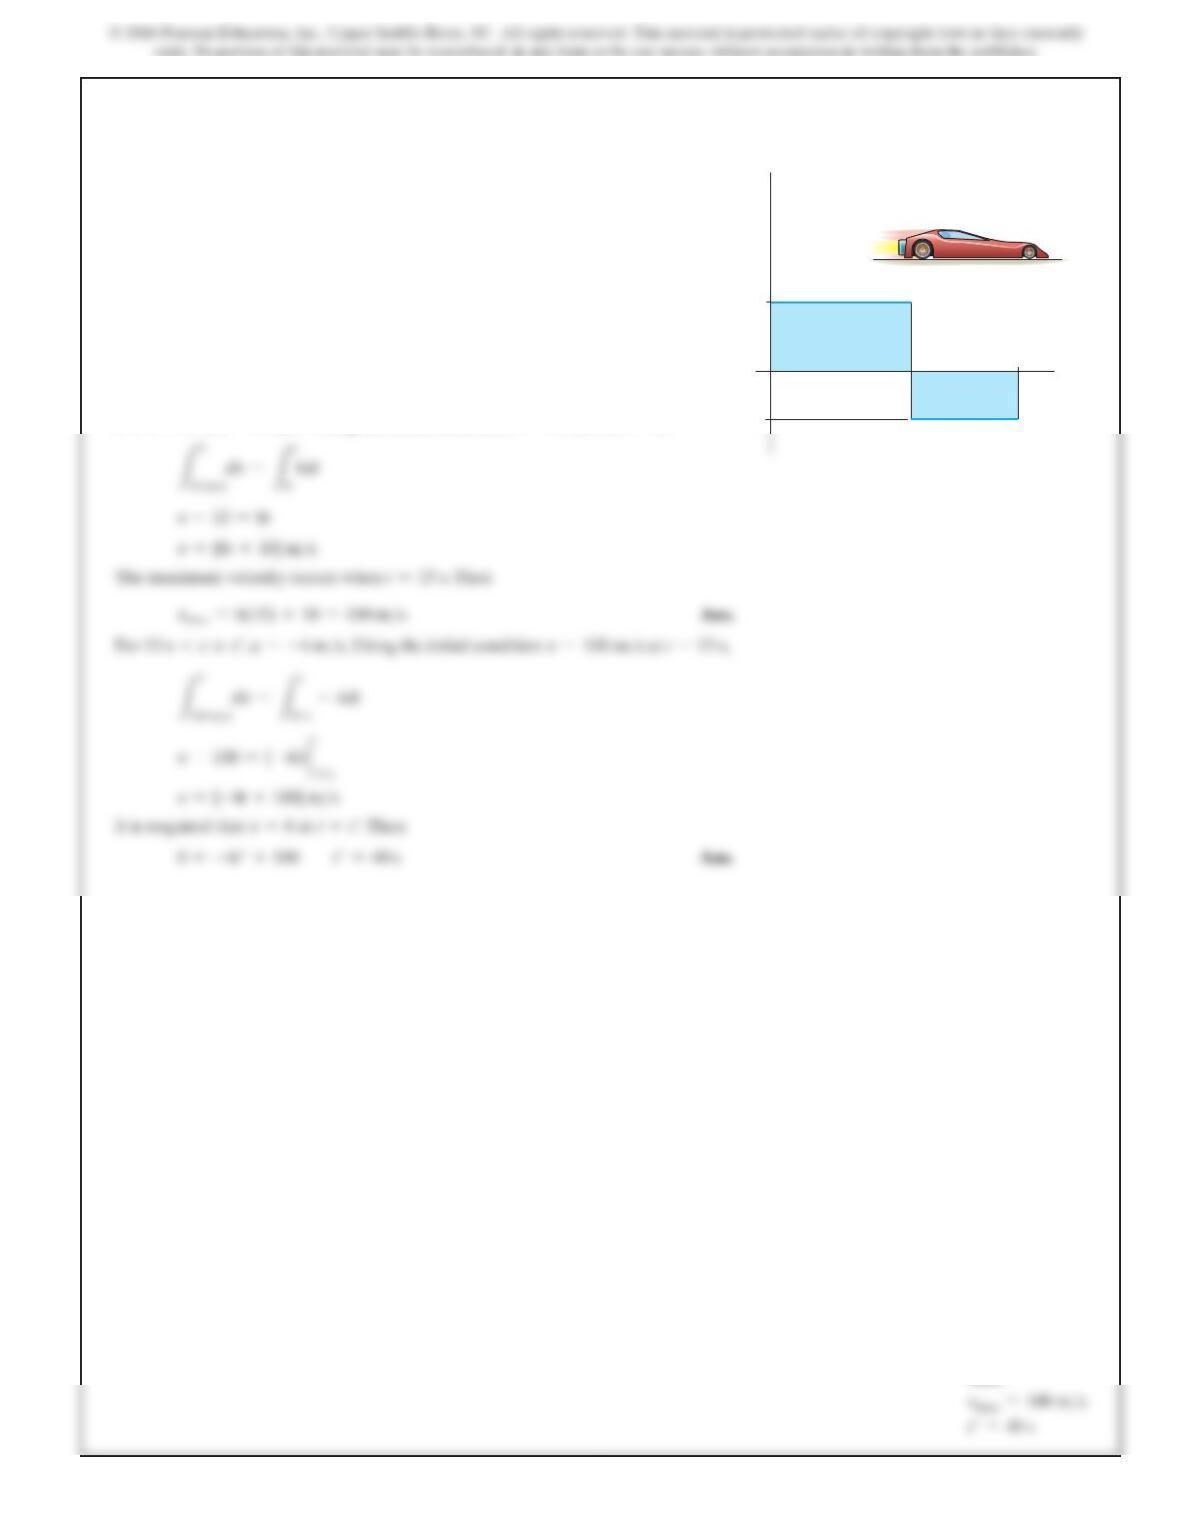
The jet car is originally traveling at a velocity of 10 m
>
s
when it is subjected to the acceleration shown. Determine
the car’s maximum velocity and the time t
′
when it stops.
When t = 0, s = 0.
6
15
4
t (s)
a (
m
/s2)
t¿
Ans:
5 2
SOLUTION
For
s6300 ft
12–50.
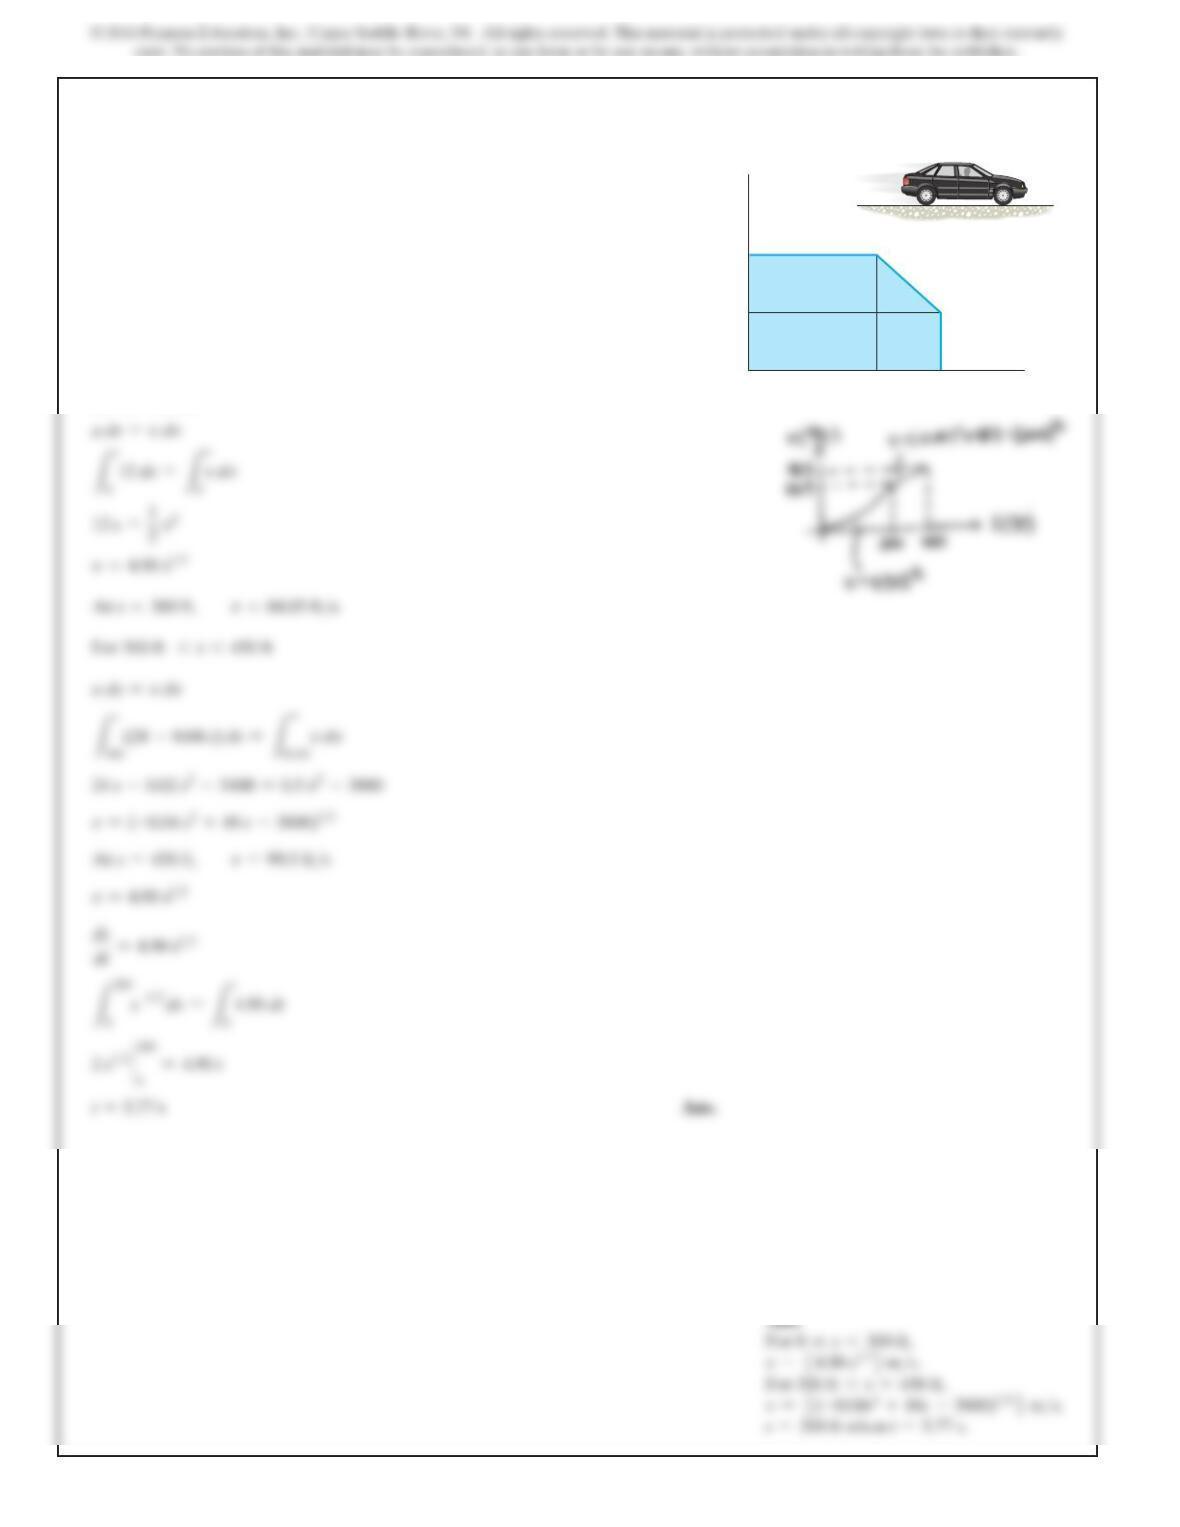
The car starts from rest at s = 0 and is subjected to an
acceleration shown by the a–s graph. Draw the v–s graph
and determine the time needed to travel 200 ft.
s (ft)
a (ft/s2)
a 0.04s 24
300
6
12
450
5 3
v
(m
/
s)
10
6
SOLUTION
s–t Graph. The s–t function can be determined by integrating
ds =v dt
.
t=60 s
For
60 s 6t6120 s,
v=6 m>s
. Using the initial condition
s=180 m
at
t=60 s
,
Ls
180 m
ds =
Lt
60 s
6 dt
t–120
condition
s=540 m
at
t=120 s
,
Ls
Lt
t=180 s
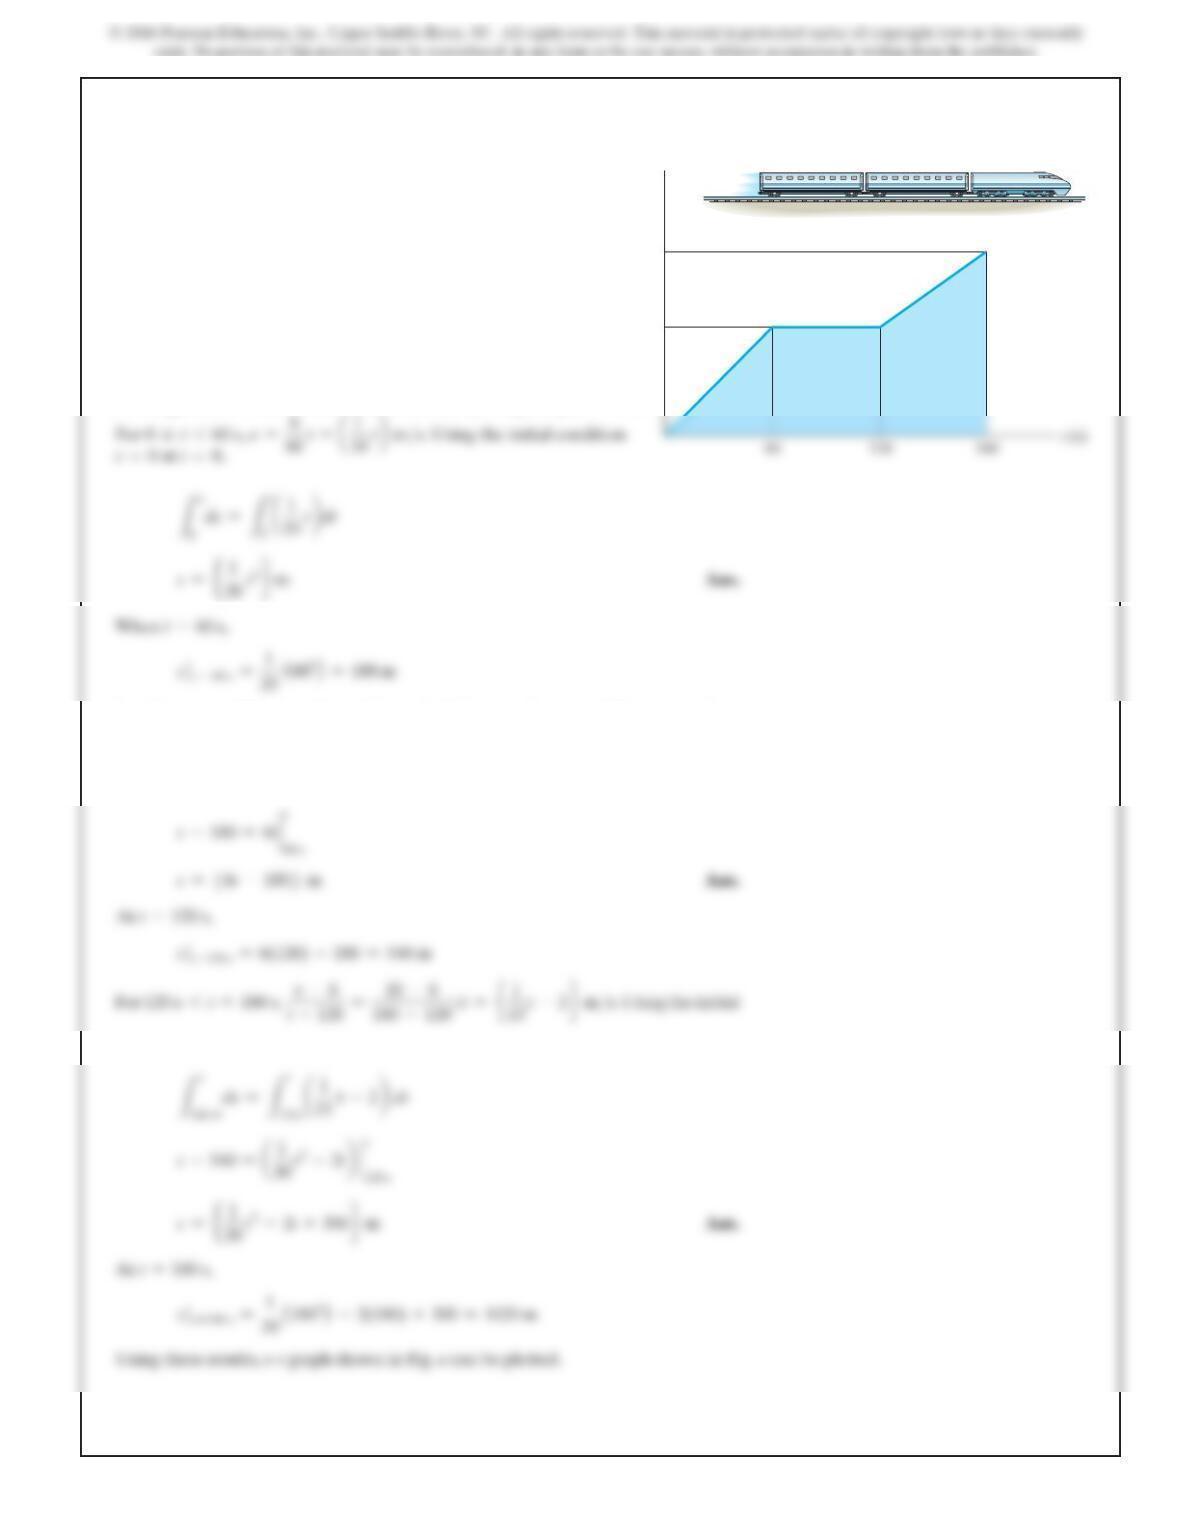
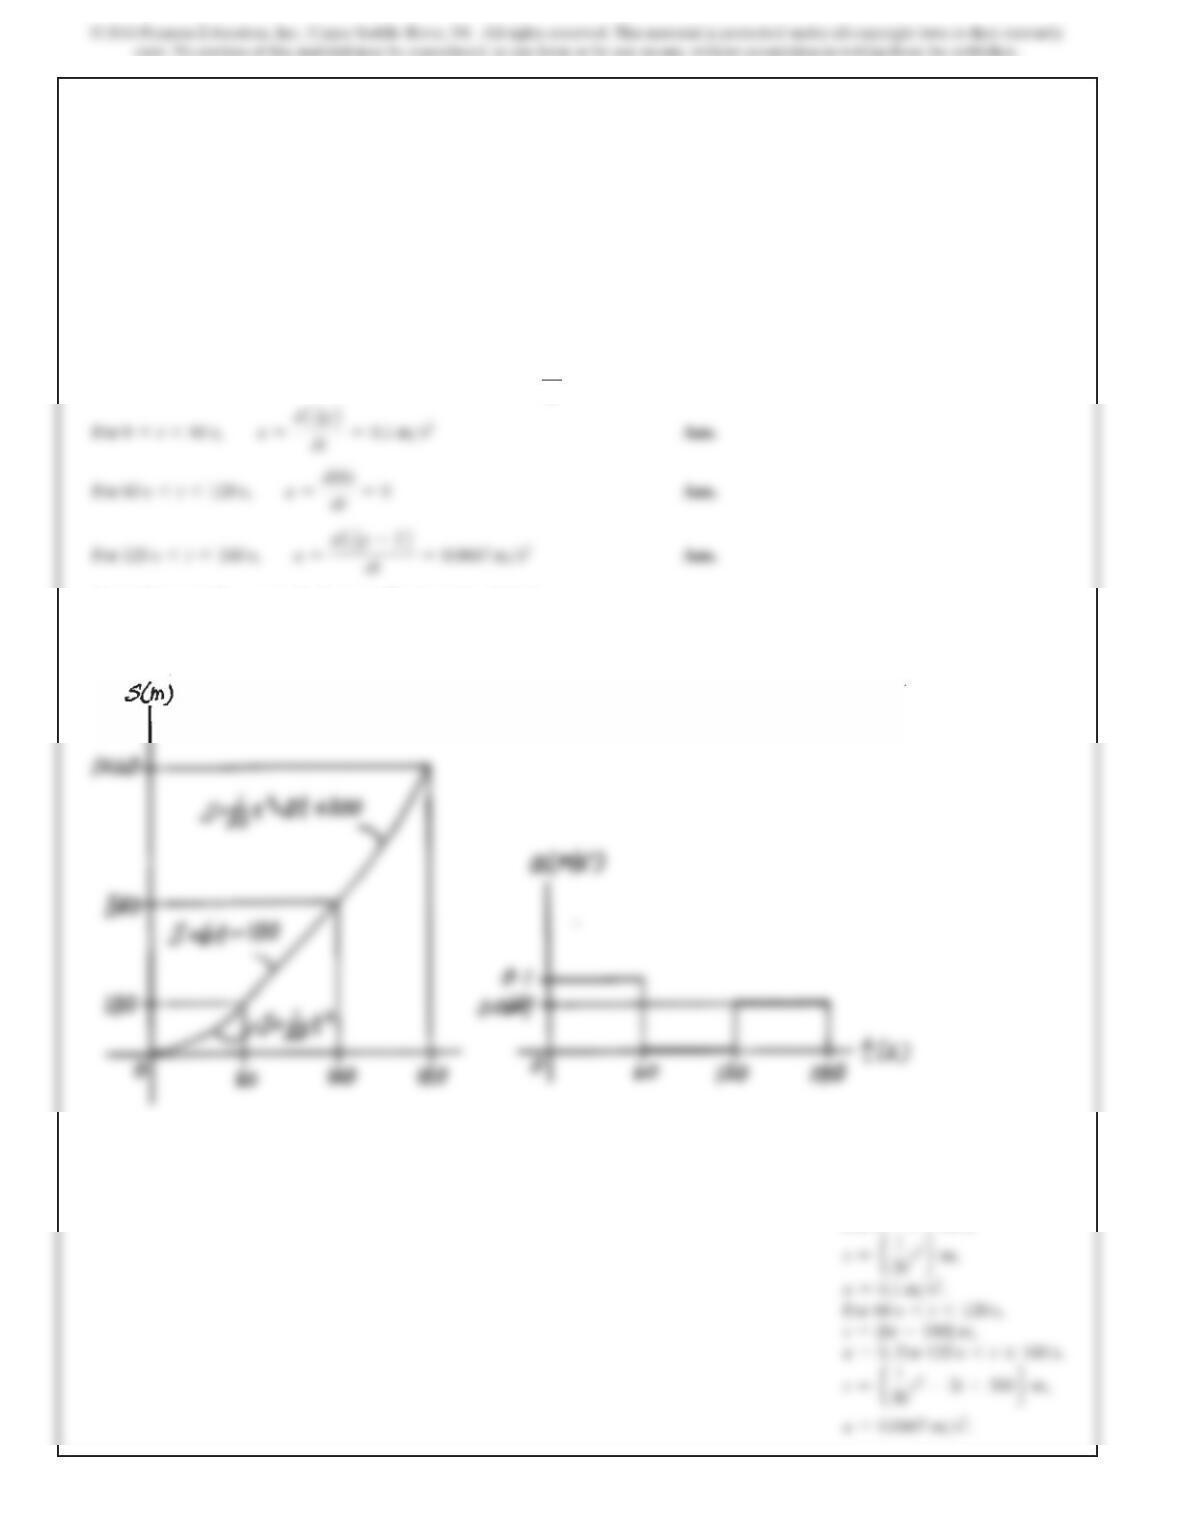
12–51.
The v–t graph for a train has been experimentally
determined. From the data, construct the s–t and a–t graphs
for the motion for 0 … t … 180 s. When t = 0, s = 0.
5 4
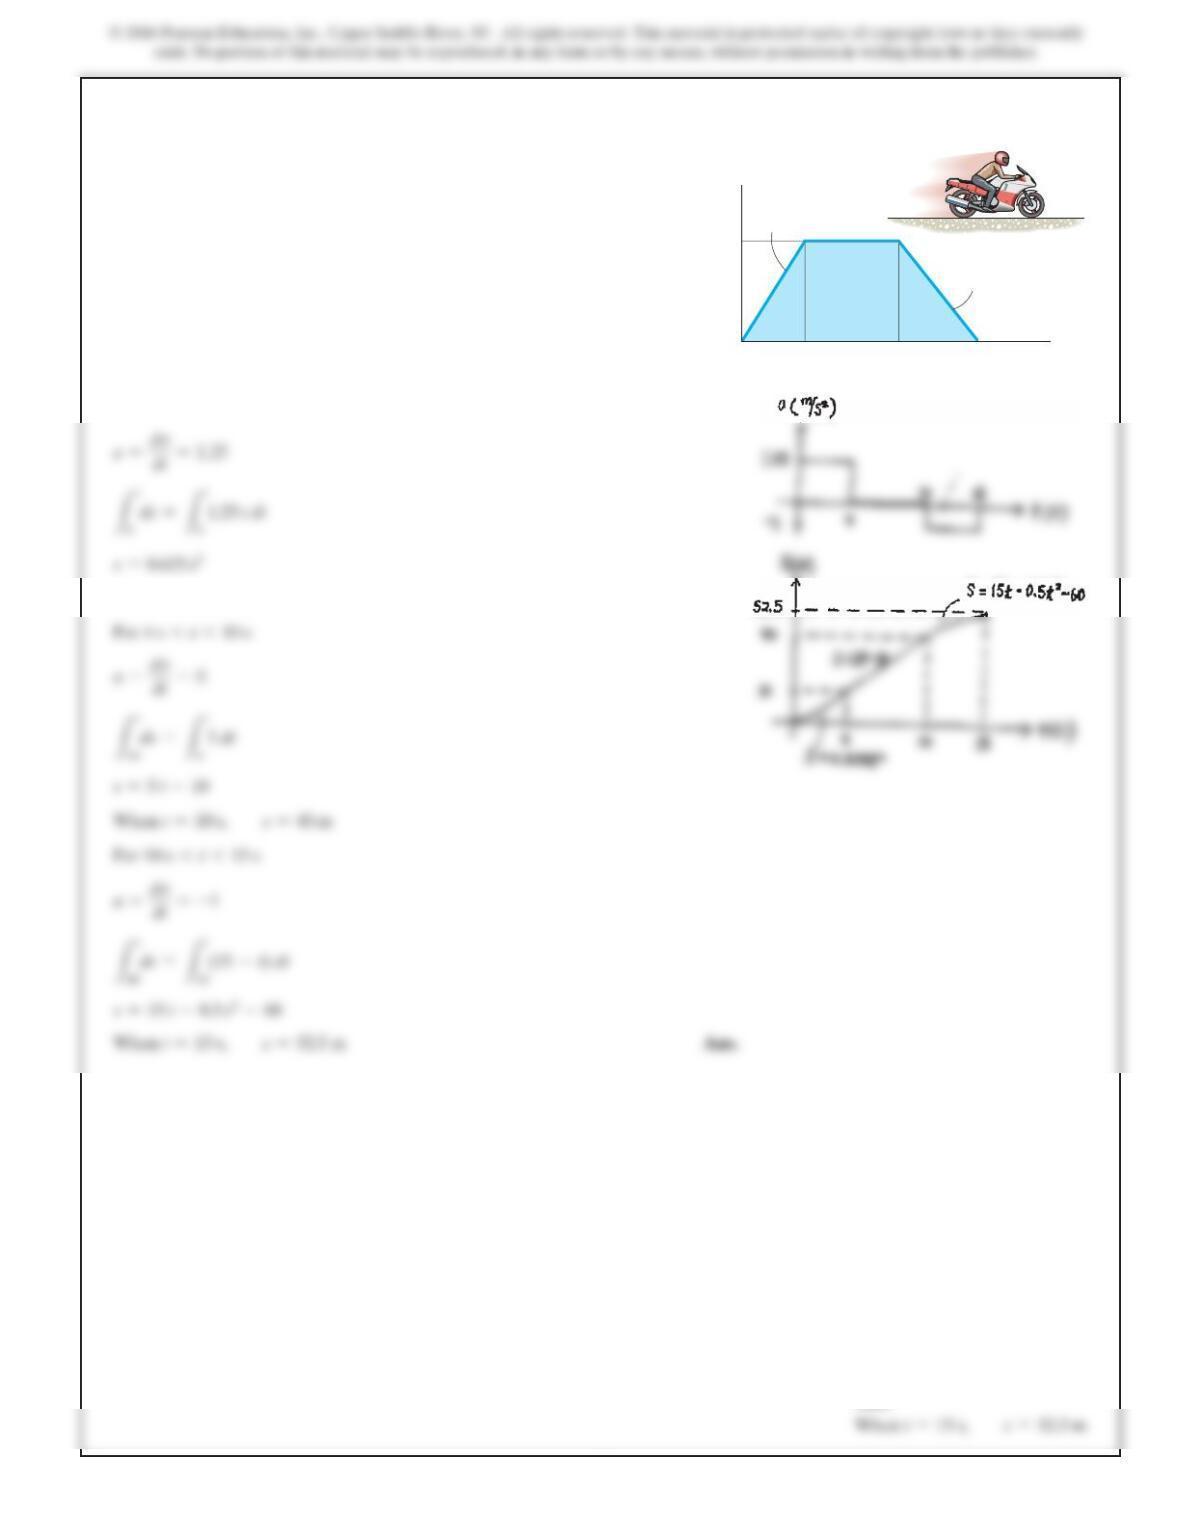
12–51. Continued
a–t Graph. The a–t function can be determined using a=
dv
dt
.
0…t660 s
Using these results, a–t graph shown in Fig. b can be plotted.
Ans:
For
0…t660 s
,
5 5
*12–52.
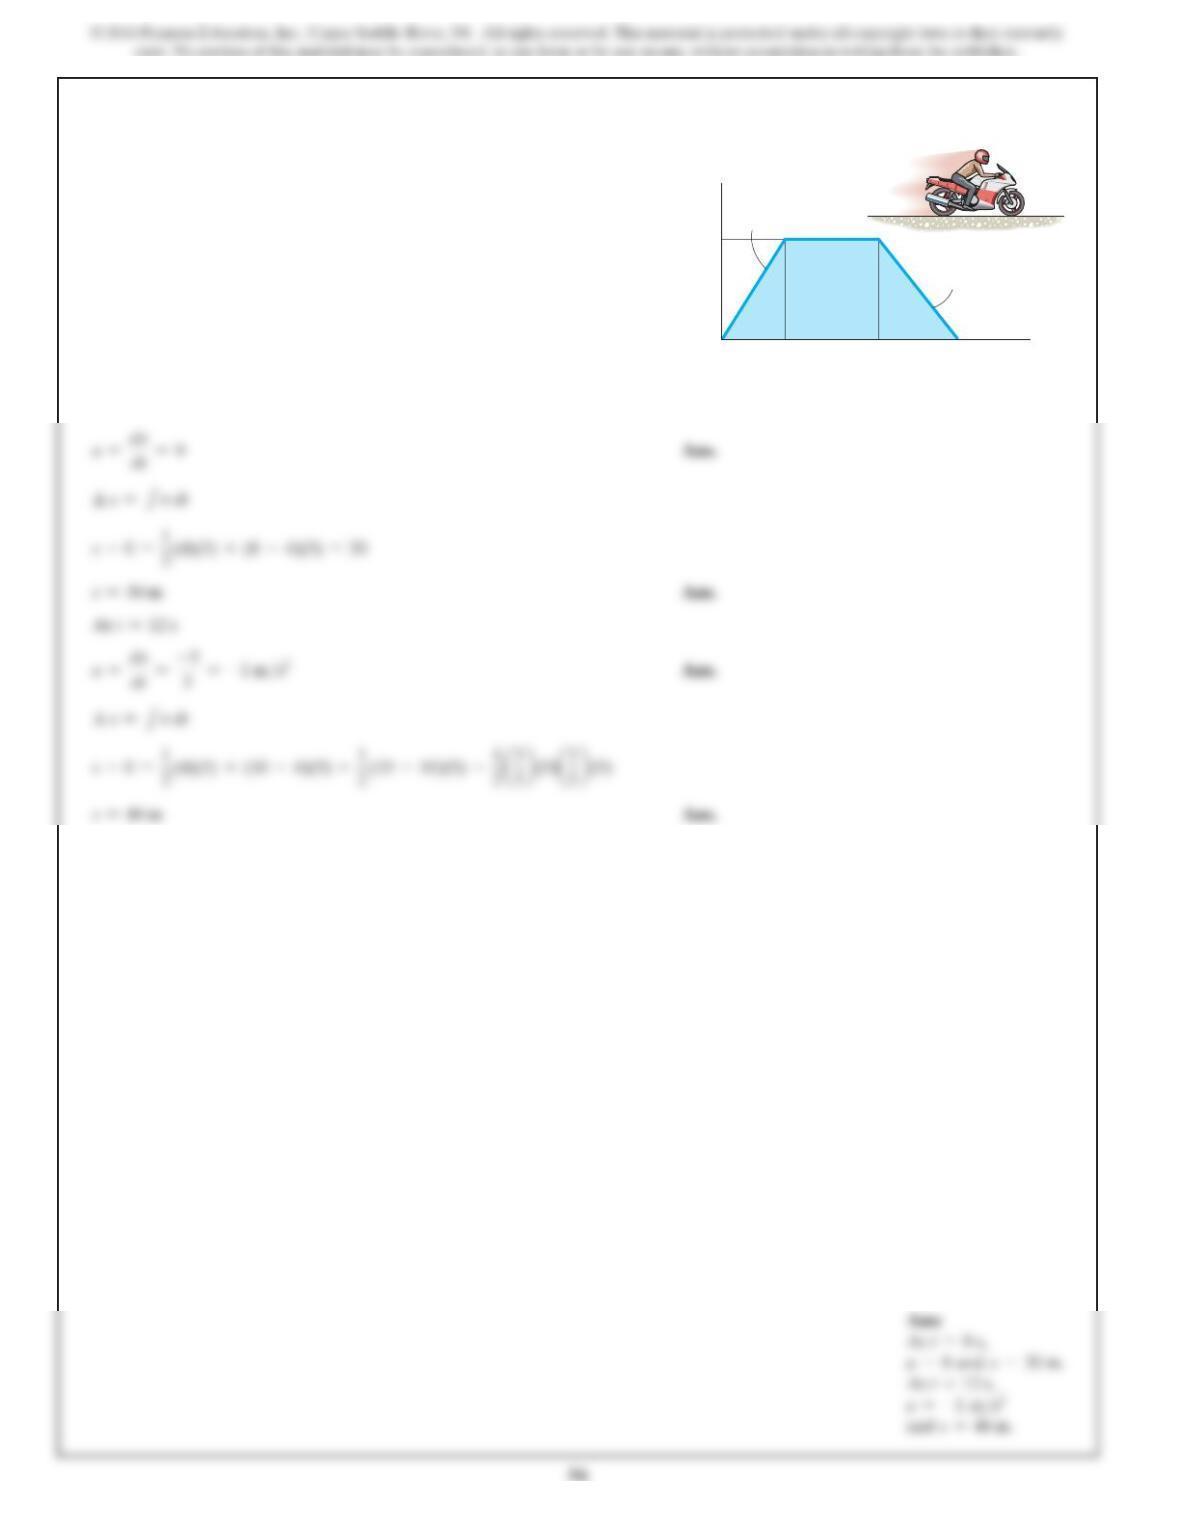
A motorcycle starts from rest at s = 0 and travels along a
straight road with the speed shown by the v–t graph.
Determine the total distance the motorcycle travels until it
stops when t = 15 s. Also plot the a–t and s–t graphs.
5
10 154
t (s)
v (m/s)
v 1.25tv 5
v t 15
SOLUTION
For
t64 s
When
t=4 s,
s=10 m
Ans:
SOLUTION
At t=8 s
At t=12 s
12–53.
A motorcycle starts from rest at s = 0 and travels along a
straight road with the speed shown by the v–t graph.
Determine the motorcycle’s acceleration and position when
t = 8 s and t = 12 s.
5
10 154
t (s)
v (m/s)
v 1.25tv 5
v t 15
At t=8 s
At t=12 s
5 7
12–54.
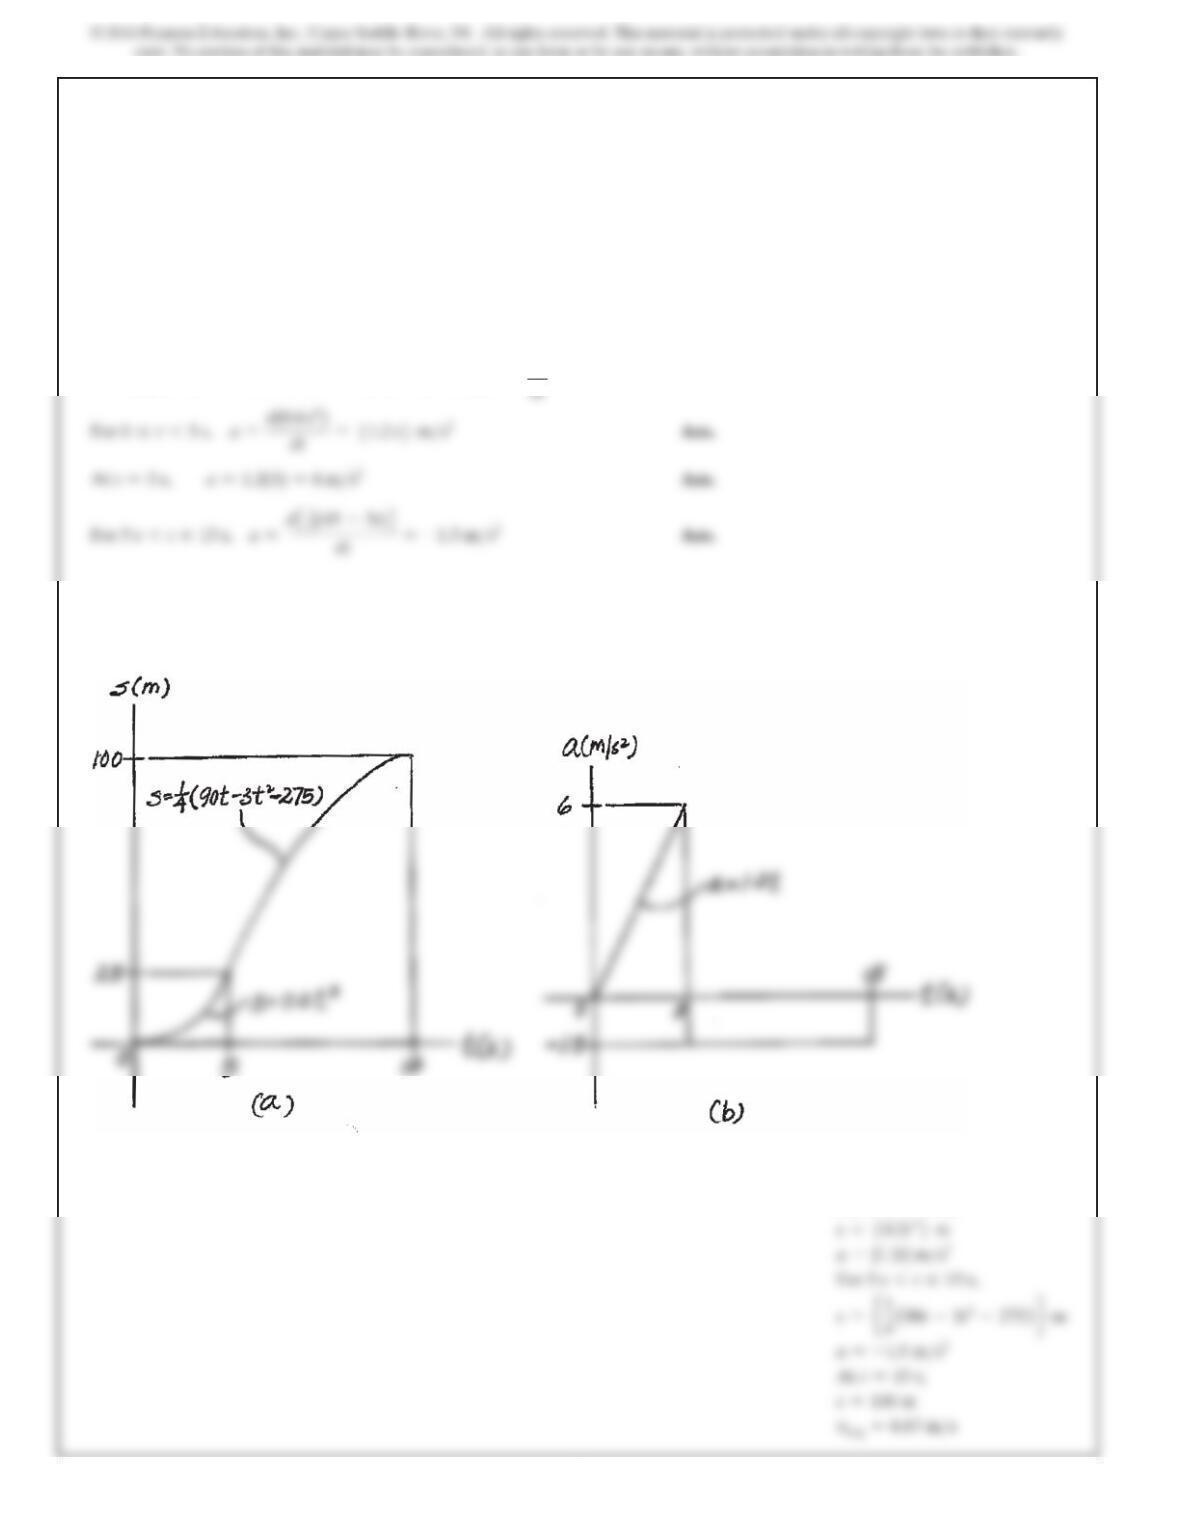
The v–t graph for the motion of a car as it moves along a
straight road is shown. Draw the s–t and a–t graphs. Also
determine the average speed and the distance traveled for
the 15-s time interval. When t = 0, s = 0.
SOLUTION
s–t Graph. The s–t function can be determined by integrating
ds =v dt
.
For
0…t65 s
,
v=0.6t2
. Using the initial condition s
=
0 at t
=
0,
s=25 m
at
t=5 s
,
Ls
25 m
ds =
Lt
5 s
1
2
(45 –3t)dt
515
15
v 0.6t2
t (s)
v (m/s)
5 8
12–54. Continued
a–t Graph. The a–t function can be determined using a=
0…t65 s
dv
.
Ans:
For
0…t65 s
,
5 9
12–55.
SOLUTION
v0=110 ft>s
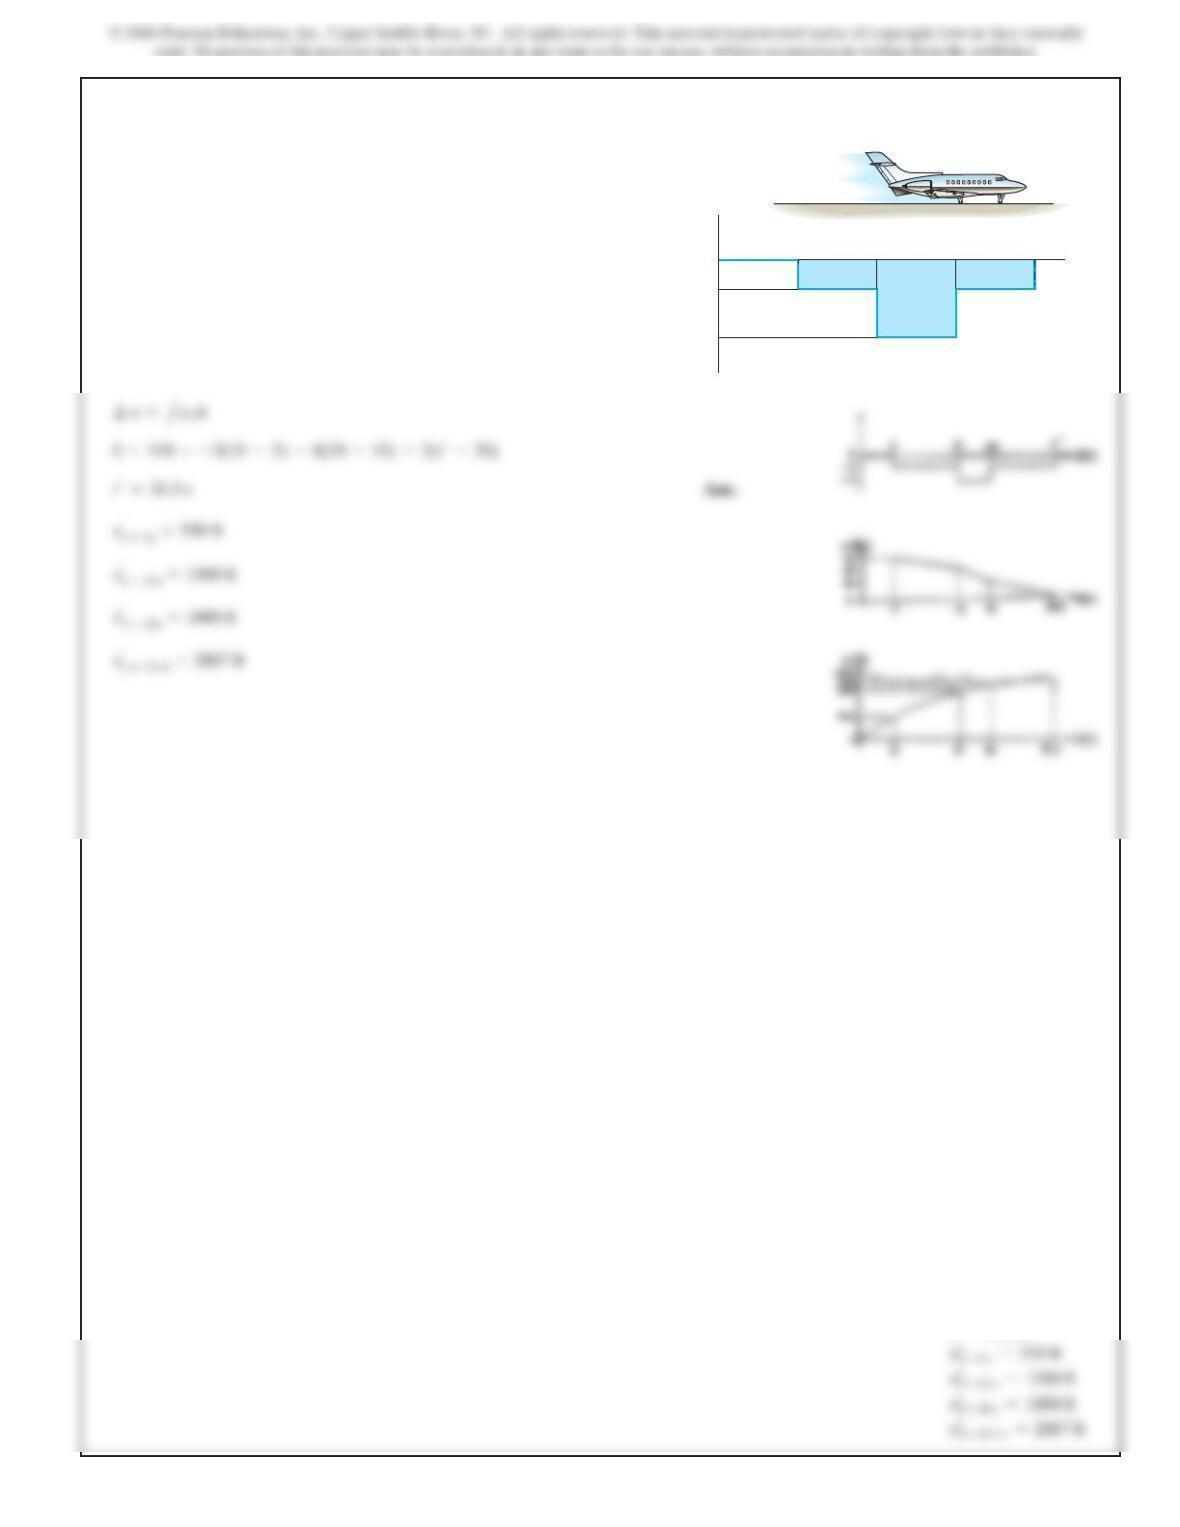
An airplane lands on the straight runway,originally traveling
at 110 ft s when If it is subjected to the decelerations
shown, determine the time needed to stop the plane and
construct the s–t graph for the motion.
t¿
s=0.>
t(s)
5
a(ft/s2)
–3
15 20 t’
–8
Ans:
t′=33.3
s
6 0
SOLUTION
v9s
Function. The
v–s
function can be determined by integrating
v dv=a ds
.
At
s=50 ft,
At
s=100 ft,
L
v
37.42 ft
>
s
v dv =L
s
100 ft
a
–
3
25 s +18
b
ds
6
8
100 150
s (ft)
a (ft/s2)
*12–56.
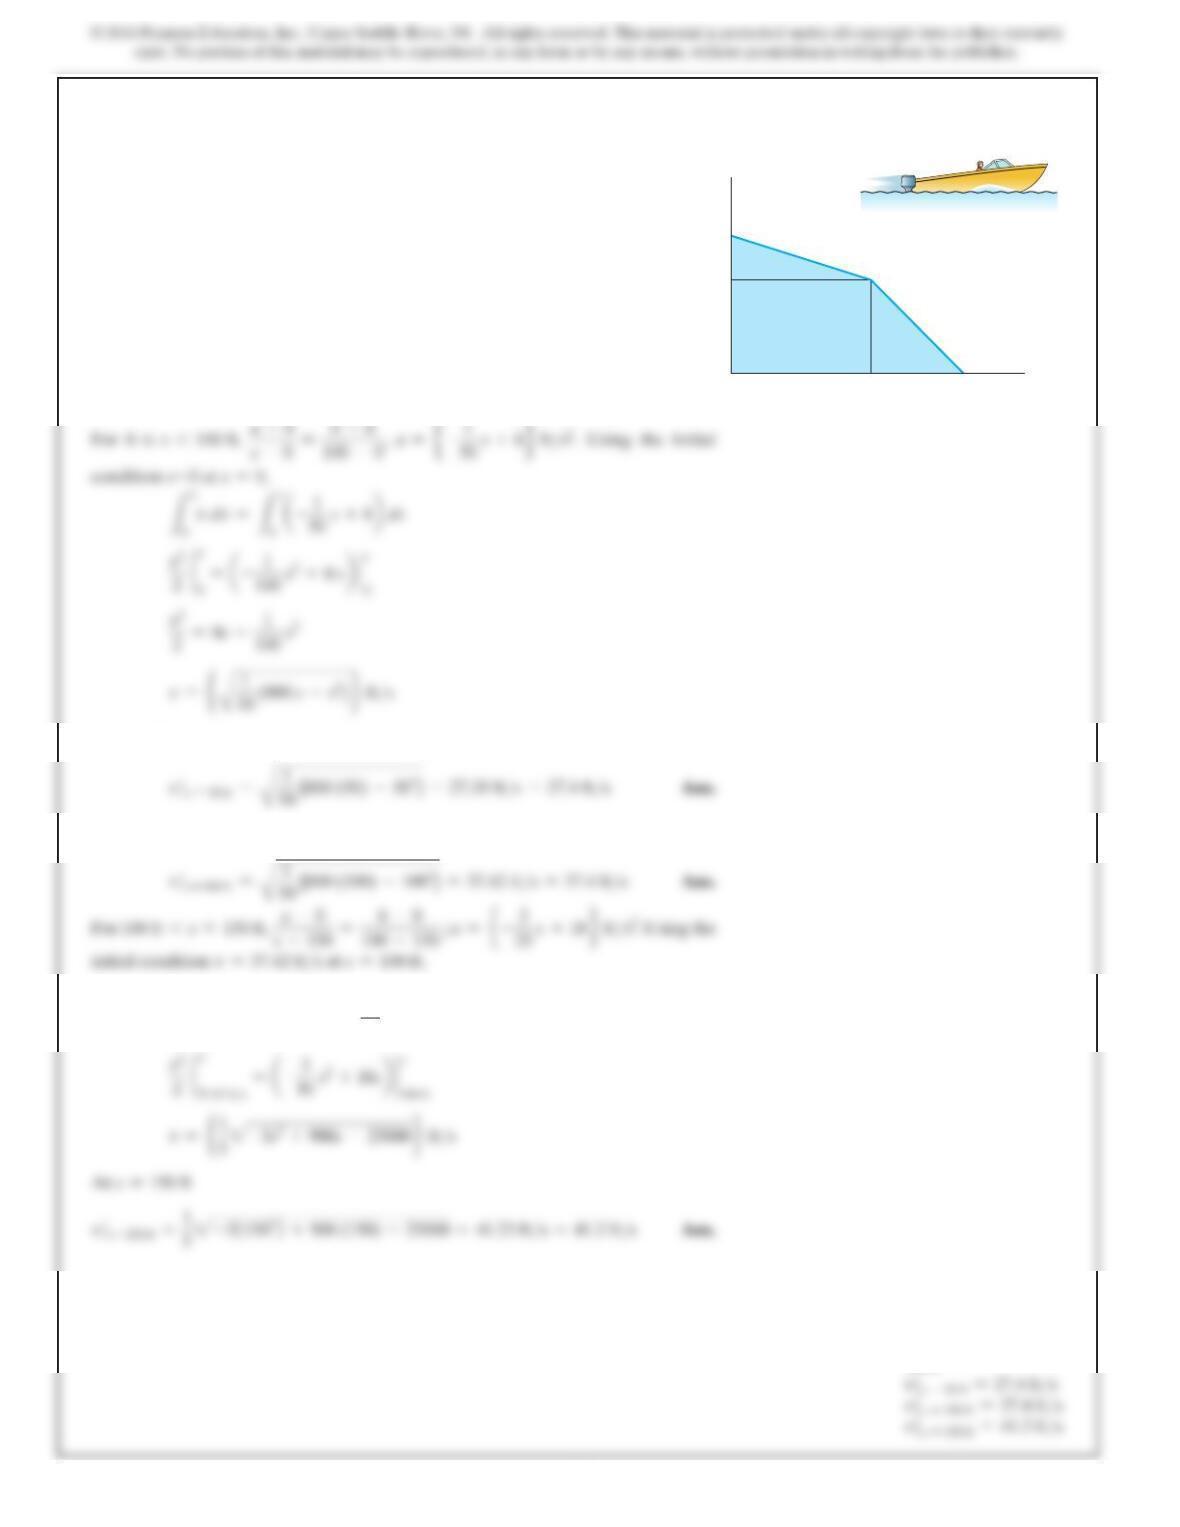
Starting from rest at s = 0, a boat travels in a straight line
with the acceleration shown by the a–s graph. Determine
the boat’s speed when s = 50 ft, 100 ft, and 150 ft.
Ans: