
1
CHAPTER 1
INTRODUCTION TO MECHANICAL AND ELECTRICAL SYSTEMS:
ENERGY, SUSTAINABILITY, AND ECONOMICS
OVERVIEW
Chapter 1 covers topics that are relevant for all the mechanical and electrical systems
covered in subsequent chapters. These materials are essential background and context for
subsequent chapters.
Mechanical systems involve the transfer of energy and fluids. Understanding the basic
physics of energy is a prerequisite for building load estimating, systems selection and
energy conservation. Chapter 1 describes heat, thermal properties of materials, the
conversion of energy from one form to another, and the thermal values of commonly
used fuels. Transfer of fluids is covered so that students understand the units of flow and
pressure that are used to specify and measure the performance of systems and equipment.
Simple example problems are included, and the instructor is encouraged to work them
and similar exercises on the board to insure that students are prepared to go on to
subsequent chapters.
Mechanical and electrical systems affect the design of buildings. Architectural students
especially should appreciate why modern buildings are different in form and dimension
to older buildings. This understanding is useful if future buildings are to use less energy
by using passive climate control strategies.
evaluation tools to assess quality. Several methods are presented, including the decision
matrix, which is useful in documenting subjective criteria, and various economic
evaluation tools, such as payback analysis and life cycle costing.
CHAPTER 1
INTRODUCTION TO MECHANICAL AND ELECTRICAL SYSTEMS:
ENERGY, SUSTAINABILITY, AND ECONOMICS
QUESTIONS AND ANSWERS
1.1 If lighting load for a 20,000 sq ft building is estimated at 2 Watts/sq ft, what will
be the resulting heat generated by lighting?
1.2 If the lighting load were increased, what would be the effect on other building
systems?
1.3 How much CO2 will be liberated to the atmosphere in a year’s time due to
lighting operation in the building of question 1?
1.4 How much heat (Btu’s) will be stored in a 100 sq ft concrete wall 1 ft thick if it is
warmed from 75ºF to 85ºF by exposure to sunlight?
1.5 What is the value of the heat in question 2 compared with gas at $1.00 per
therms burned in a boiler at 85% efficiency?
1.6 How does “sustainable” design differ from energy effective design?
1.7 What factors should the architect and engineer consider to produce a high
performance environment for building occupants?
1.8 What is the relationship between building codes and sustainable design?
1.9 How does saving energy help to protect the environment?
Using less energy reduces air pollution from burning fossil fuels.
1.10 What is the role of maintainability in sustainable buildings?
1.11 How could building site selection affect the environment?
1.12 What factors should interior designers consider in terms of indoor air quality?
Architects? HVAC engineers? Design teams?
4
1.13 What design features would you suggest to allow personal climate control in a
single story residence? A high rise office building? A classroom building?
1.14 What sustainable design issue should architects consider in deciding window
materials and locations?
1.15 What is the difference between qualitative and quantitative factors in an
analysis? How might we deal with each?
1.16 Prepare a decision matrix to decide between operable windows and fixed
windows in an office building. Fill out the matrix as if you were an occupant, a
maintenance staffer, the building owner.
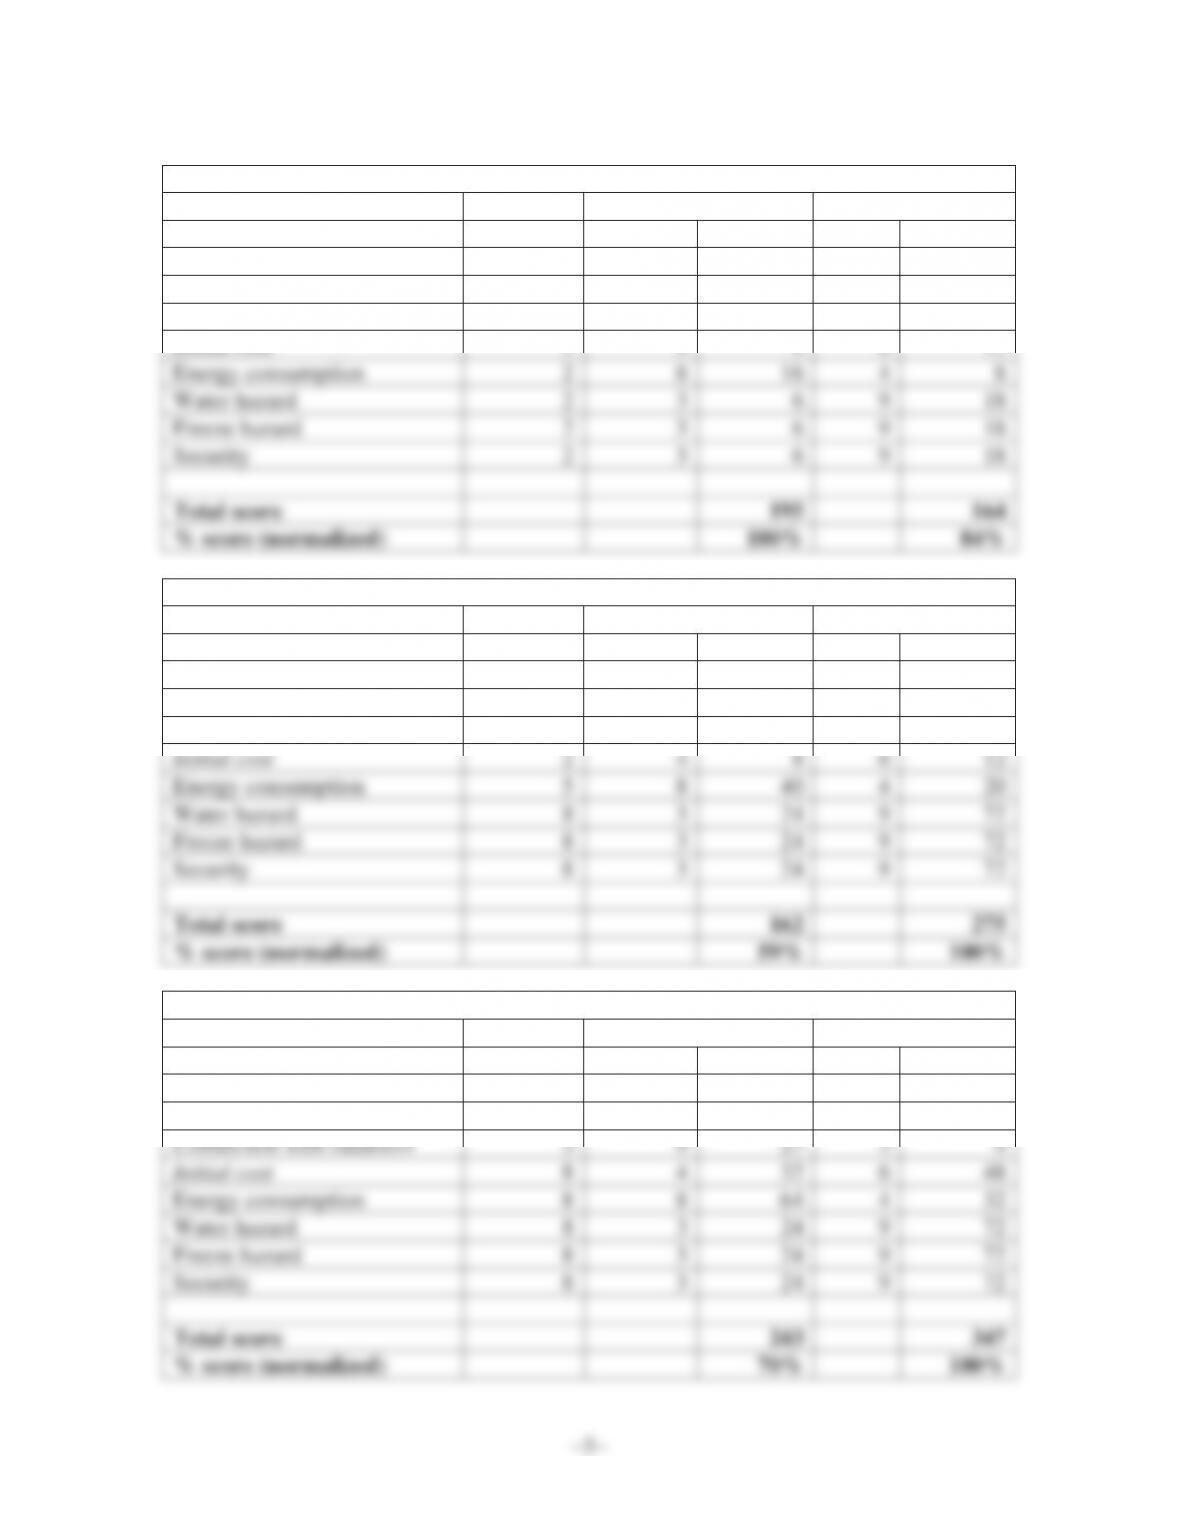
How an Occupant Might Think of Operable Windows
Operable Windows Fixed Sash
Criteria Weight Score Weighted Score Weighted
Comfort 9 8 72 7 63
Connection with outdoors 9 9 81 3 27
Initial cost 2486 12
How an Occupant Might Think of Operable Windows
Operable Windows Fixed Sash
Criteria Weight Score Weighted Score Weighted
Comfort 3 8 24 7 21
Connection with outdoors 2 9 18 3 6
How an Occupant Might Think of Operable Windows
Operable Windows Fixed Sash
Criteria Weight Score Weighted Score Weighted
Comfort 6 8 48 7 42
6
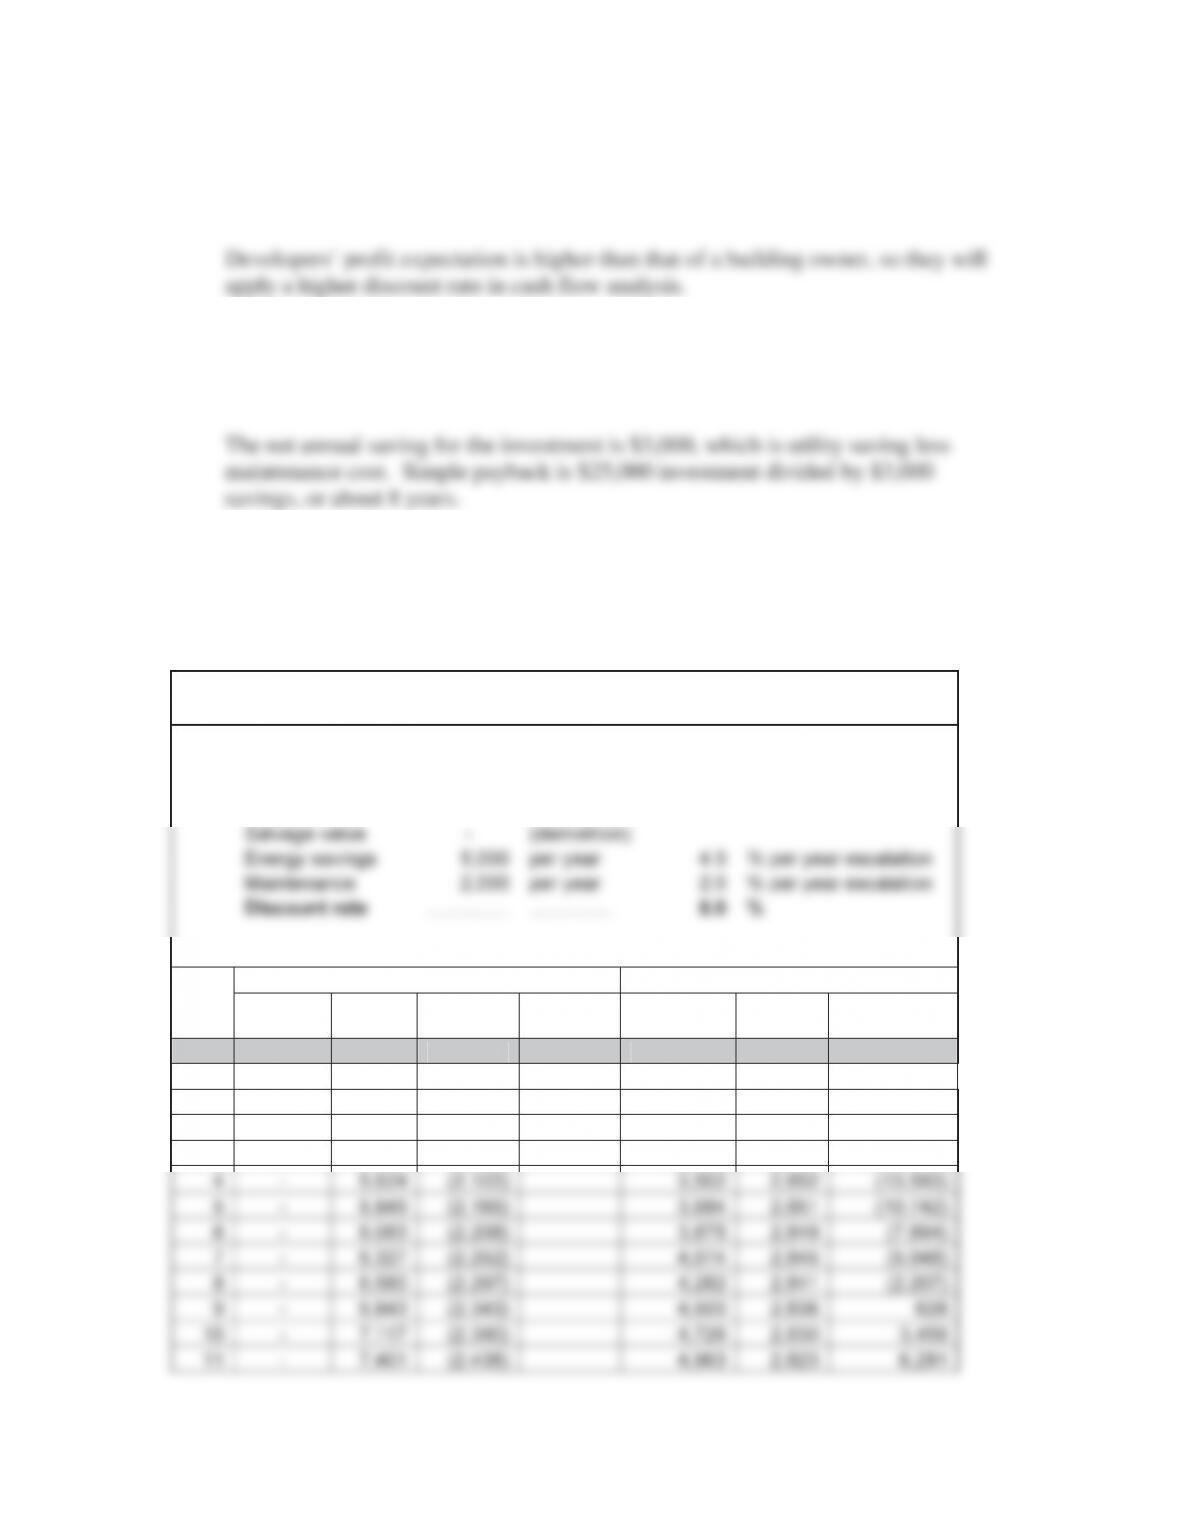
1.17 Will a developer use a higher or lower discount rate than a building owner?
Why?
1.18 An energy conservation option has a first cost of $25,000. It requires $2,000
per year maintenance and saves $5,000 per year in utilities. What is the simple
payback period for the option?
1.19 The system in the prior exercise will last 15 years with no salvage value. What
is the 15-year life cycle cost assuming energy cost escalation of 4% annually,
maintenance cost escalation 2% annually, and a 5% discount rate? What if the
discount rate is 15%?
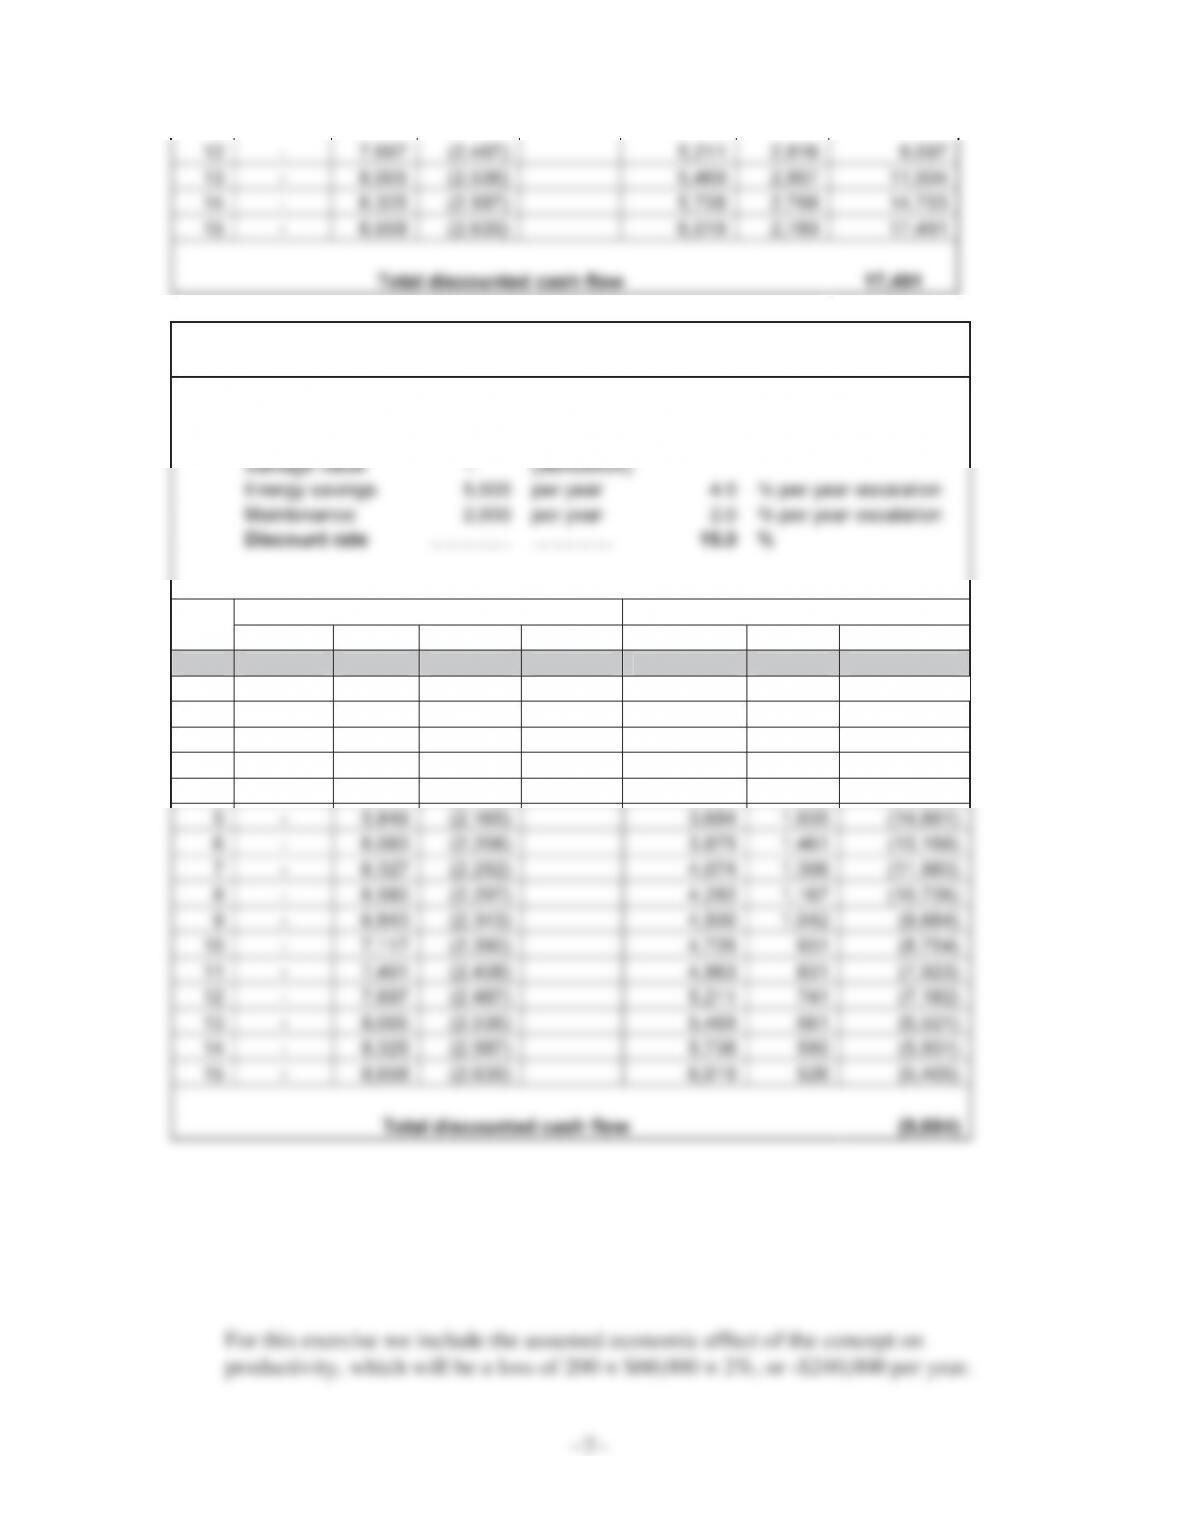
Cash Flow Analysis for a $25,000 Feature, 5% Discount Rate
First
cost 25,000 over and above base
Equipment life 15 years
Savings or (Costs) for Year Incurred Net Present Value
Year Instl. Energy Maint.
Net
annual Year Cumulative
0 (25,000) – – (25,000) (25,000) (25,000)
1 – 5,000 (2,000) 3,000 2,850 (22,150)
2 – 5,200 (2,040) 3,160 2,852 (19,298)
3 – 5,408 (2,081) 3,327 2,853 (16,445)
7
12 – 7,697 (2,487) 5,211 2,816 9,097
13 – 8,005 (2,536) 5,469 2,807 11,904
14 – 8,325 (2,587) 5,738 2,798 14,703
15 – 8,658 (2,639) 6,019 2,789 17,491
Total discounted cash flow 17,491
Cash Flow Analysis for a $25,000 Feature, 15% Discount Rate
First cost 25,000 over and above base
Equipment life 15 years
Savings or (Costs) for Year Incurred Net Present Value
Year Instl. Energy Maint. Net annual Year Cumulative
0 (25,000) – – (25,000) (25,000) (25,000)
1 – 5,000 (2,000) 3,000 2,550 (22,450)
2 – 5,200 (2,040) 3,160 2,283 (20,167)
3 – 5,408 (2,081) 3,327 2,043 (18,124)
4 – 5,624 (2,122) 3,502 1,828 (16,296)
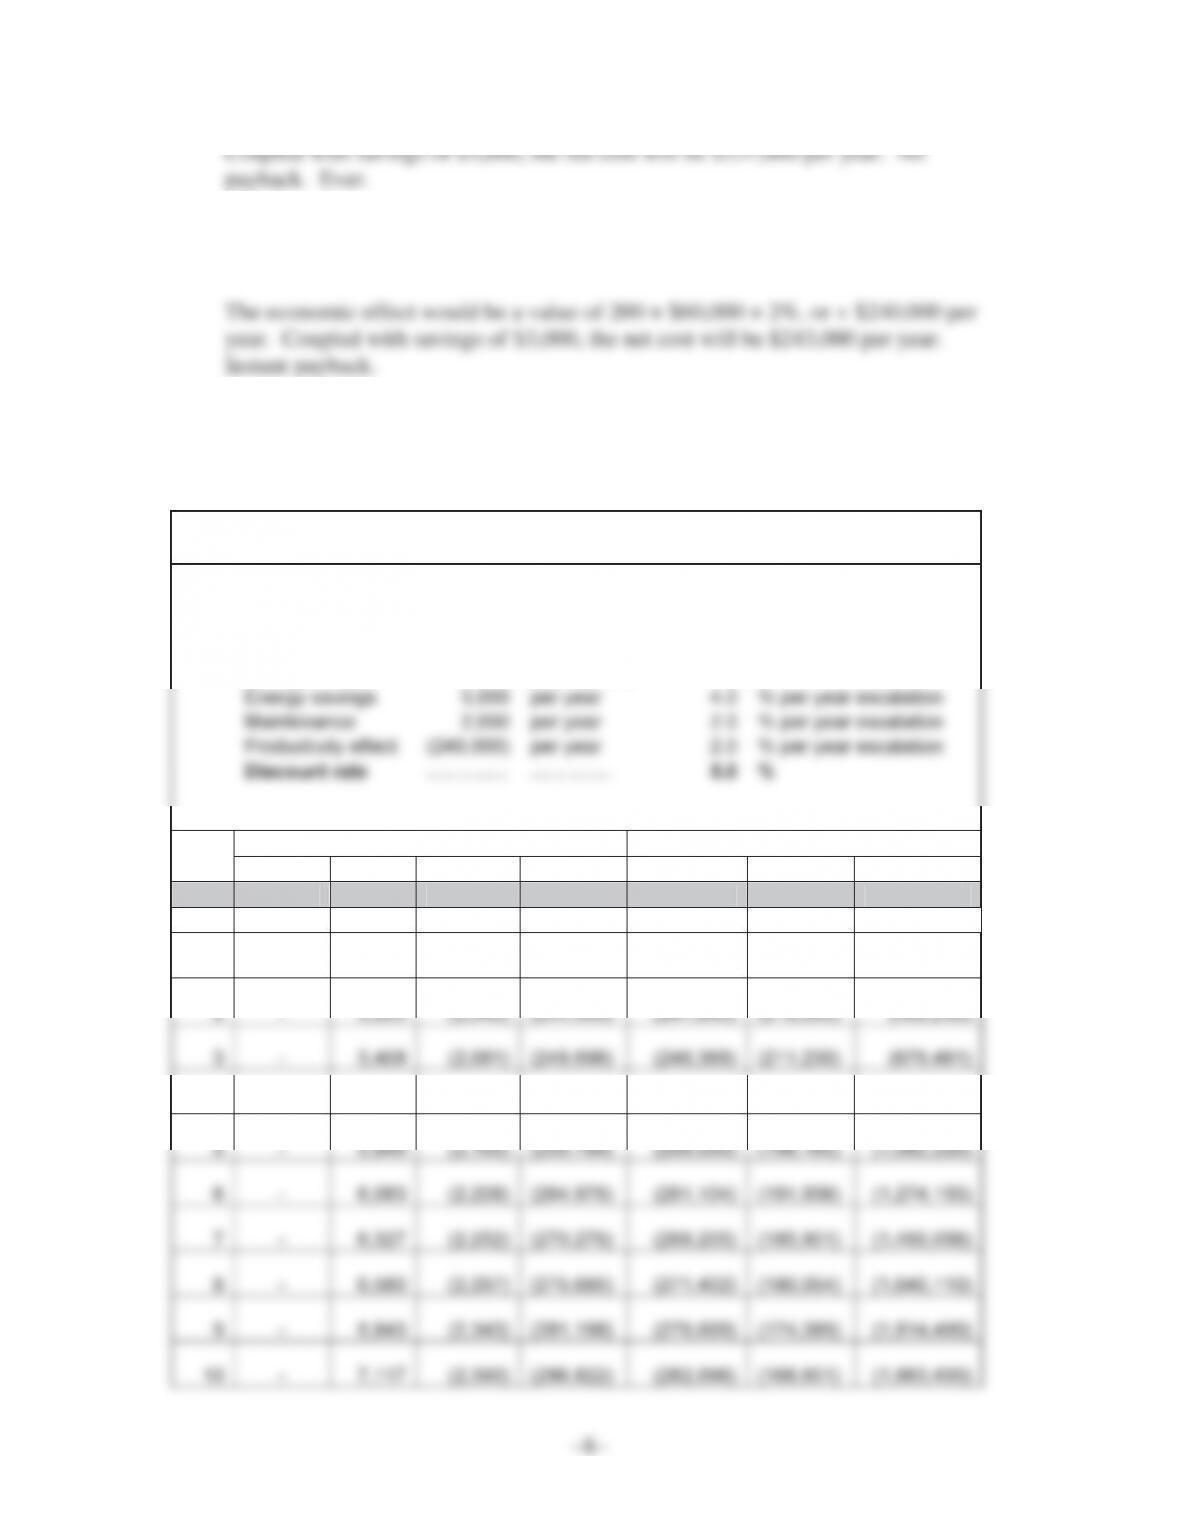
1.20 Assume the option in the prior exercise is installed in a building with 200
occupants, average personnel cost $60,000 per year. If the device interferes with
temperature control, resulting in 2% decrease in productivity, what would the
simple payback be?
8
Coupled with savings of $3,000, the net cost will be $237,000 per year. No
payback. Ever.
1.21 What would the payback be if the option in the prior exercise improved
temperature control and resulted in a 2% increase in productivity?
1.22 Calculate the life cycle costs for the two cases (2% decrease, 2% increase in
productivity) using data from prior exercises for 5% discount rate and 15%
discount rate.
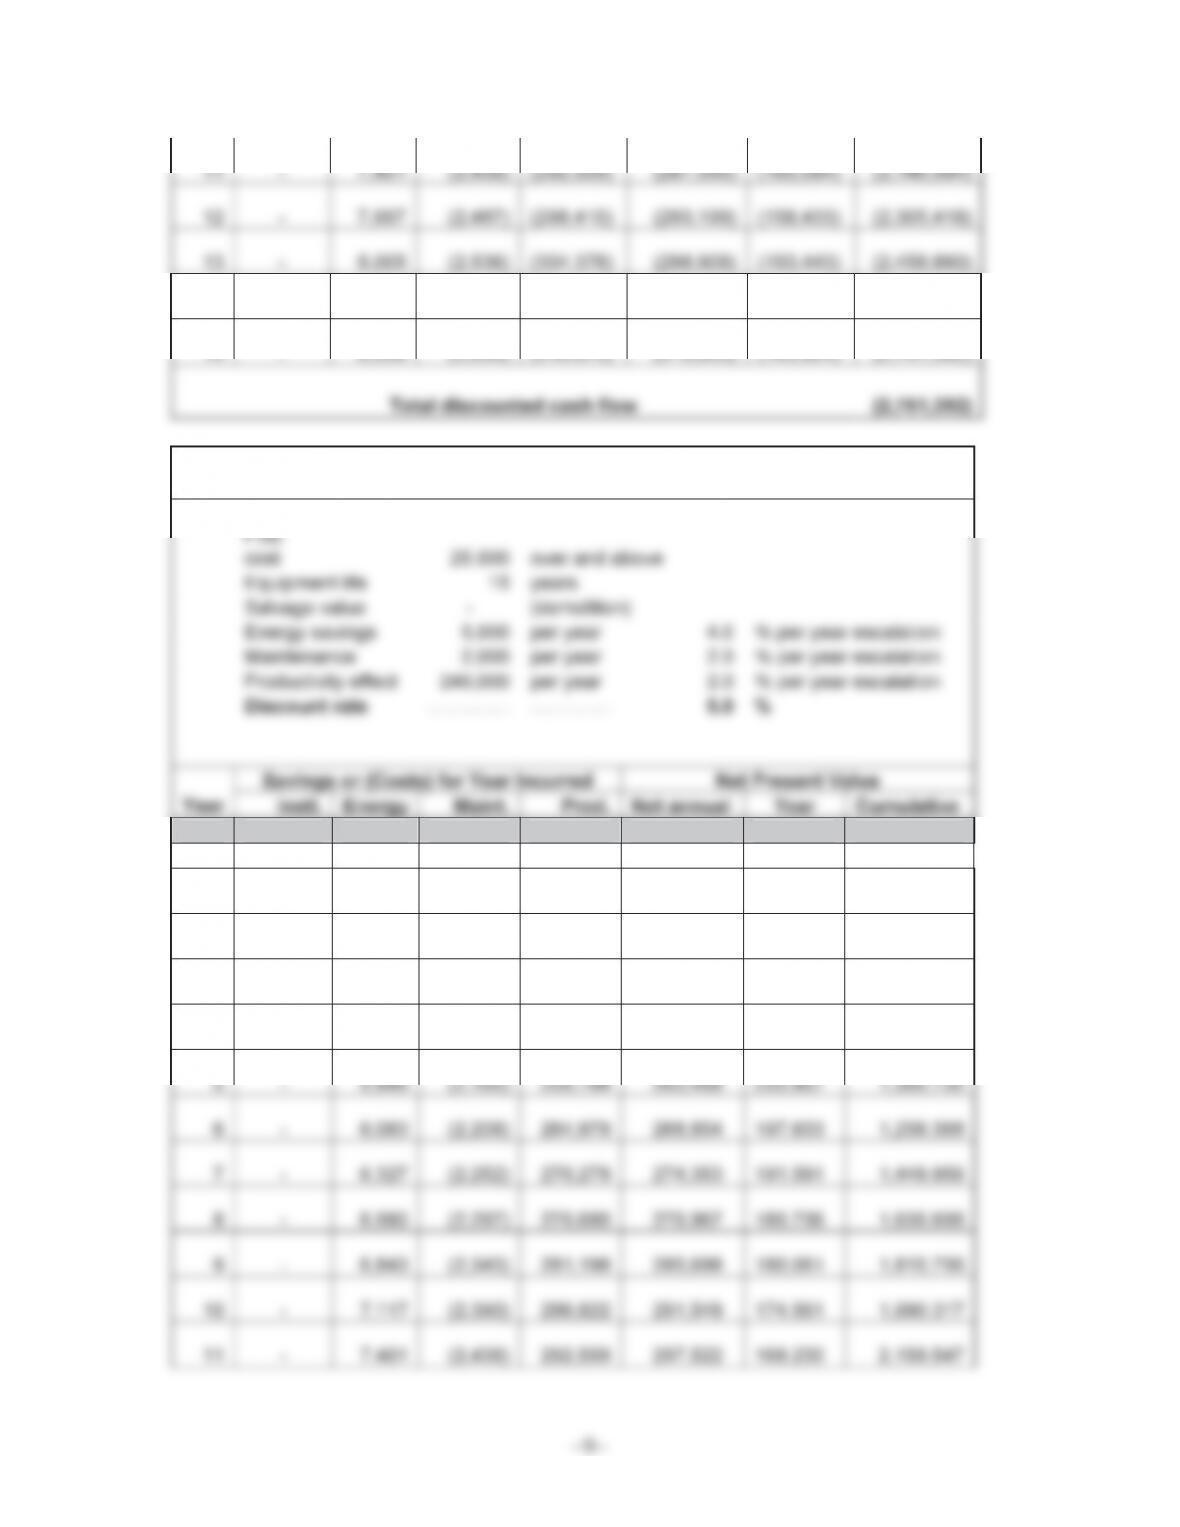
Cash Flow Analysis for a $25,000 Feature, 5% Discount Rate
Hamper Productivity 2%
First
cost 25,000 over and above
Equipment life 15 years
Salvage value – (demolition)
Savings or (Costs) for Year Incurred Net Present Value
Year Instl. Energy Maint. Prod. Net annual Year Cumulative
0 (25,000) – – – (25,000) (25,000) (25,000)
1 – 5,000 (2,000) (240,000) (237,000) (225,150) (250,150)
4 – 5,624 (2,122) (254,690) (251,188) (204,594) (884,055)
9
11 – 7,401 (2,438) (292,559) (287,595) (163,584) (2,146,984)
12 – 7,697 (2,487) (298,410) (293,199) (158,433) (2,305,418)
13 – 8,005 (2,536) (304,378) (298,909) (153,443) (2,458,860)
14 – 8,325 (2,587) (310,466) (304,727) (148,608) (2,607,468)
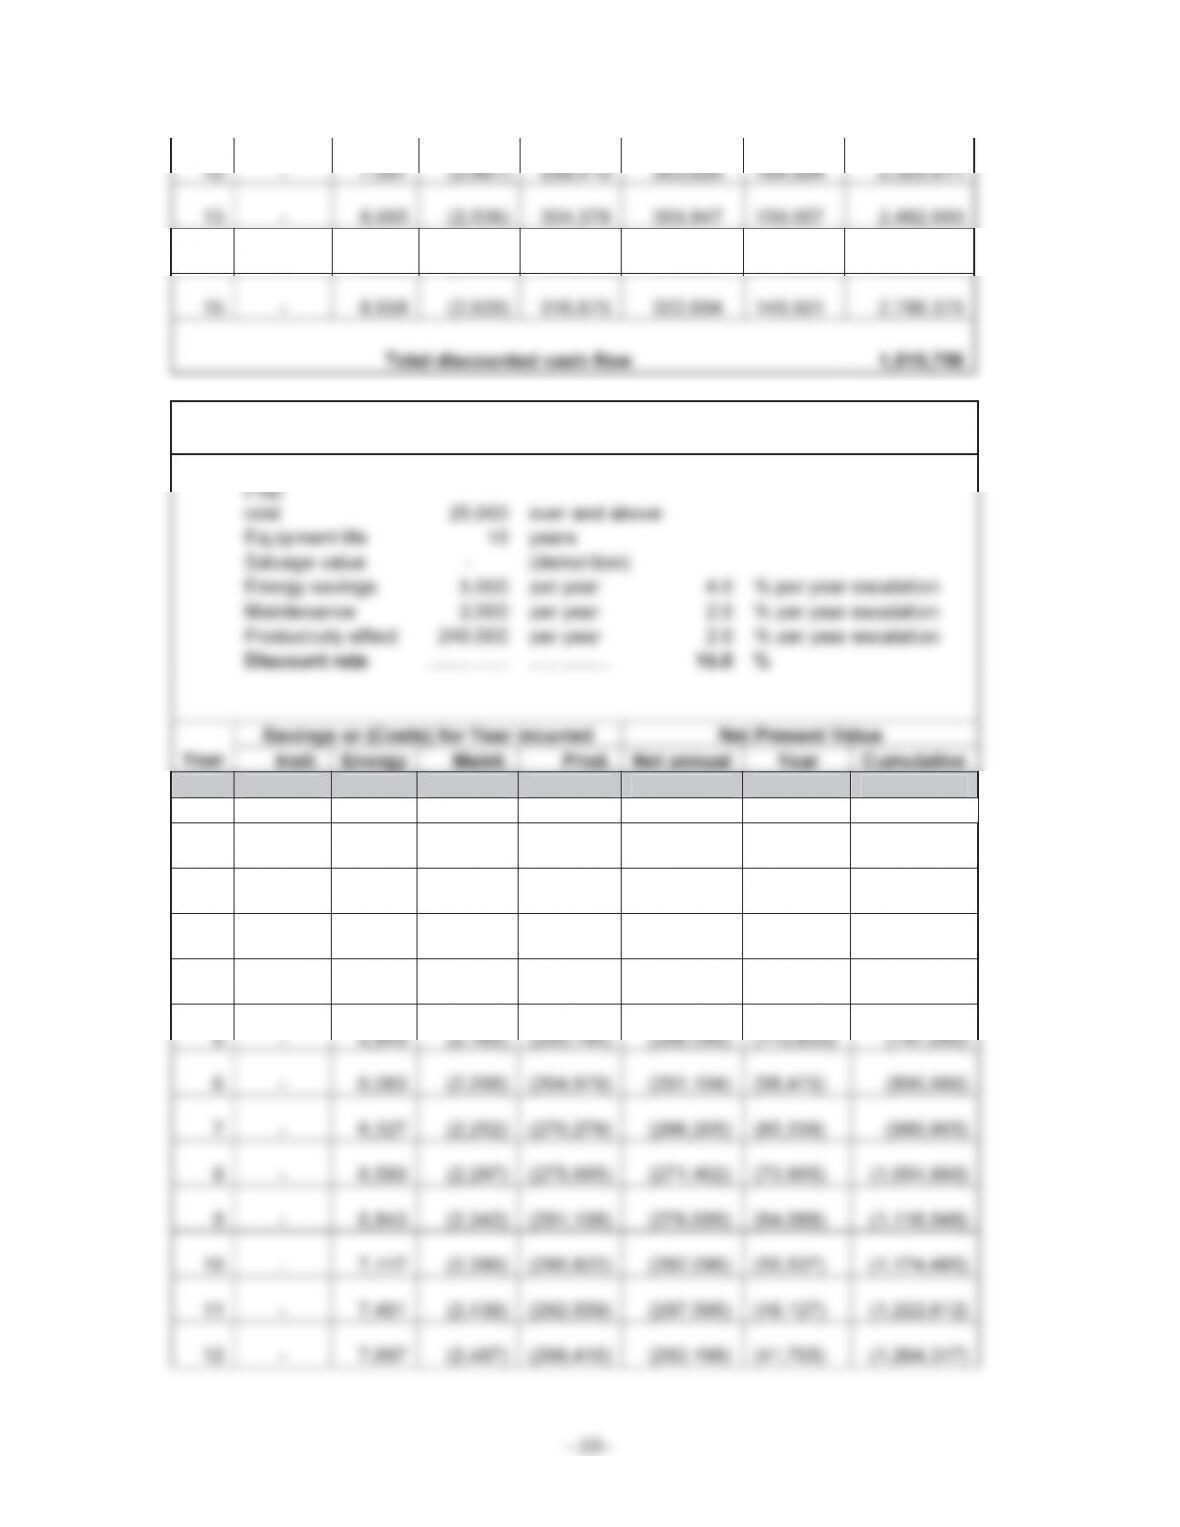
Cash Flow Analysis for a $25,000 Feature, 5% Discount Rate
Improve Productivity 2%
0 (25,000) – – – (25,000) (25,000) (25,000)
1 – 5,000 (2,000) 240,000 243,000 230,850 205,850
2 – 5,200 (2,040) 244,800 247,960 223,784 429,634
3 – 5,408 (2,081) 249,696 253,023 216,936 646,570
4 – 5,624 (2,122) 254,690 258,192 210,299 856,869
10
12 – 7,697 (2,487) 298,410 303,620 164,064 2,323,611
13 – 8,005 (2,536) 304,378 309,847 159,057 2,482,669
14 – 8,325 (2,587) 310,466 316,204 154,205 2,636,873
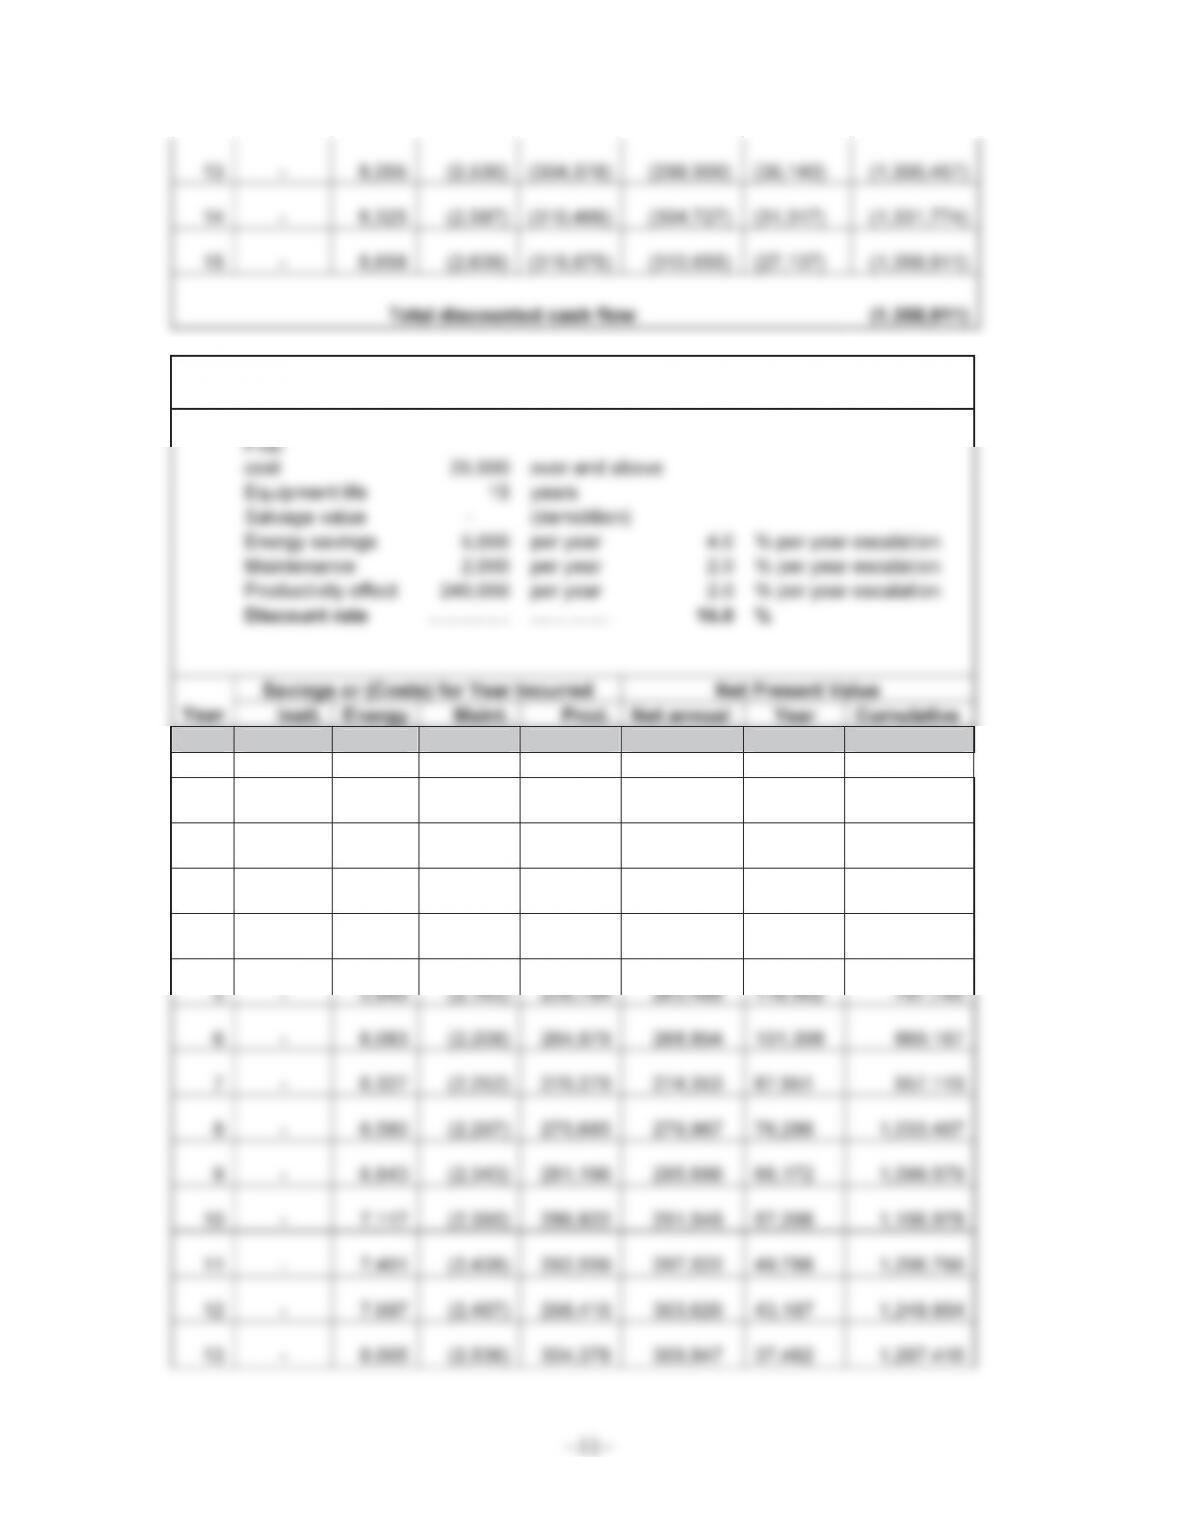
Cash Flow Analysis for a $25,000 Feature, 15% Discount Rate
Hamper Productivity 2%
0 (25,000) – – – (25,000) (25,000) (25,000)
1 – 5,000 (2,000) (240,000) (237,000) (201,450) (226,450)
2 – 5,200 (2,040) (244,800) (241,640) (174,585) (401,035)
3 – 5,408 (2,081) (249,696) (246,369) (151,301) (552,336)
4 – 5,624 (2,122) (254,690) (251,188) (131,122) (683,458)
11
13 – 8,005 (2,536) (304,378) (298,909) (36,140) (1,300,457)
14 – 8,325 (2,587) (310,466) (304,727) (31,317) (1,331,774)
15 – 8,658 (2,639) (316,675) (310,655) (27,137) (1,358,911)
Total discounted cash flow (1,358,911)
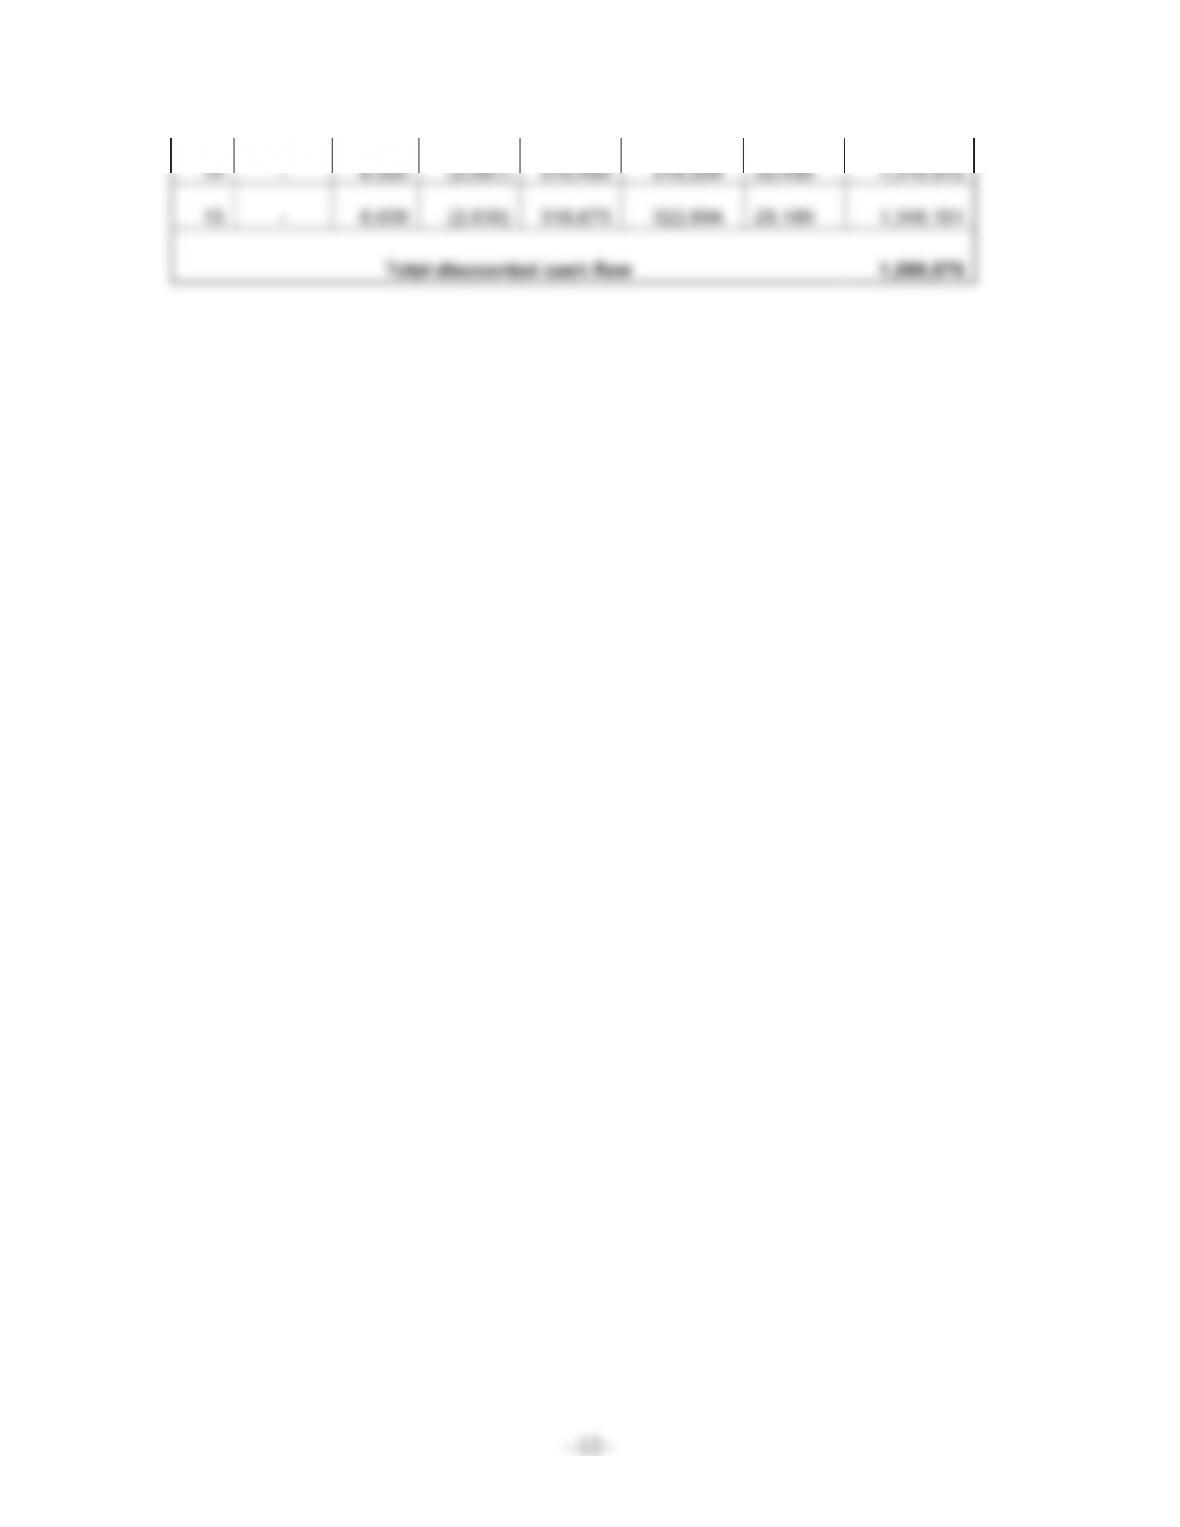
Cash Flow Analysis for a $25,000 Feature, 15% Discount Rate
Improve Productivity 2%
0 (25,000) – – – (25,000) (25,000) (25,000)
1 – 5,000 (2,000) 240,000 243,000 206,550 181,550
2 – 5,200 (2,040) 244,800 247,960 179,151 360,701
3 – 5,408 (2,081) 249,696 253,023 155,388 516,089
4 – 5,624 (2,122) 254,690 258,192 134,778 650,867
12
14 – 8,325 (2,587) 310,466 316,204 32,496 1,319,912
15 – 8,658 (2,639) 316,675 322,694 28,189 1,348,101
Total discounted cash flow 1,099,579