Problem 12-35
Inventory Quantity Discount Model
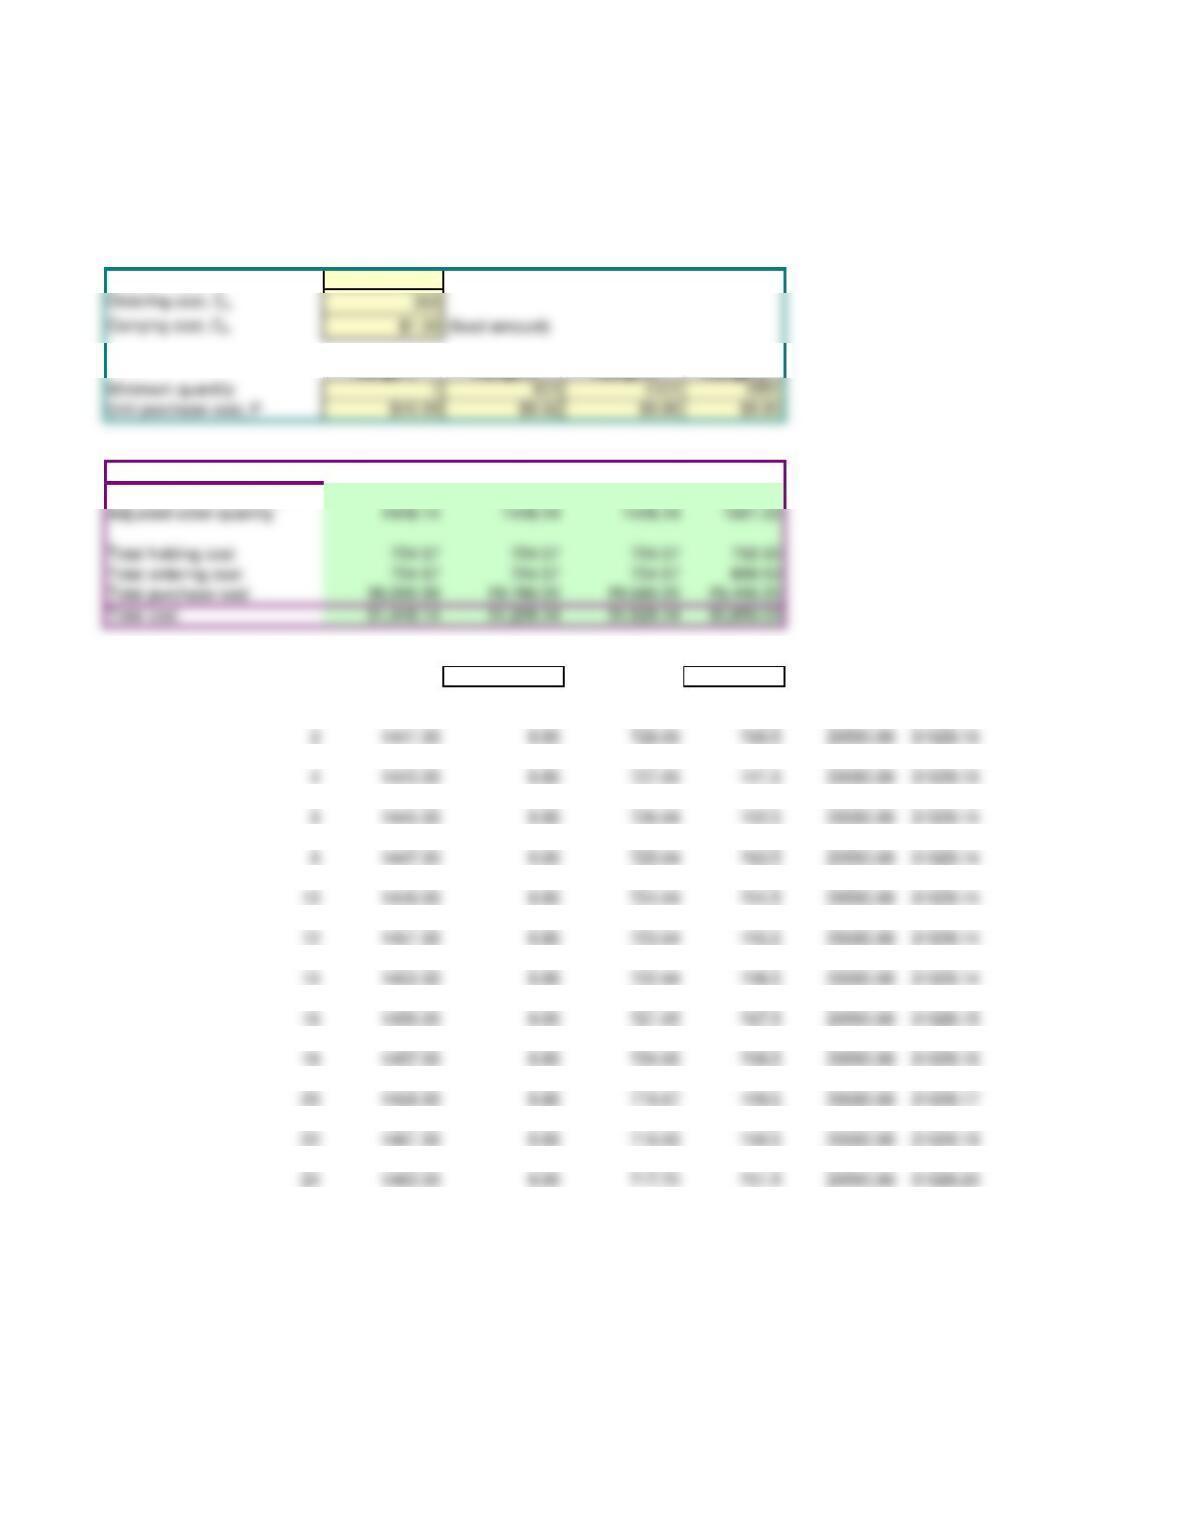
Input Data
Demand rate, D 3000
Range 1 Range 2 Range 3 Range 4
Results
Range 1 Range 2 Range 3 Range 4
Economic order quantity, Q* 1449.14 1449.14 1449.14 1449.14
Cost Table for Graph Start at 1440.00 Increment by 1.00
Q Unit cost Setup cost Holding cost Total unit cost Total Cost
1 1440.00 9.86 729.17 720 29580.00 31029.17
3 1442.00 9.86 728.16 721 29580.00 31029.16
5 1444.00 9.86 727.15 722 29580.00 31029.15
7 1446.00 9.86 726.14 723 29580.00 31029.14
9 1448.00 9.86 725.14 724 29580.00 31029.14
11 1450.00 9.86 724.14 725 29580.00 31029.14
13 1452.00 9.86 723.14 726 29580.00 31029.14
15 1454.00 9.86 722.15 727 29580.00 31029.15
17 1456.00 9.86 721.15 728 29580.00 31029.15
19 1458.00 9.86 720.16 729 29580.00 31029.16
21 1460.00 9.86 719.18 730 29580.00 31029.18
23 1462.00 9.86 718.19 731 29580.00 31029.19