Problem 12-34
Inventory Quantity Discount Model Discount at 200 = (10)x($9.90) + (1/1000)x($3,000)
= $102.00
Discount per can = $0.51
Input Data Discount at 300 = (30)x($9.90) + (1/1000)x($3,000)
Demand rate, D 1000 = $300.00
Discount at 300 = (30)x($9.90) + (1/1000)x($3,000) + (1/800)x($5,000)
Range 1 Range 2 Range 3 Range 4 = $405.25
Minimum quantity 100 200 300 400 Discount per can = $1.01
Results
Range 1 Range 2 Range 3 Range 4
Economic order quantity, Q* 141.42 141.42 141.42 141.42
Adjusted order quantity 141.42 200.00 300.00 400.00
Total holding cost 70.71 100.00 150.00 200.00
Total ordering cost 70.71 50.00 33.33 25.00
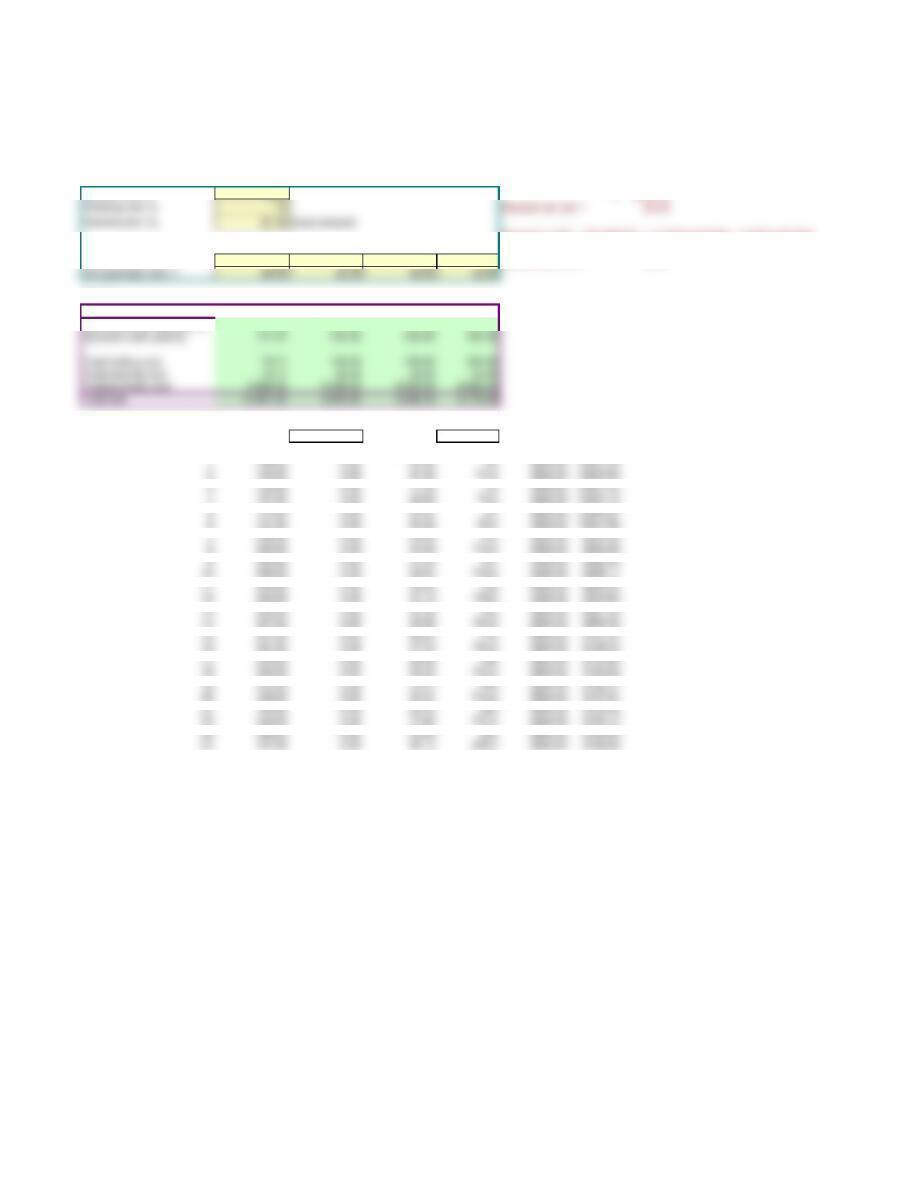
Cost Table for Graph Start at 106.00 Increment by 17.00
Q Unit cost Setup cost Holding cost Total unit cost Total Cost
8600.00
9000.00
9400.00
9800.00
10200.00
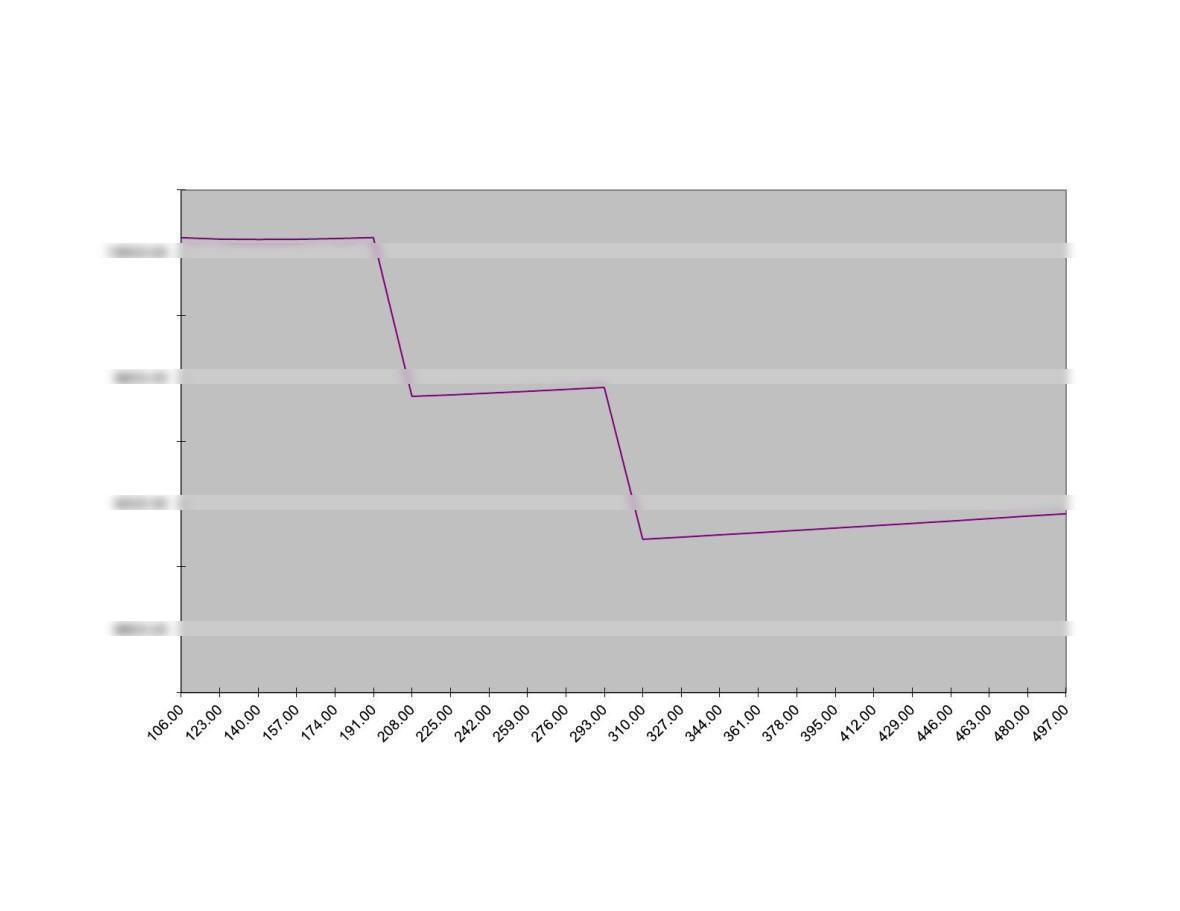
Cost
Quantity
Total Cost vs Order Quantity