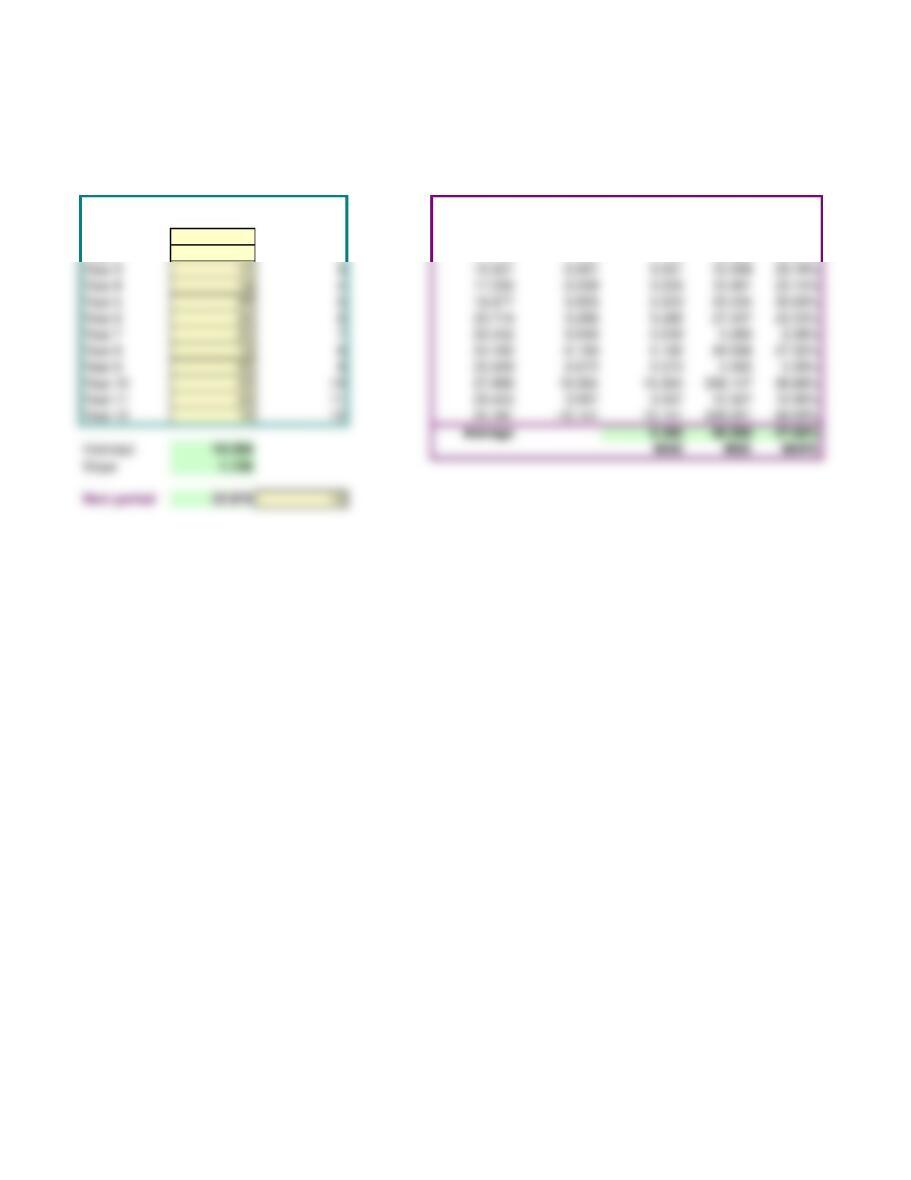
Forecasting Linear trend analysis
Input Data Forecast Error Analysis
Period
Actual value
(or) Y
Period number
(or) X
Forecast Error
Absolute
error
Squared
error
Absolute
% error
Year 1 14 1 12.026 1.974 1.974 3.898 14.10%
Year 2 9 2 13.763 -4.763 4.763 22.690 52.93%
Problem 11-26 (a)
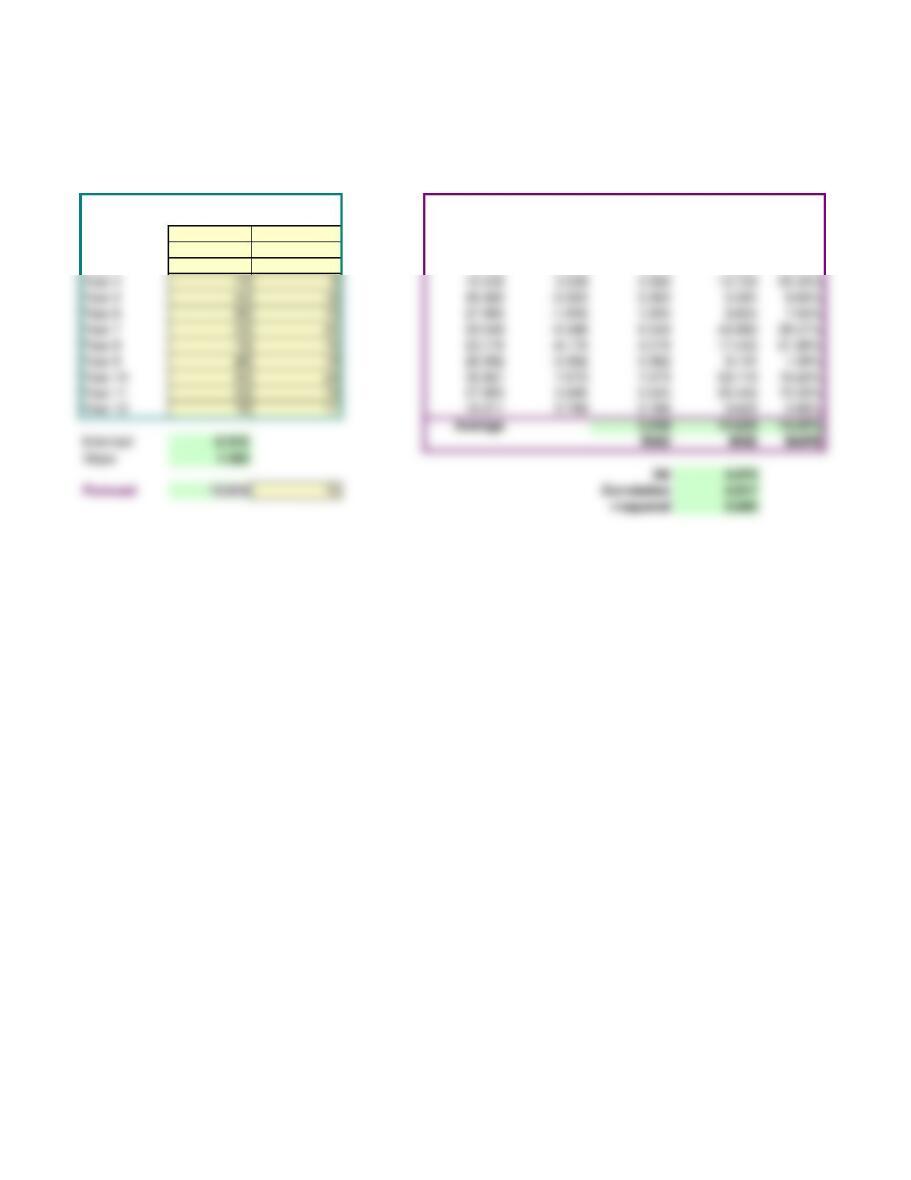
Forecasting Causal regression analysis
Input Data Forecast Error Analysis
Period
Dep Variable
(or) (Y)
Indep Variable
(or) (X)
Forecast Error
Absolute
error
Squared error
Absolute
% error
Year 1 14 11 15.211 -1.211 1.211 1.467 8.65%
Year 2 9 6 7.246 1.754 1.754 3.076 19.49%
Year 3 12 10 13.618 -1.618 1.618 2.619 13.49%
Problem 11-26 (b)
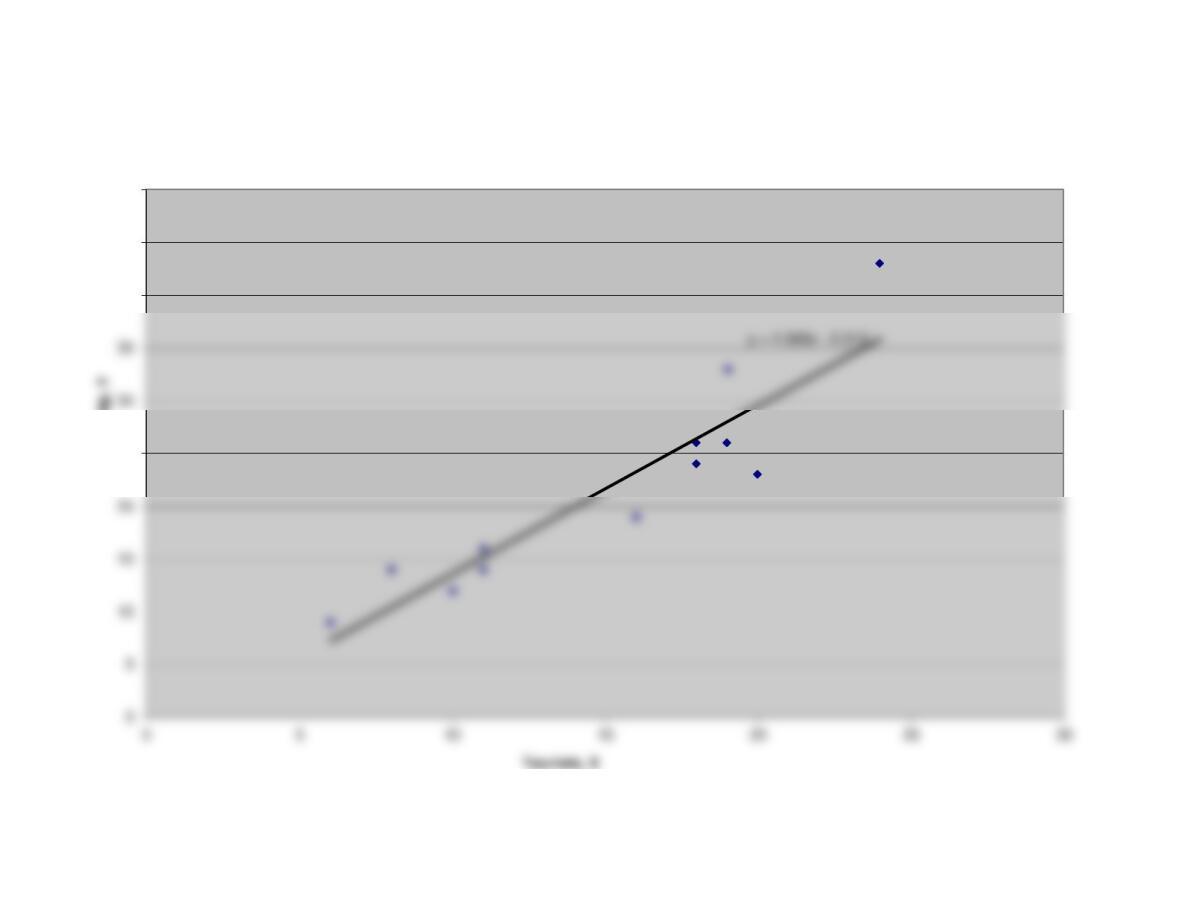
25
40
45
50
Ridership, Y
Regression Line
0
5
20
25
40
45
50
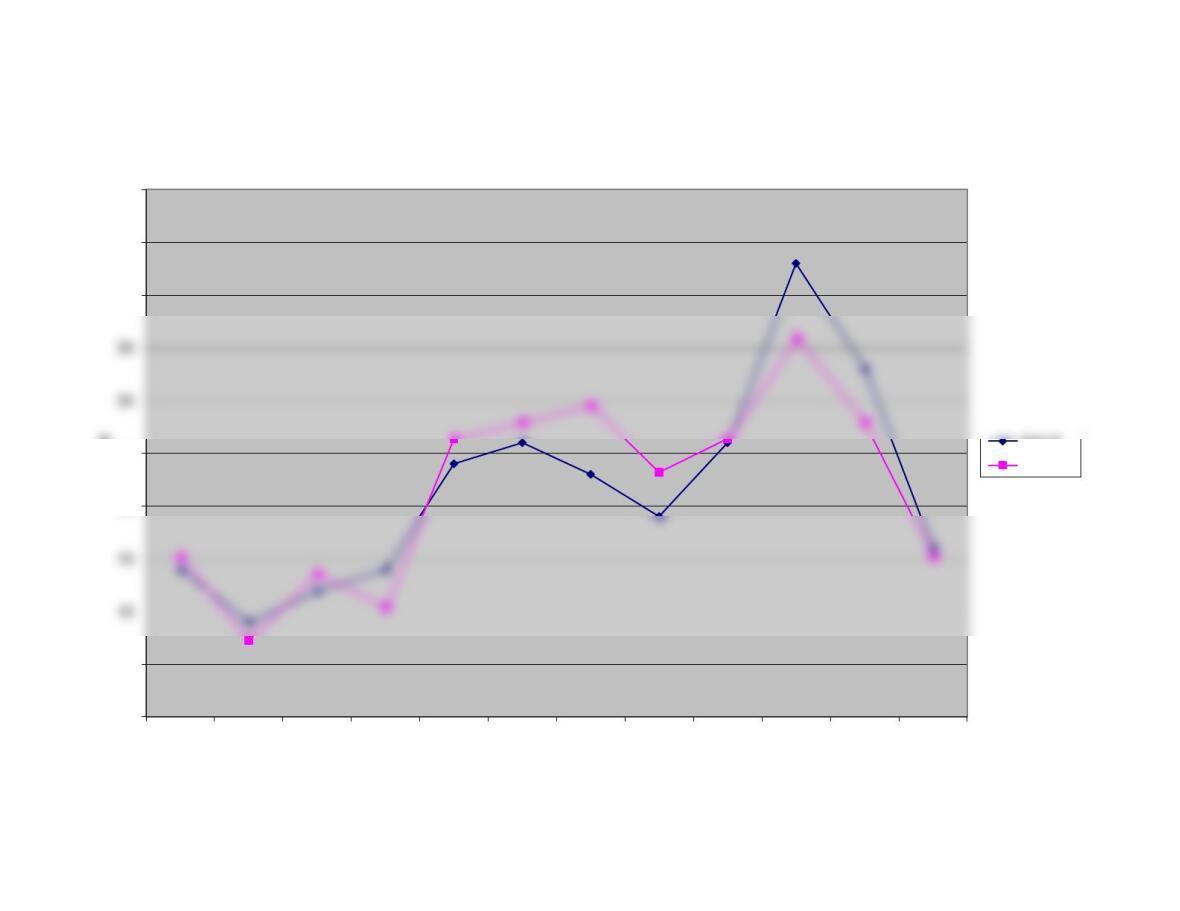
Year 1 Year 2 Year 3 Year 4 Year 5 Year 6 Year 7 Year 8 Year 9 Year 10 Year 11 Year 12
Value
Period
Actual vs. Forecast
Actual
Forecast