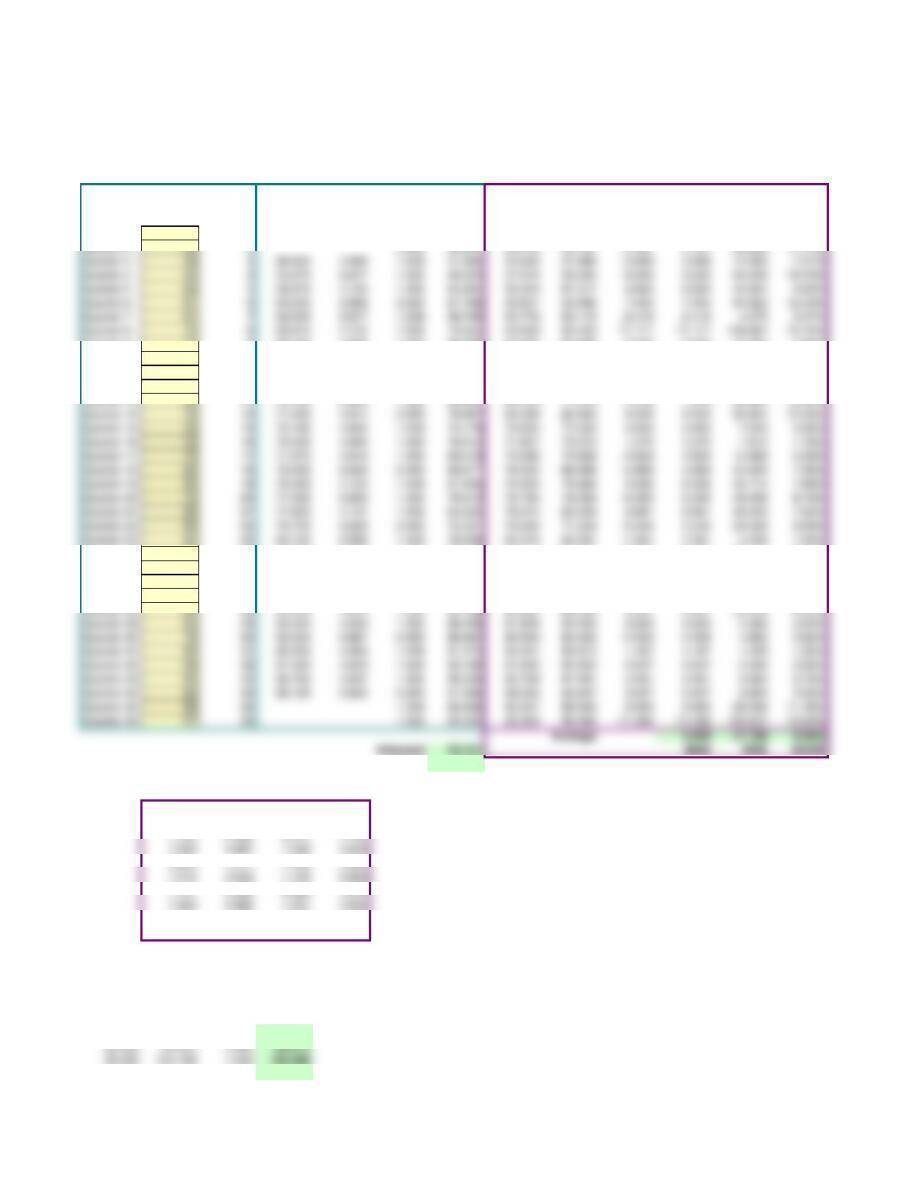
Forecasting Multiplicative decomposition
4 seasons
Input Data Seasonal Index Computation Forecast Error analysis
Period
Actual
value (Y)
Time
period (X)
Centered
average
Seasonal
ratio
Seasonal
index
Unseason
alized
value
Unseason
alized
Forecast
Seasonali
zed
Forecast
Error
Absolute
error
Squared
error
Absolute
% error
Quarter 1 35 1 1.052 33.283 53.383 56.137 -21.137 21.137 446.754 60.39%
Quarter 9 70 9 68.125 1.028 1.052 66.566 63.236 66.498 3.502 3.502 12.267 5.00%
Quarter 10 62 10 69.125 0.897 0.900 68.877 64.467 58.030 3.970 3.970 15.759 6.40%
Quarter 11 70 11 68.250 1.026 1.039 67.401 65.699 68.232 1.768 1.768 3.127 2.53%
Quarter 12 74 12 68.750 1.076 1.020 72.573 66.930 68.246 5.754 5.754 33.105 7.78%
Quarter 24 92 24 85.500 1.076 1.020 90.226 81.710 83.316 8.684 8.684 75.411 9.44%
Quarter 25 96 25 88.625 1.083 1.052 91.291 82.941 87.220 8.780 8.780 77.094 9.15%
Quarter 26 78 26 90.500 0.862 0.900 86.652 84.173 75.768 2.232 2.232 4.981 2.86%
Quarter 27 95 27 90.375 1.051 1.039 91.473 85.404 88.697 6.303 6.303 39.727 6.63%
Slope 1.232
Seasonal Ratios
Season 1 Season 2 Season 3 Season 4
1.088 0.877
1.033 0.867 1.053 1.033
1.047 0.920
Average 1.052 0.900 1.039 1.020
Forecasts for future periods
Period
Unseason
alized
forecast
Seasonal
index
Seasonali
zed
forecast
37.000 97.720 1.052
102.761
104.046
Internet Case: Human Resources Inc. (Decomposition)
40.000 101.415 1.020
103.409

80
120
Actual vs. Forecast
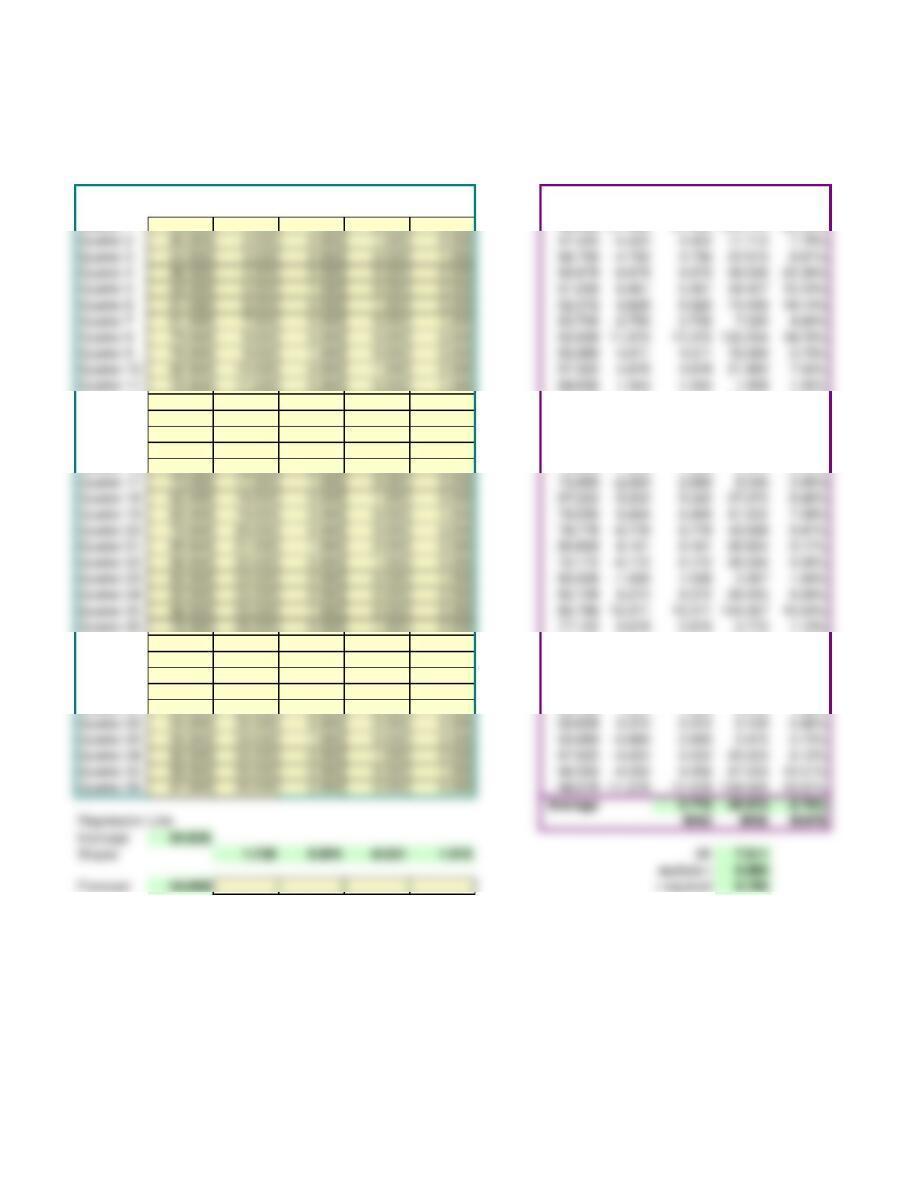
Forecasting Multiple regression
Input Data Forecasts and Error Analysis
Y x 1 x 2 x 3 x 4
Forecast Error
Absolute
error
Squared
error
Absolute
% error
Quarter 1 35.000 1.000 1.000 0.000 0.000 56.089 -21.089 21.089 444.741 60.25%
Quarter 12 74.000 12.000 0.000 0.000 0.000 68.878 5.122 5.122 26.237 6.92%
Quarter 13 64.000 13.000 1.000 0.000 0.000 70.939 -6.939 6.939 48.148 10.84%
Quarter 14 72.000 14.000 0.000 1.000 0.000 62.272 9.728 9.728 94.630 13.51%
Quarter 15 76.000 15.000 0.000 0.000 1.000 73.606 2.394 2.394 5.733 3.15%
Quarter 16 72.000 16.000 0.000 0.000 0.000 73.828 -1.828 1.828 3.341 2.54%
Quarter 27 95.000 27.000 0.000 0.000 1.000 88.456 6.544 6.544 42.830 6.89%
Quarter 28 94.000 28.000 0.000 0.000 0.000 88.678 5.322 5.322 28.326 5.66%
Quarter 29 93.000 29.000 1.000 0.000 0.000 90.739 2.261 2.261 5.113 2.43%
Quarter 30 78.000 30.000 0.000 1.000 0.000 82.072 -4.072 4.072 16.583 5.22%
Quarter 31 95.000 31.000 0.000 0.000 1.000 93.406 1.594 1.594 2.542 1.68%
Internet Case: Human Resources Inc. (Regression)
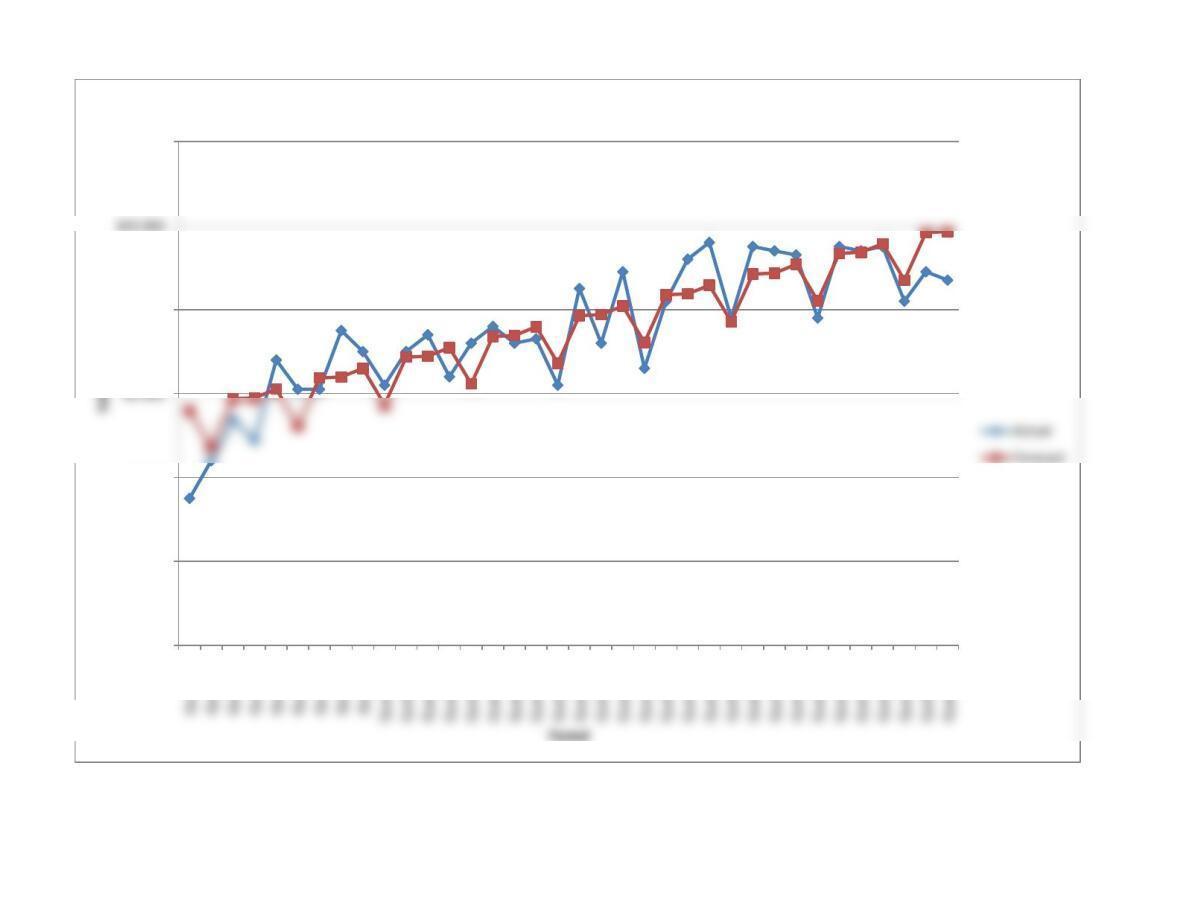
0.000
20.000
40.000
80.000
120.000
Actual vs. Forecast