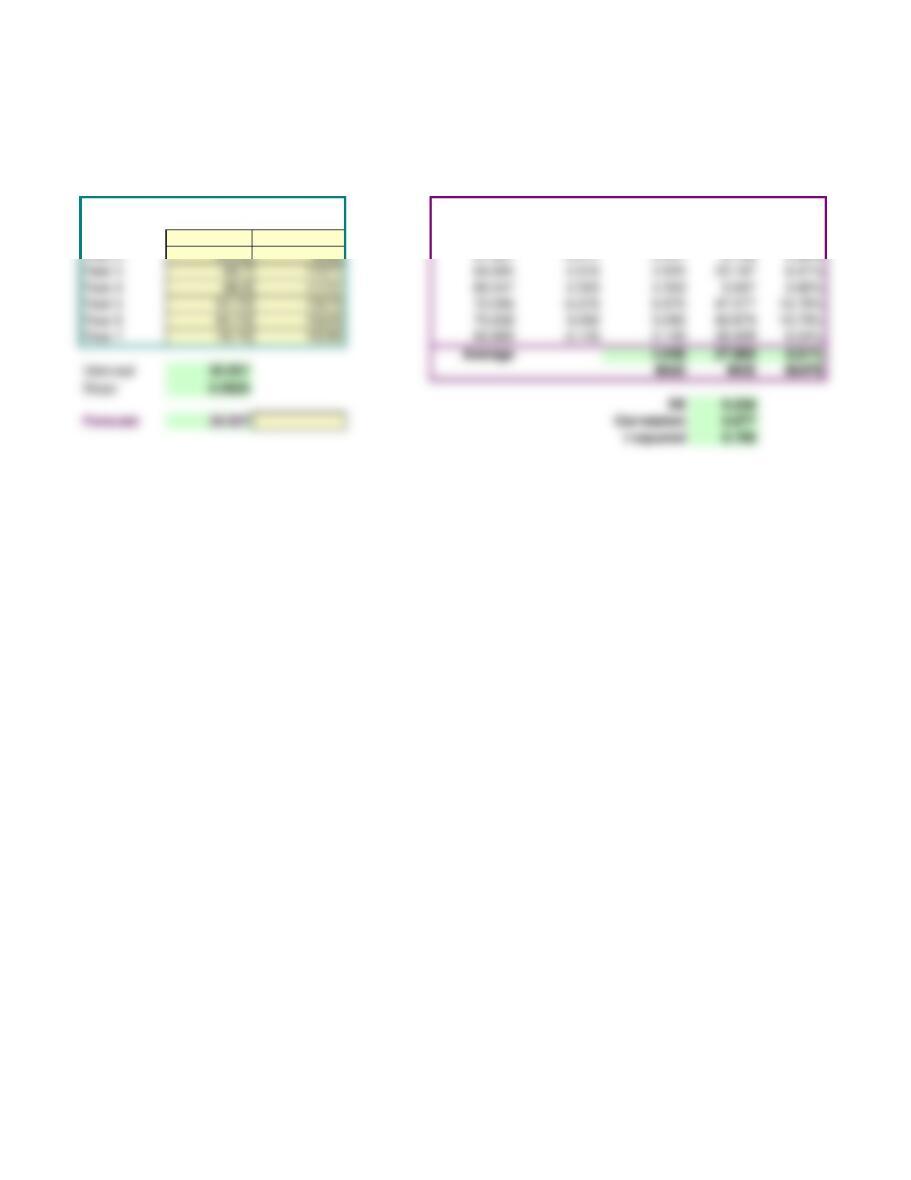
Forecasting Causal regression analysis
Input Data Forecast Error Analysis
Period
Dep Variable
(or) (Y)
Indep Variable
(or) (X)
Forecast Error
Absolute
error
Squared
error
Absolute
% error
Year 1 51.8 6512 53.020 -1.220 1.220 1.489 2.36%
North-South Airline
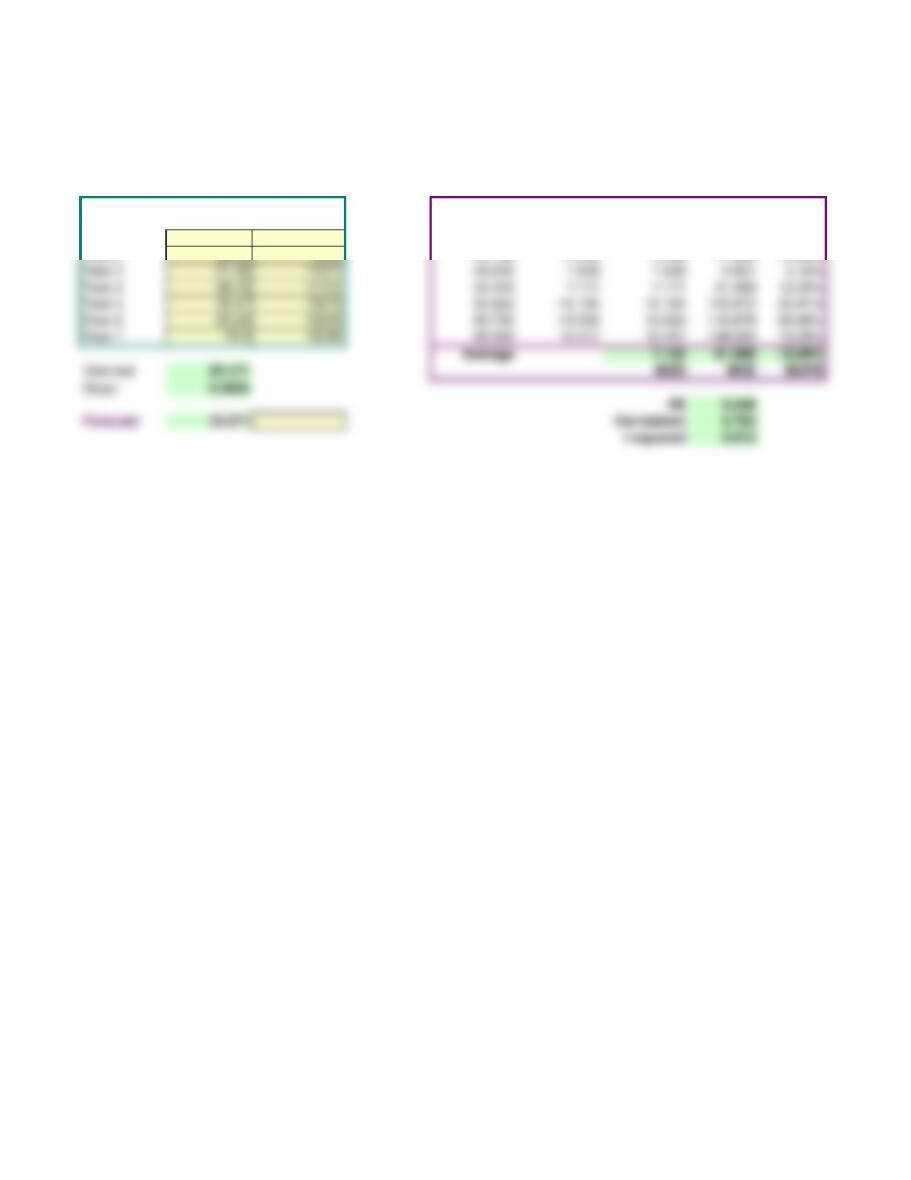
Forecasting Causal regression analysis
Input Data Forecast Error Analysis
Period
Dep Variable
(or) (Y)
Indep Variable
(or) (X)
Forecast Error
Absolute
error
Squared
error
Absolute
% error
Year 1 43.49 6512 37.785 5.705 5.705 32.550 13.12%
North-South Airline

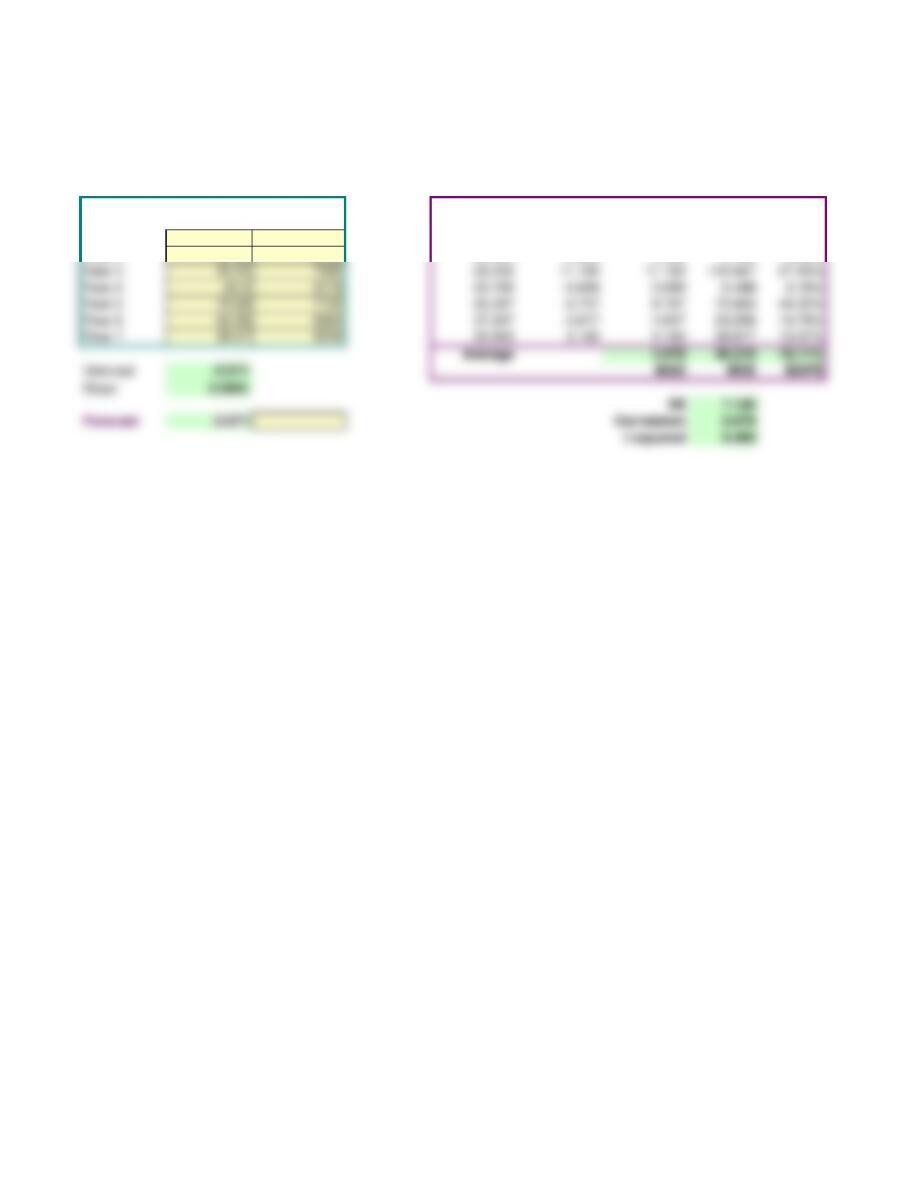
Forecasting Causal regression analysis
Input Data Forecast Error Analysis
Period
Dep Variable
(or) (Y)
Indep Variable
(or) (X)
Forecast Error
Absolute
error
Squared
error
Absolute
% error
Year 1 13.29 5107 20.959 -7.669 7.669 58.810 57.70%
Year 2 25.15 8145 30.692 -5.542 5.542 30.715 22.04%
North-South Airline
Forecasting Causal regression analysis
Input Data Forecast Error Analysis
Period
Dep Variable
(or) (Y)
Indep Variable
(or) (X)
Forecast Error
Absolute
error
Squared
error
Absolute
% error
Year 1 18.86 5107 20.091 -1.231 1.231 1.515 6.53%
Year 2 31.55 8145 32.442 -0.892 0.892 0.795 2.83%
North-South Airline
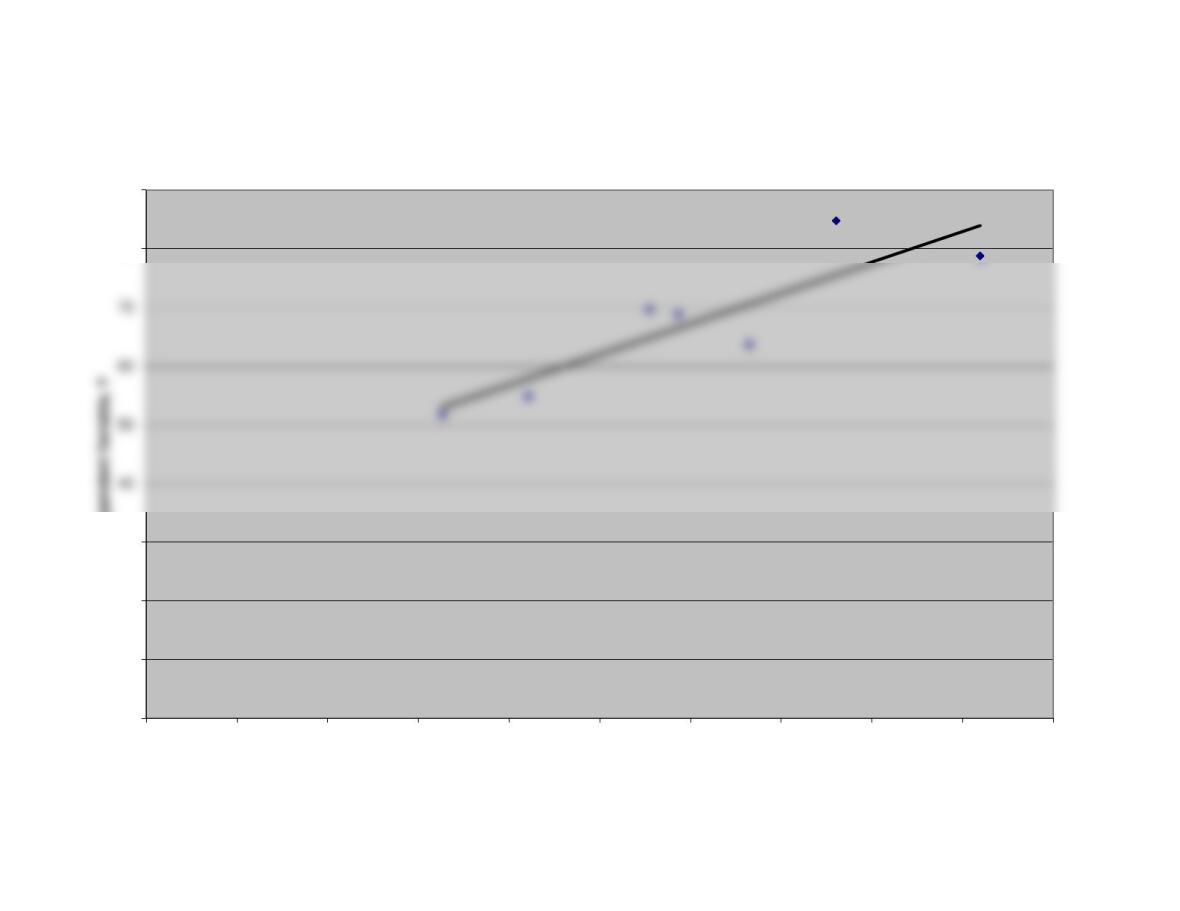
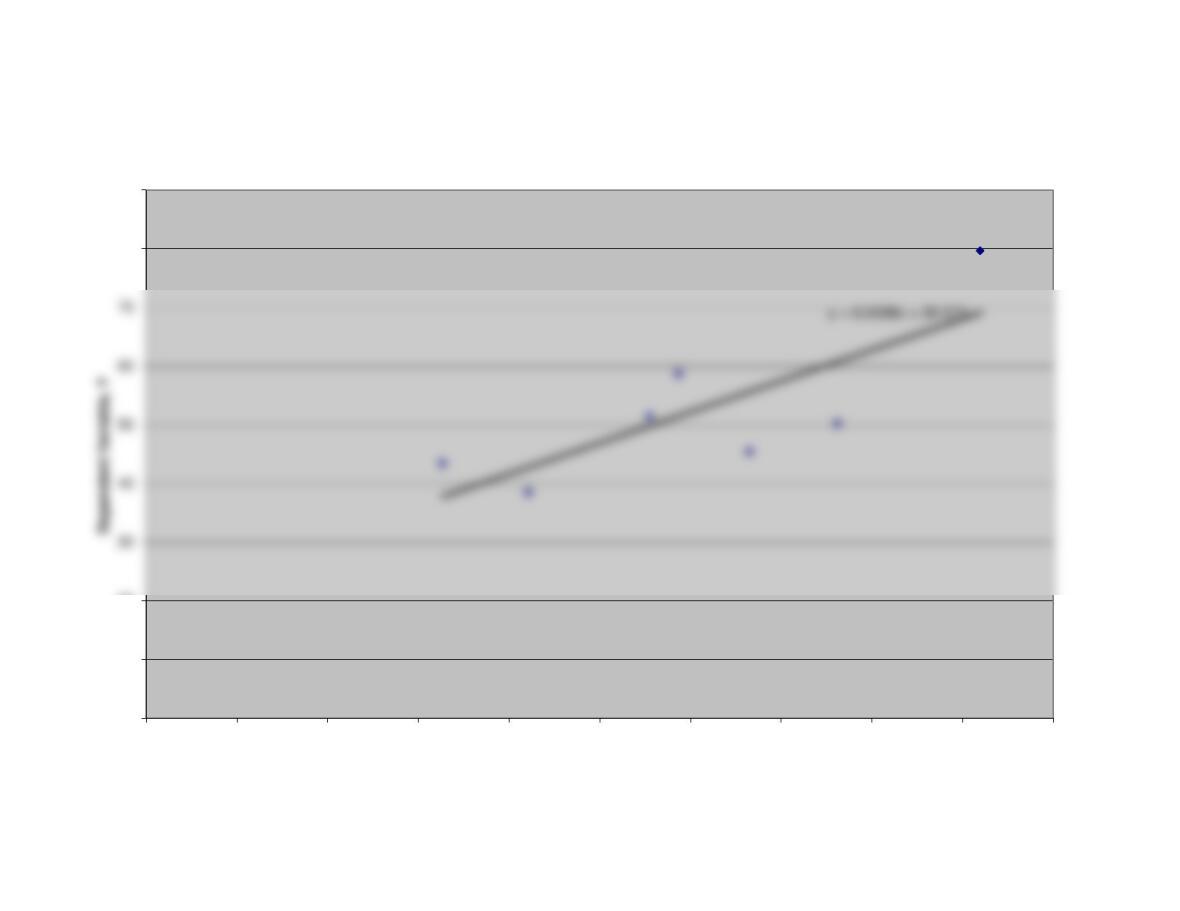
y = 0.0026x + 36.097
0
10
20
30
80
90
0 2000 4000 6000 8000 10000 12000 14000 16000 18000 20000
Dependent Variable, Y
Independent Variable, X
Regression Line
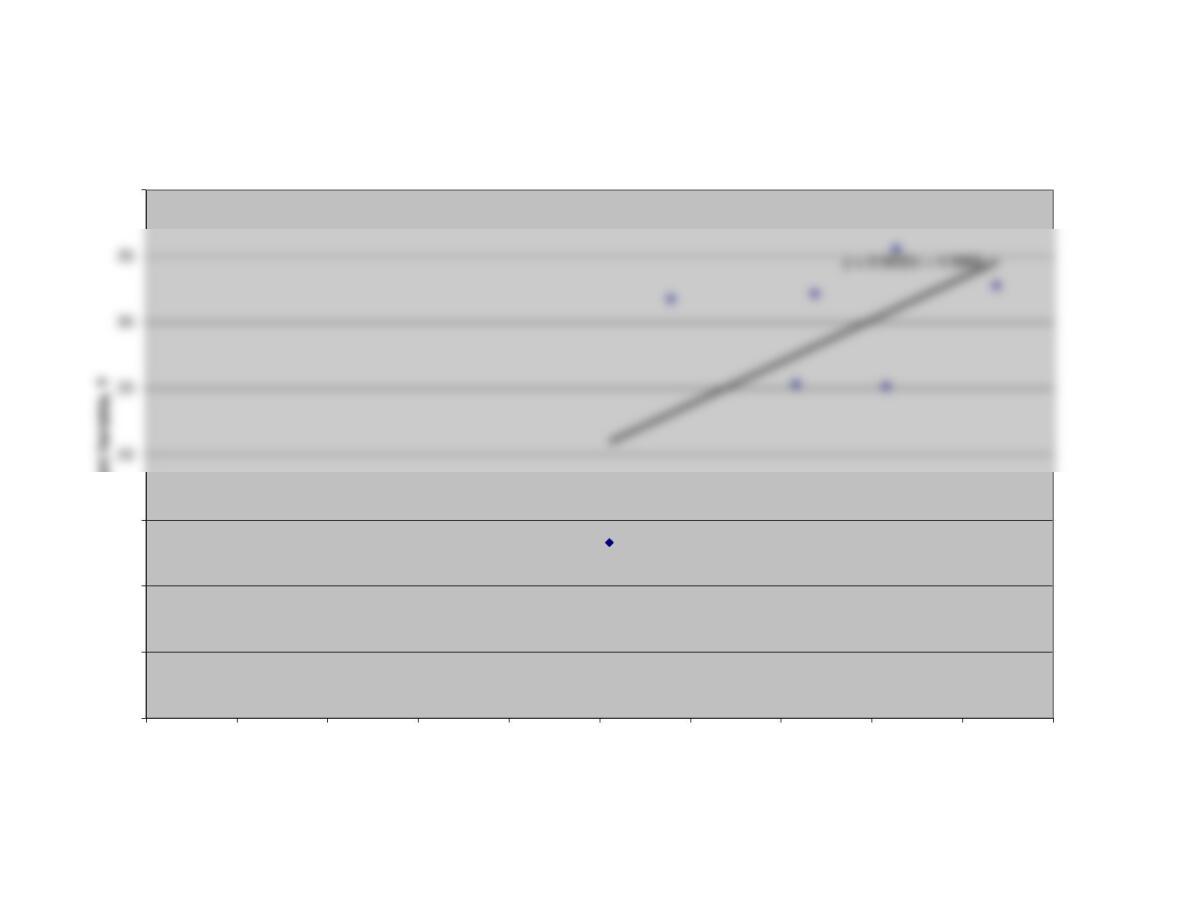
0
10
20
80
90
0 2000 4000 6000 8000 10000 12000 14000 16000 18000 20000
Independent Variable, X
Regression Line
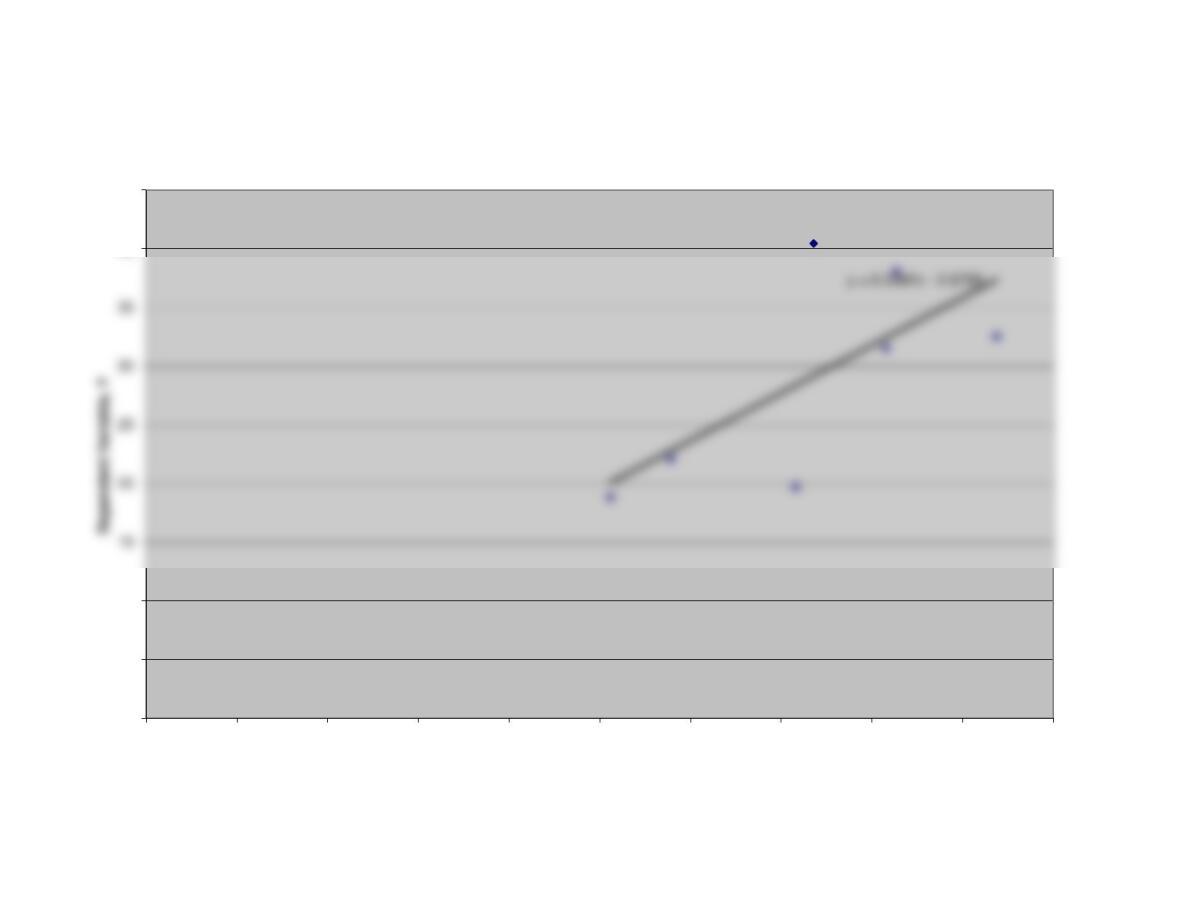
0
5
10
15
40
0 1000 2000 3000 4000 5000 6000 7000 8000 9000 10000
Dependent Variable, Y
Independent Variable, X
Regression Line
0
5
10
40
45
0 1000 2000 3000 4000 5000 6000 7000 8000 9000 10000
Independent Variable, X
Regression Line