Chapter 9 Practice Problem.xls
Amortization Table
A simple amortization table covering 300 payment periods of a loan.
1) To use the table, simply change any of the values in the “inital data” area of the worksheet.
2) To print the table, just choose “Print” from the “File” menu. The print area is already defined.
Initial Data
LOAN DATA TABLE DATA
Loan amount: $100,000,000.00 Table starts at date:
Annual interest rate: 7.00% or at payment number: 1
1st payment in table: 1 Cumulative interest prior to payment 1: 0.00
Table
Payment Beginning Ending Cumulative
No. Date Balance Interest Principal Balance Interest
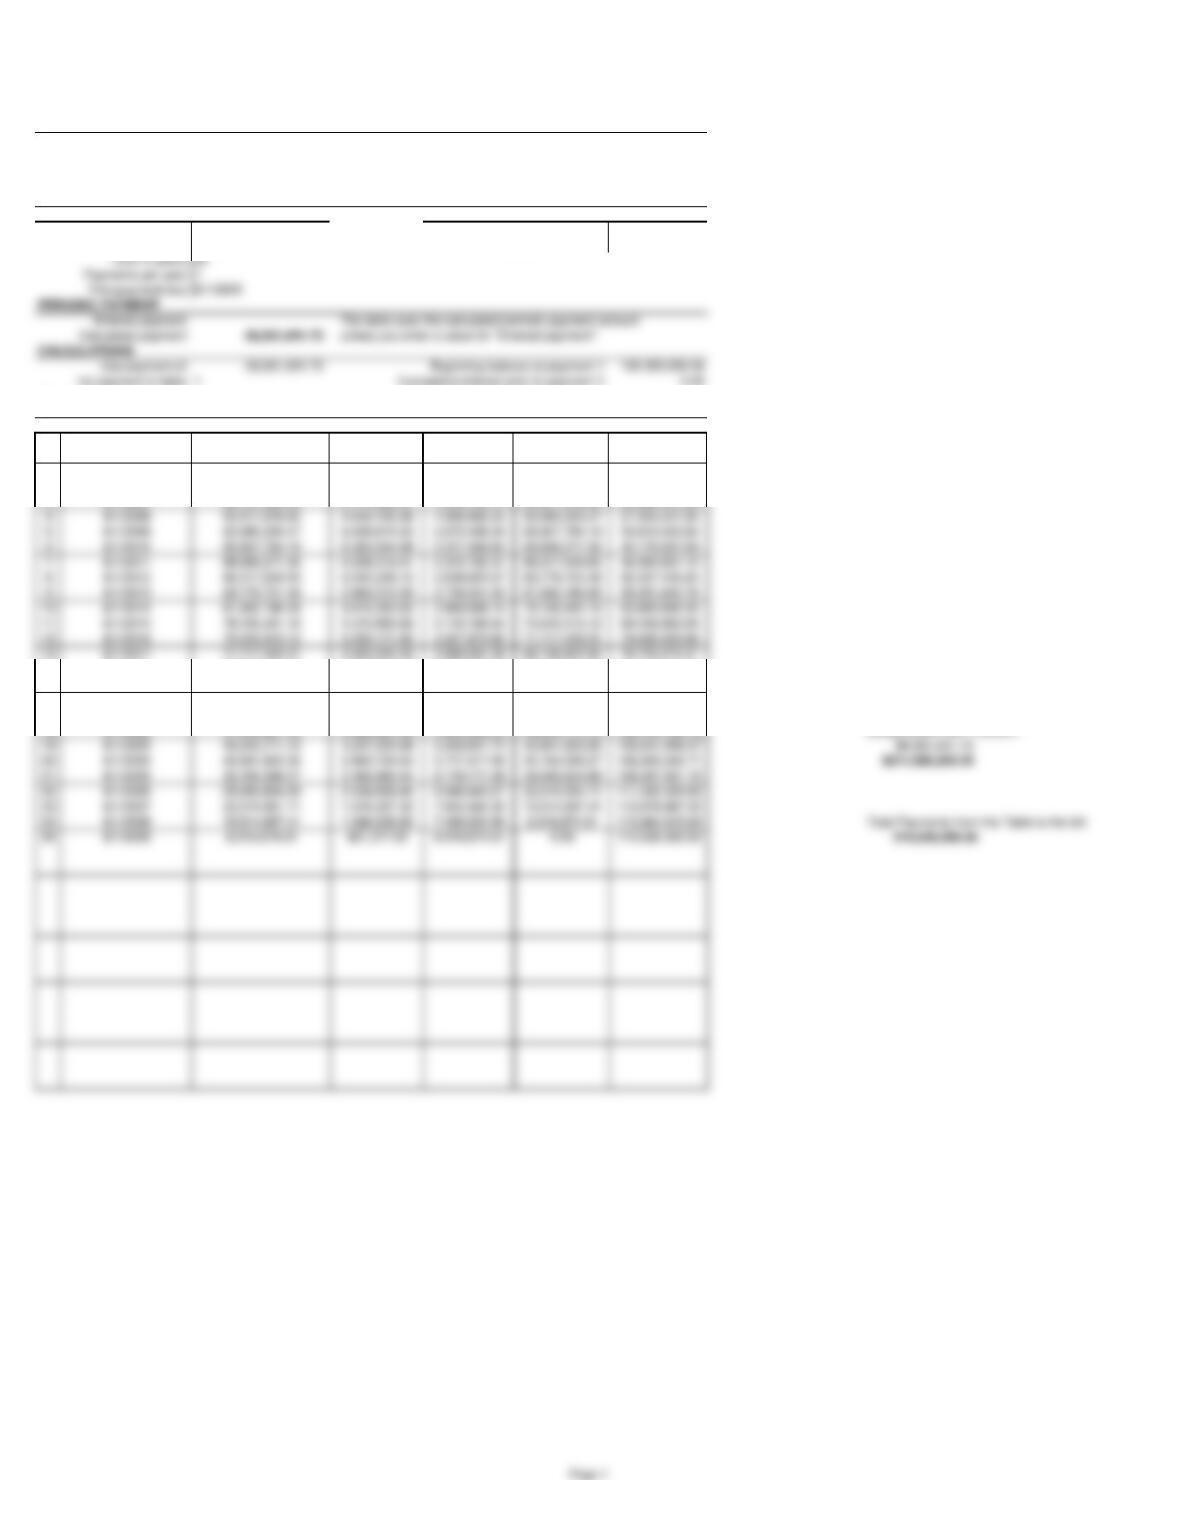
1 8/1/2005 100,000,000.00 7,000,000.00 1,581,051.72 98,418,948.28 7,000,000.00
2 8/1/2006 98,418,948.28 6,889,326.38 1,691,725.34 96,727,222.94 13,889,326.38
3 8/1/2007 96,727,222.94 6,770,905.61 1,810,146.12 94,917,076.82 20,660,231.98
14 8/1/2018 68,156,601.92 4,770,962.13 3,810,089.59 64,346,512.34 84,481,236.44
15 8/1/2019 64,346,512.34 4,504,255.86 4,076,795.86 60,269,716.48 88,985,492.31
16 8/1/2020 60,269,716.48 4,218,880.15 4,362,171.57 55,907,544.91 93,204,372.46
17 8/1/2021 55,907,544.91 3,913,528.14 4,667,523.58 51,240,021.33 97,117,900.60
18 8/1/2022 51,240,021.33 3,586,801.49 4,994,250.23 46,245,771.10 100,704,702.10 Using Excel’s PMT Function
PERIODIC PAYMENT
Chapter 9 Practice Problem.xls
Amortization Table
A simple amortization table covering 300 payment periods of a loan.
1) To use the table, simply change any of the values in the “inital data” area of the worksheet.
2) To print the table, just choose “Print” from the “File” menu. The print area is already defined.
Initial Data
LOAN DATA TABLE DATA
Loan amount: $100,000,000.00 Table starts at date:
Annual interest rate: 5.00% or at payment number: 1
Table
Payment Beginning Ending Cumulative
No. Date Balance Interest Principal Balance Interest
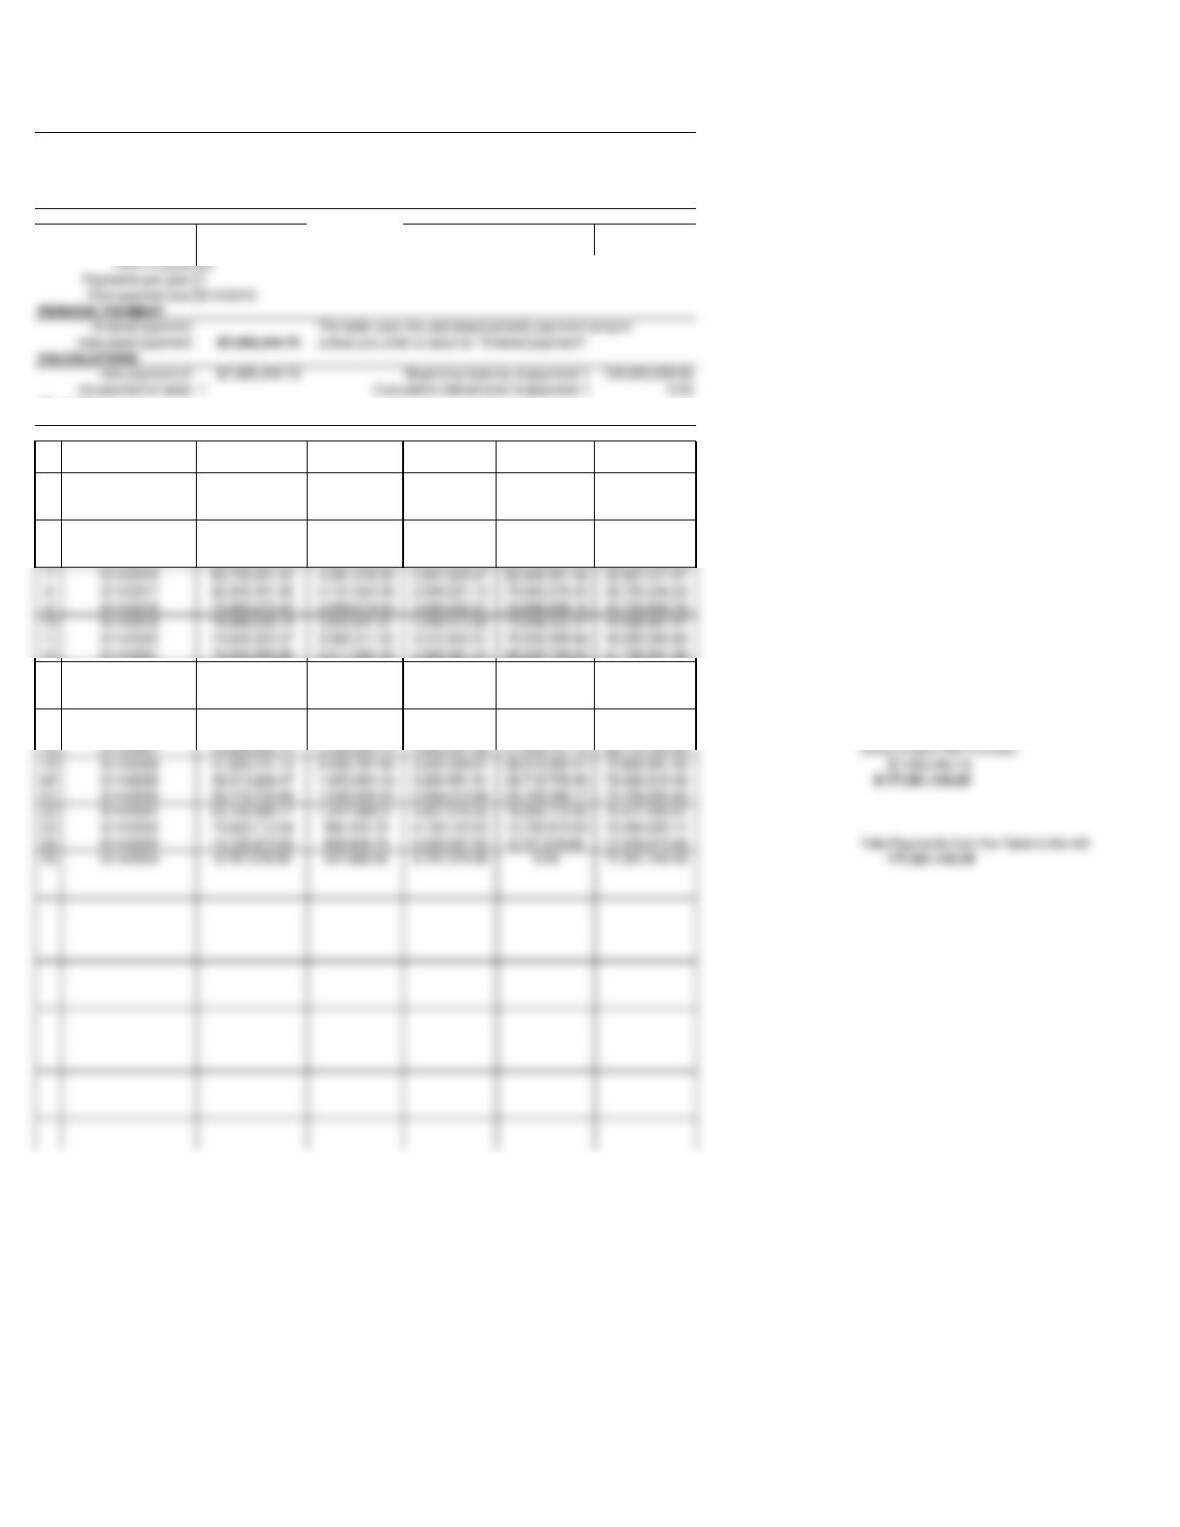
1 6/14/2010 100,000,000.00 5,000,000.00 2,095,245.73 97,904,754.27 5,000,000.00
2 6/14/2011 97,904,754.27 4,895,237.71 2,200,008.02 95,704,746.25 9,895,237.71
3 6/14/2012 95,704,746.25 4,785,237.31 2,310,008.42 93,394,737.84 14,680,475.03
4 6/14/2013 93,394,737.84 4,669,736.89 2,425,508.84 90,969,229.00 19,350,211.92
5 6/14/2014 90,969,229.00 4,548,461.45 2,546,784.28 88,422,444.72 23,898,673.37
6 6/14/2015 88,422,444.72 4,421,122.24 2,674,123.49 85,748,321.22 28,319,795.60
7 6/14/2016 85,748,321.22 4,287,416.06 2,807,829.67 82,940,491.56 32,607,211.67
8 6/14/2017 82,940,491.56 4,147,024.58 2,948,221.15 79,992,270.40 36,754,236.24
9 6/14/2018 79,992,270.40 3,999,613.52 3,095,632.21 76,896,638.19 40,753,849.76
10 6/14/2019 76,896,638.19 3,844,831.91 3,250,413.82 73,646,224.37 44,598,681.67
11 6/14/2020 73,646,224.37 3,682,311.22 3,412,934.51 70,233,289.86 48,280,992.89
12 6/14/2021 70,233,289.86 3,511,664.49 3,583,581.24 66,649,708.63 51,792,657.38
13 6/14/2022 66,649,708.63 3,332,485.43 3,762,760.30 62,886,948.33 55,125,142.82
14 6/14/2023 62,886,948.33 3,144,347.42 3,950,898.31 58,936,050.01 58,269,490.23
15 6/14/2024 58,936,050.01 2,946,802.50 4,148,443.23 54,787,606.78 61,216,292.73
16 6/14/2025 54,787,606.78 2,739,380.34 4,355,865.39 50,431,741.39 63,955,673.07
17 6/14/2026 50,431,741.39 2,521,587.07 4,573,658.66 45,858,082.73 66,477,260.14
18 6/14/2027 45,858,082.73 2,292,904.14 4,802,341.59 41,055,741.14 68,770,164.28 Using Excel‘s PMT Function
19 6/14/2028 41,055,741.14 2,052,787.06 5,042,458.67 36,013,282.47 70,822,951.34 $7,095,245.73
21 6/14/2030 30,718,700.86 1,535,935.04 5,559,310.69 25,159,390.17 74,159,550.50
22 6/14/2031 25,159,390.17 1,257,969.51 5,837,276.22 19,322,113.95 75,417,520.01
23 6/14/2032 19,322,113.95 966,105.70 6,129,140.03 13,192,973.92 76,383,625.71
24 6/14/2033 13,192,973.92 659,648.70 6,435,597.03 6,757,376.89 77,043,274.40 Total Payments from the Table to the left
Page 2
PERIODIC PAYMENT