Chapter 08 – Marketing Research: From Customer Insights to Actions
8-41
a. Frequency of fast-food restaurant patronage and restaurant characteristics
important to the customer. Question 3 is “How often do you eat at a fast-food
b. Age of the head of household and source of information used about fast-food
restaurants. Question 9d asks respondents “What is your age?” whereas Question 7
c. Frequency of patronage of Wendy’s and source of information used about fast–
food restaurants. Question 3 identifies the frequency of fast-food restaurant patronage
d. How much children have to say about where the family eats and number of
children in the household. Question 6b in the Wendy’s survey asks respondents to
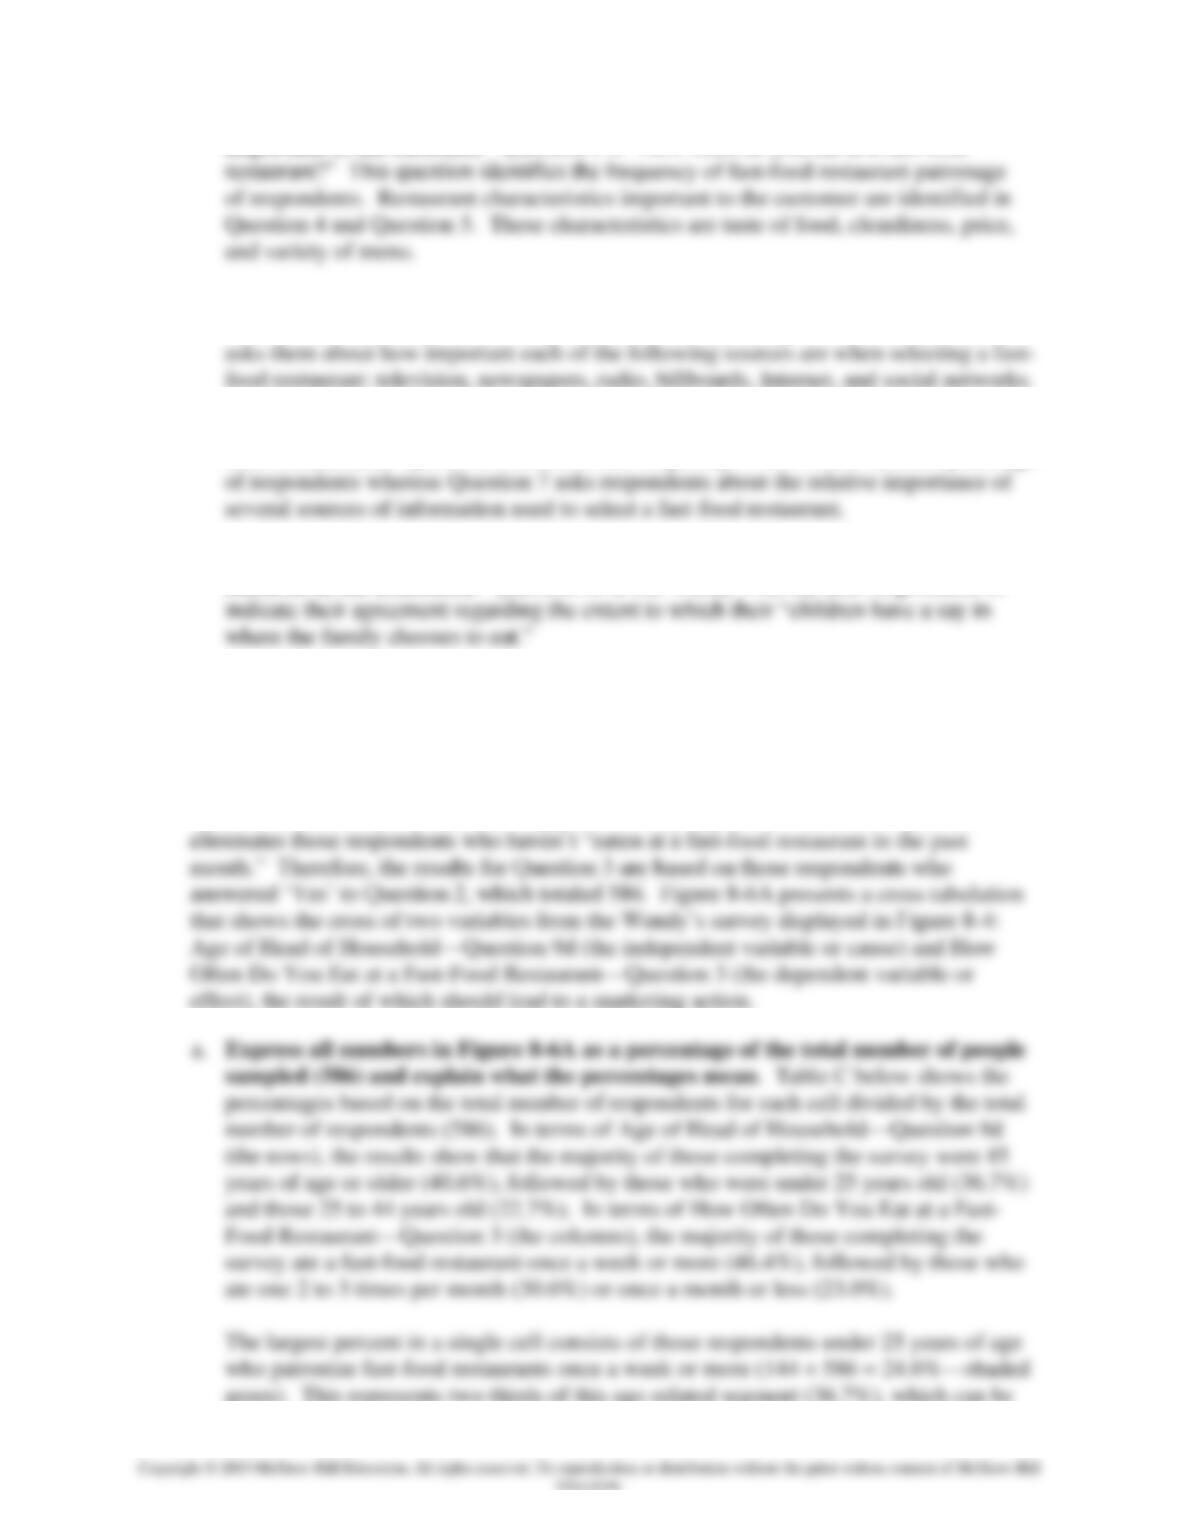
7. (a) Express all numbers in Figure 8-6A as a percentage of the total number of people
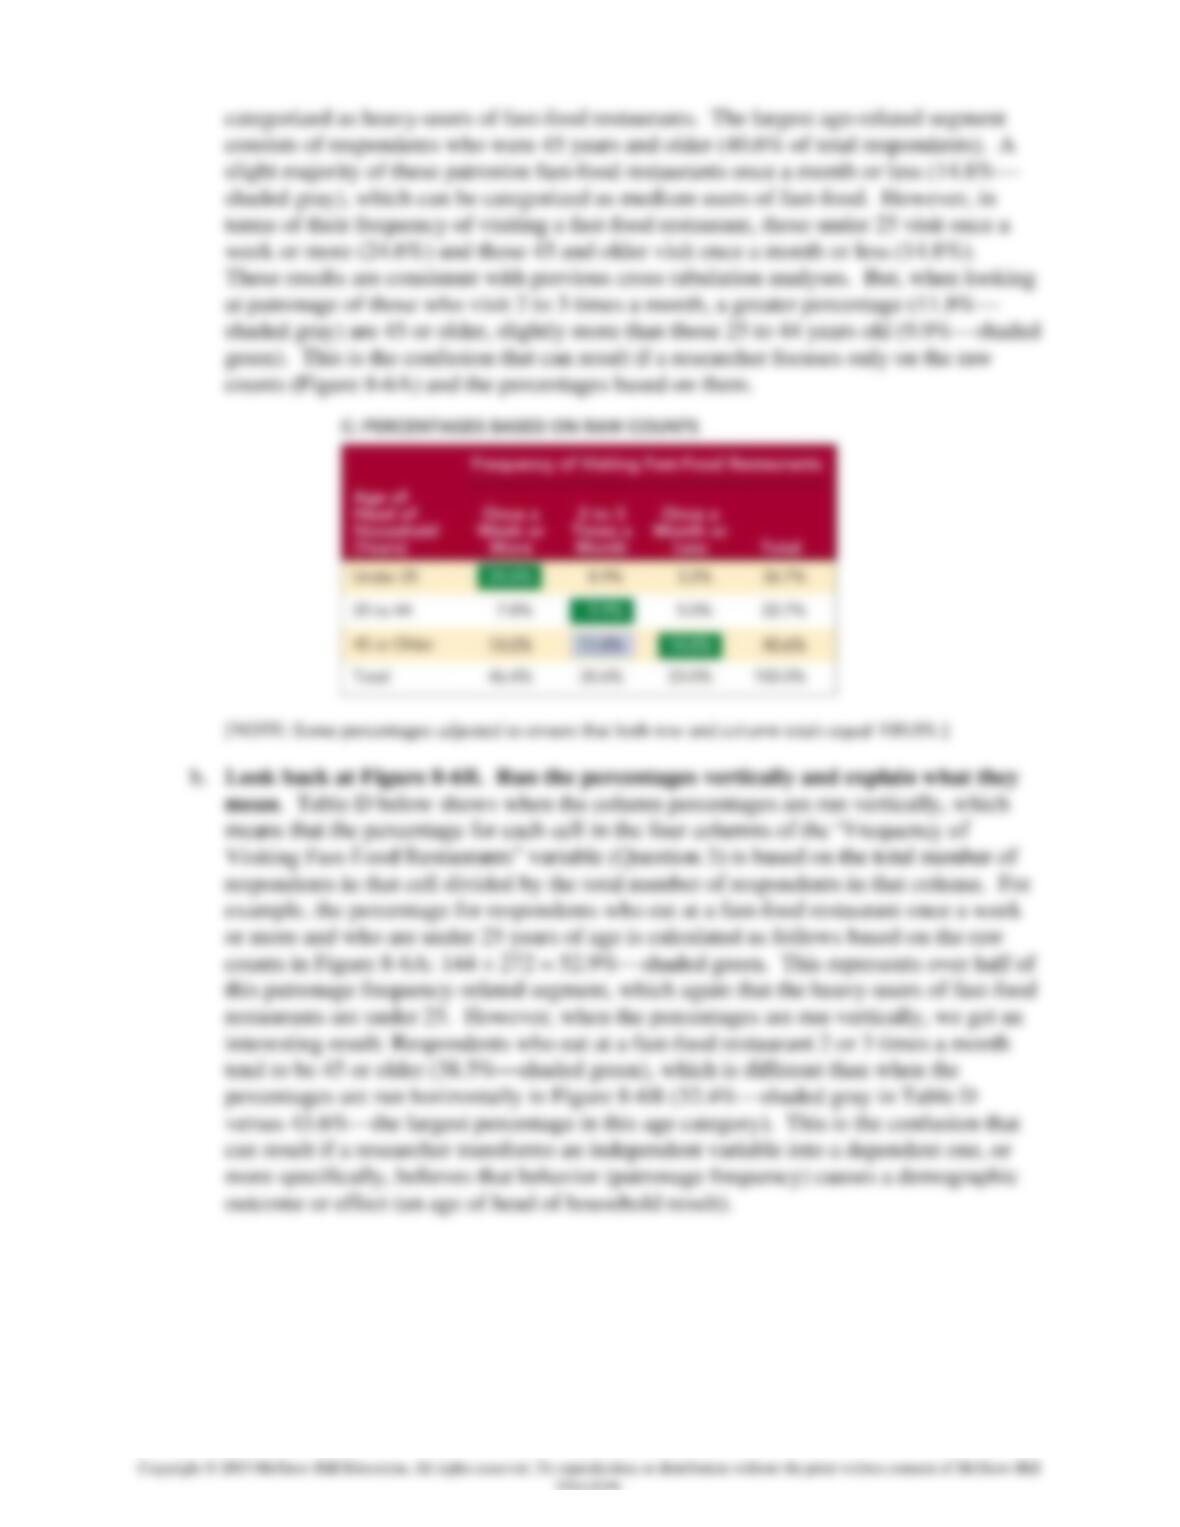
sampled (586) and explain what the percentages mean. (b) Look back at Figure 8-6B.
Run the percentages vertically and explain what they mean.
Answers: Figure 8-4 shows a number of questions used in a Wendy’s survey that assessed
fast-food restaurant preferences among present and prospective consumers. Question 2
green). This represents two-thirds of this age-related segment (36.7%), which can be
Chapter 08 – Marketing Research: From Customer Insights to Actions
8-42
Chapter 08 – Marketing Research: From Customer Insights to Actions
8-43
8. Which of the following variables would linear trend extrapolation be more accurate
for? (a) Annual population of the United States or (b) annual sales of cars produced
in the United States by Ford. Why?
Chapter 08 – Marketing Research: From Customer Insights to Actions
8-44
BUILDING YOUR MARKETING PLAN
To help you collect the most useful data for your marketing plan, develop a three-
column table:
1. In column 1, list the information you would ideally like to have to fill holes in your
marketing plan.
2. In column 2, identify the source for each bit of information in column 1, such as an
Internet search, talking to prospective customers, looking at internal data, and so
forth.
3. In column 3, set a priority on information you will have time to spend collecting by
rating them: 1 = most important; 2 = next most important; and so forth. [Note: This is
a 3-pt. scale.]
Chapter 08 – Marketing Research: From Customer Insights to Actions
8-45
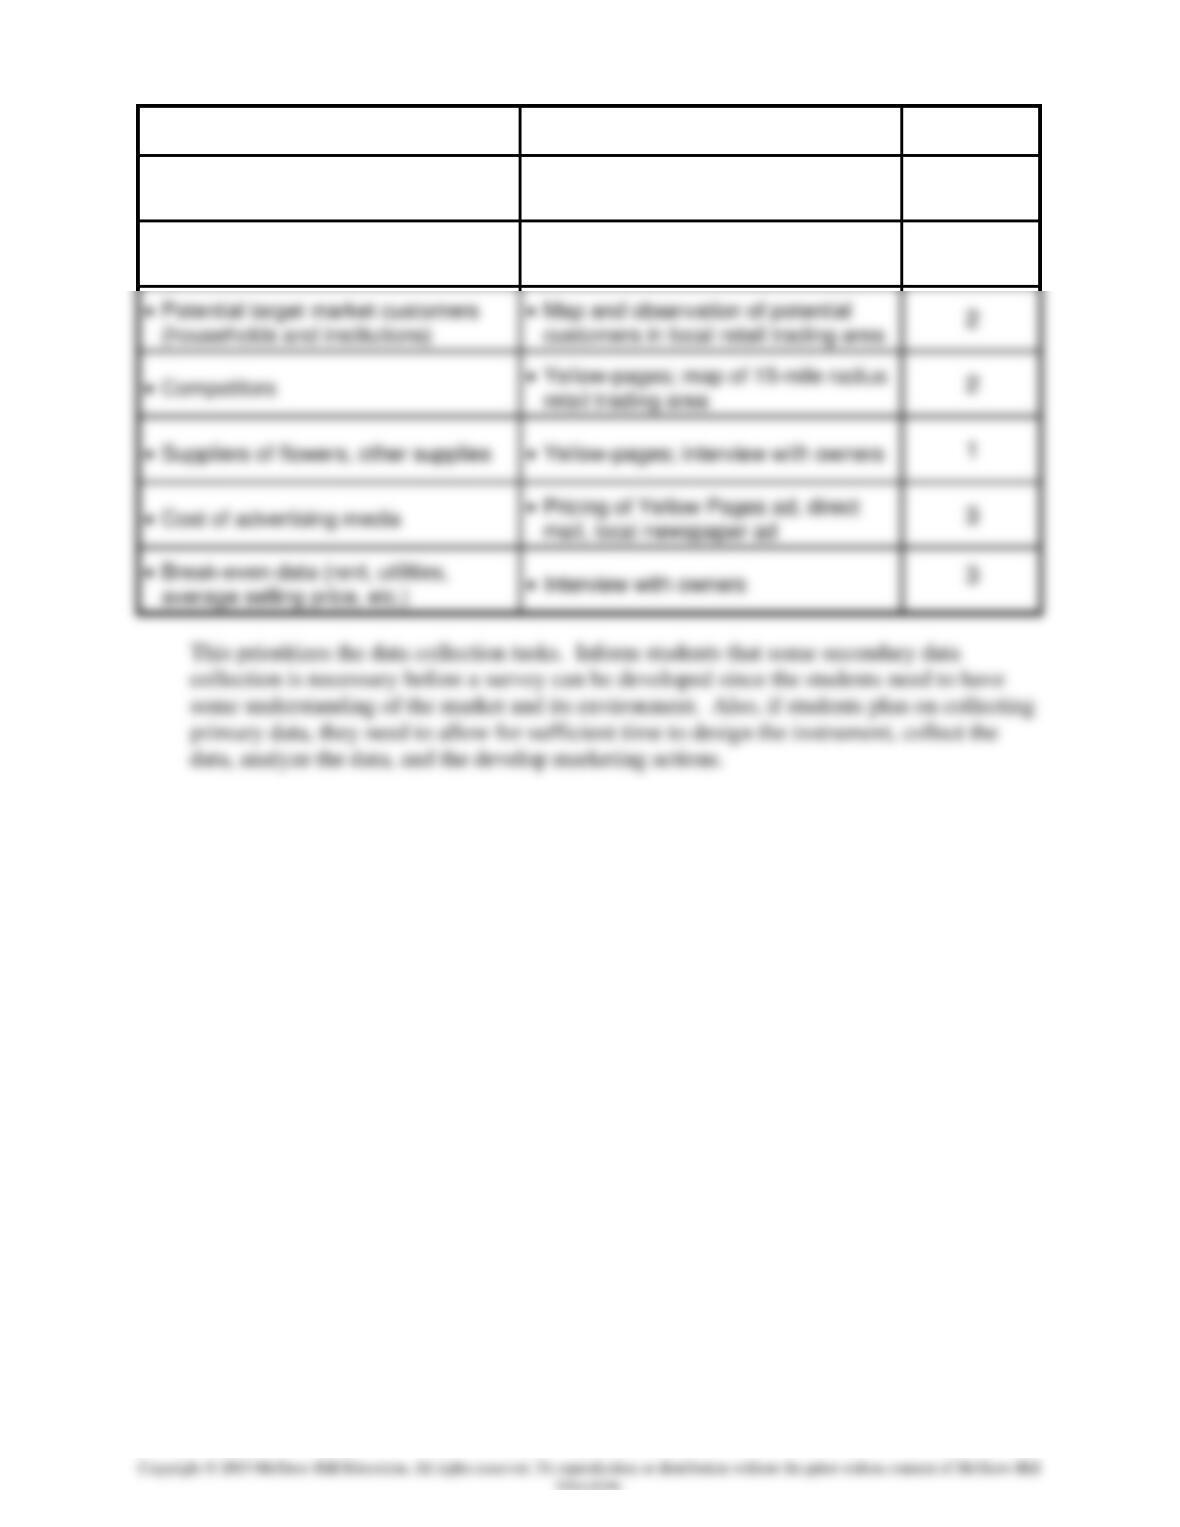
NEEDED INFORMATION
INFORMATION SOURCE
PRIORITY
• Present target market customers
(households and institutions)
• Internal company records
3
• Satisfaction and wants of present
customers
• Simple, 8-question survey
3
• Potential target market customers
(households and institutions)
2
• Yellow-pages; interview with owners
3
• Break-even data (rent, utilities,
average selling price, etc.)
• Interview with owners
3
Helping with Common Student Problems
Students writing marketing plans often have the classic problem of procrastinators—
trying to collect and interpret the data the day before the plan is to be submitted to the instructor.
This needed data analysis step is intended to force students to anticipate the information required
and to obtain it before the last minute.

Chapter 08 – Marketing Research: From Customer Insights to Actions
8-46
TEACHING NOTE FOR VIDEO CASE VC-8
Carmex [A]: Leveraging Facebook for Marketing Research
Synopsis
Show Slide 8-60. Both Carmex® lip balms and recently-introduced skin care products
are produced by Carma Laboratories, a family-owned company that has taken pride in
connecting to its customers since its founding, 75 years ago. The case focuses on how to do
marketing research using Facebook to decide which two of three new possible flavors might be
put into quantitative testing. The two key Facebook metrics that will be used in reaching the
decision are “likes” and “engagement.” The three Facebook strategies are being considered
that are expected to have differing effects on likes and engagement as well as costs: (1) a poll
question on Carmex’s Facebook wall, (2) a contest on Facebook, and (3) both a poll and
contest. The case challenges students both to understand the two metrics and the effects on
them by using three alternative strategies on Facebook.
Teaching Suggestions
1. Review the In-Class Activity ICA 7-1 about introducing Carmex to European Markets if
you did not teach it when covering Chapter 7 on global marketing. You might review
this ICA to obtain additional background on Carmex.
2. Bookmark both the Carmex website (mycarmex.com) and Facebook brand page
(facebook.com/Carmexlipbalm) on your classroom computer.
3. Ask the class several questions concerning lip balm use and the common brands:
• How many of you use lip balm? Do you use it seasonally or throughout the year?
What kind of packaging do you prefer—jar, stick, or tube?
• Among users, what brand(s) do you use?
• Have you ever gone on a lip balm home page or a brand page on Facebook?
4. Point out to the class the new metrics now used with the emergence and growth of social
media. Some examples coming from both the Carmex video case and Chapter 8 in the
textbook include:
• Likes and likers (or Facebook “fans”). • Share of voice.
• Engagement. • Sentiment.
• Twitter followers.
These are strikingly different, say, from Starch scores for magazine ads that are covered
in the advertising chapter such as “noted,” “read some,” and “read most.”
Chapter 08 – Marketing Research: From Customer Insights to Actions
8-47
Answers to Questions
1. What are the advantages and disadvantages for the Carmex marketing team in
collecting data to narrow the flavor choices from three to two using (a) an online
survey of a cross-section of Internet households or (b) an online survey of Carmex
Facebook likers?
Answers:
Chapter 08 – Marketing Research: From Customer Insights to Actions
8-48
2. (a) On a Facebook brand page, what are “engagement” and “likes” really measuring?
(b) For Carmex, which is more important and why?
Answers:
3. (a) What evokes consumers’ “engagement” on a brand page on Facebook? (b) What
attracts consumers to “like” a brand page on Facebook?
Answers:
4. (a) What are the advantages of using a fixed-alternative poll question on Facebook?
(b) When do you think it would be better to use an open-ended question?
Answers: Show Slide 8-73 and Slide 8-74.
8-49
5. (a) If you had a limited budget and two weeks to decide which two flavors to put into
quantitative testing, would you choose a “poll only” or a “contest only” strategy?
Why? (b) If you had a sizable budget and two months to make the same decision,
which scenario would you choose? Why?
Epilogue
Carmex has been making lip balm since 1937. But in the last five years, it has stressed
growth and become more competitive. During this time, Carmex has relied on Bolin Marketing
to lead its domestic marketing, new product development, international distribution, and online
initiatives. As a result, Carmex’s business has more than doubled.
During the last five years, Carmex has seen growth on all fronts. It has extended its core
line of lip balm products into new flavors and varieties. It has also expanded into nearly forty
international markets. Carmex developed a line of premium lip balms for women, Carmex
Moisture Plus, and extended the line to include tinted lip balms. Most recently, Carmex
launched a line of skin care products, its first venture outside of lip care. Carmex has used social
media tools extensively in developing these initiatives.
Chapter 08 – Marketing Research: From Customer Insights to Actions
8-50
TEACHING NOTE FOR APPENDIX D CASE D-8
HOM Furniture: Where Keen Observation Pays
Synopsis
HOM Furniture is a classic tale of entrepreneurial success. CEO Wayne Johansen has
leveraged his years of retail experience into a highly profitable full-line furniture business. A
key factor in HOM Furniture’s success is the use of practical, common sense marketing
research, ranging from visits to other successful furniture retailers to the measurement of
productivity by monitoring door swings in stores. This case exposes students to a variety of
research techniques, challenging them to think about the strengths and shortcomings of each
approach. They also have the opportunity to design a system for measuring customer
satisfaction.
Teaching Suggestions
This case is ideal for concluding a unit on the use of marketing information (Chapter 8).
It also provides enough information for a good discussion of the consumer buying process for
furniture. This ties in nicely with the chapter on consumer behavior (Chapter 5). The case can
also be referenced in a discussion of retailing techniques in conjunction with Chapter 17.
Students might be asked to compare techniques used by HOM Furniture relative to what they
have observed in local furniture stores.
Answers to Questions
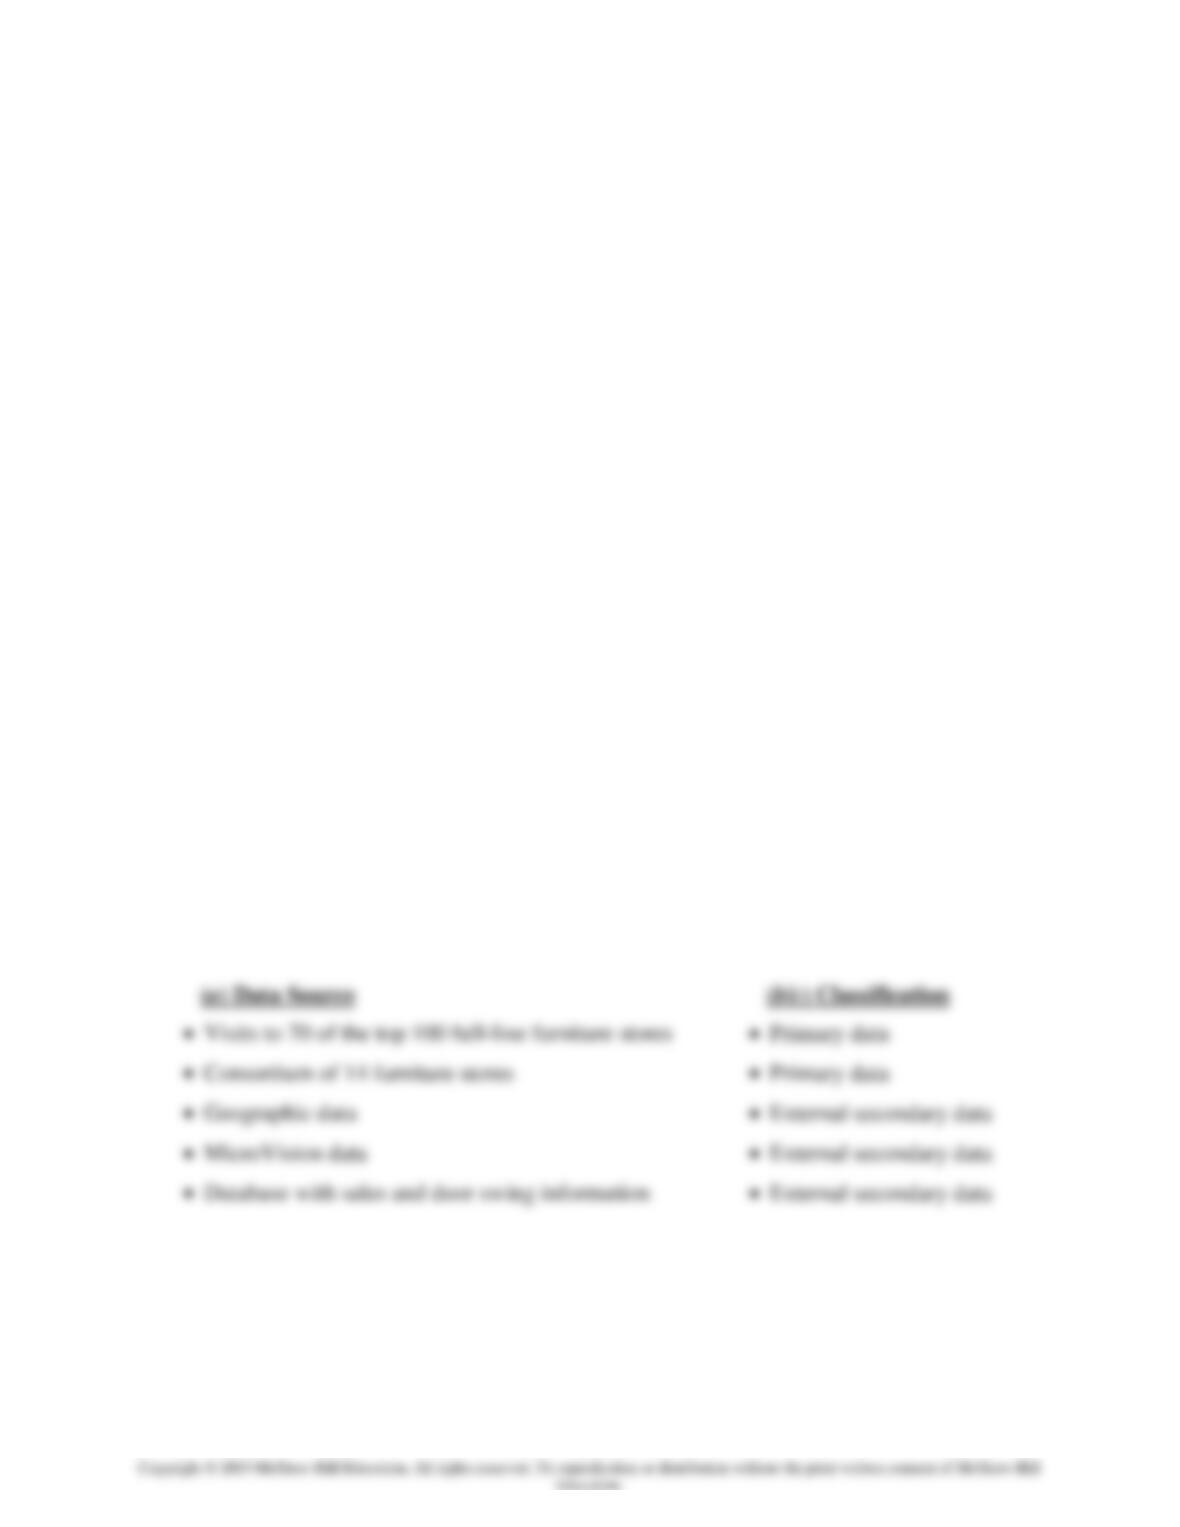
1. (a) Identify the data sources HOM Furniture uses in its marketing information
system. (b) Which would you classify as secondary data sources? (c) Which would be
considered primary data sources?
Answers:
8-51
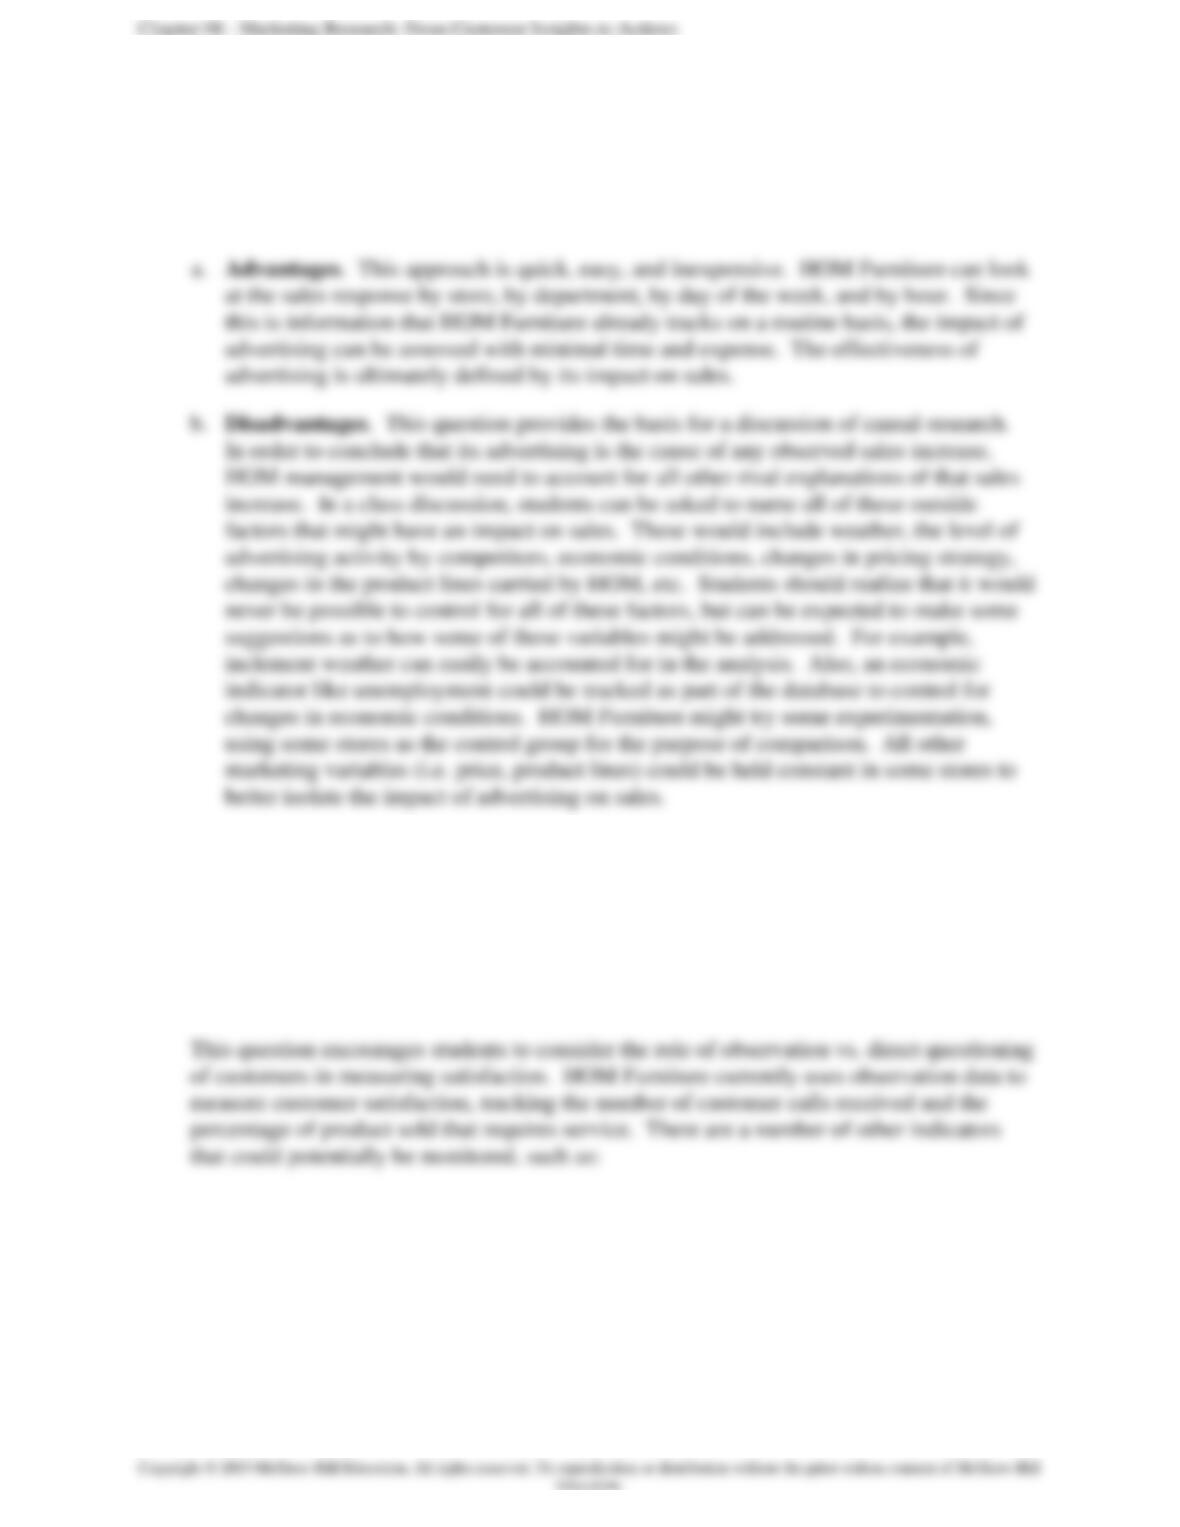
2. When HOM Furniture advertises, it looks for a resulting spike in sales using an
extensive database. (a) What are the advantages of this approach? (b) What are the
possible shortcomings of this approach and how would you address them?
Answers:
3. Assume that you have been hired as a marketing consultant by HOM Furniture’s
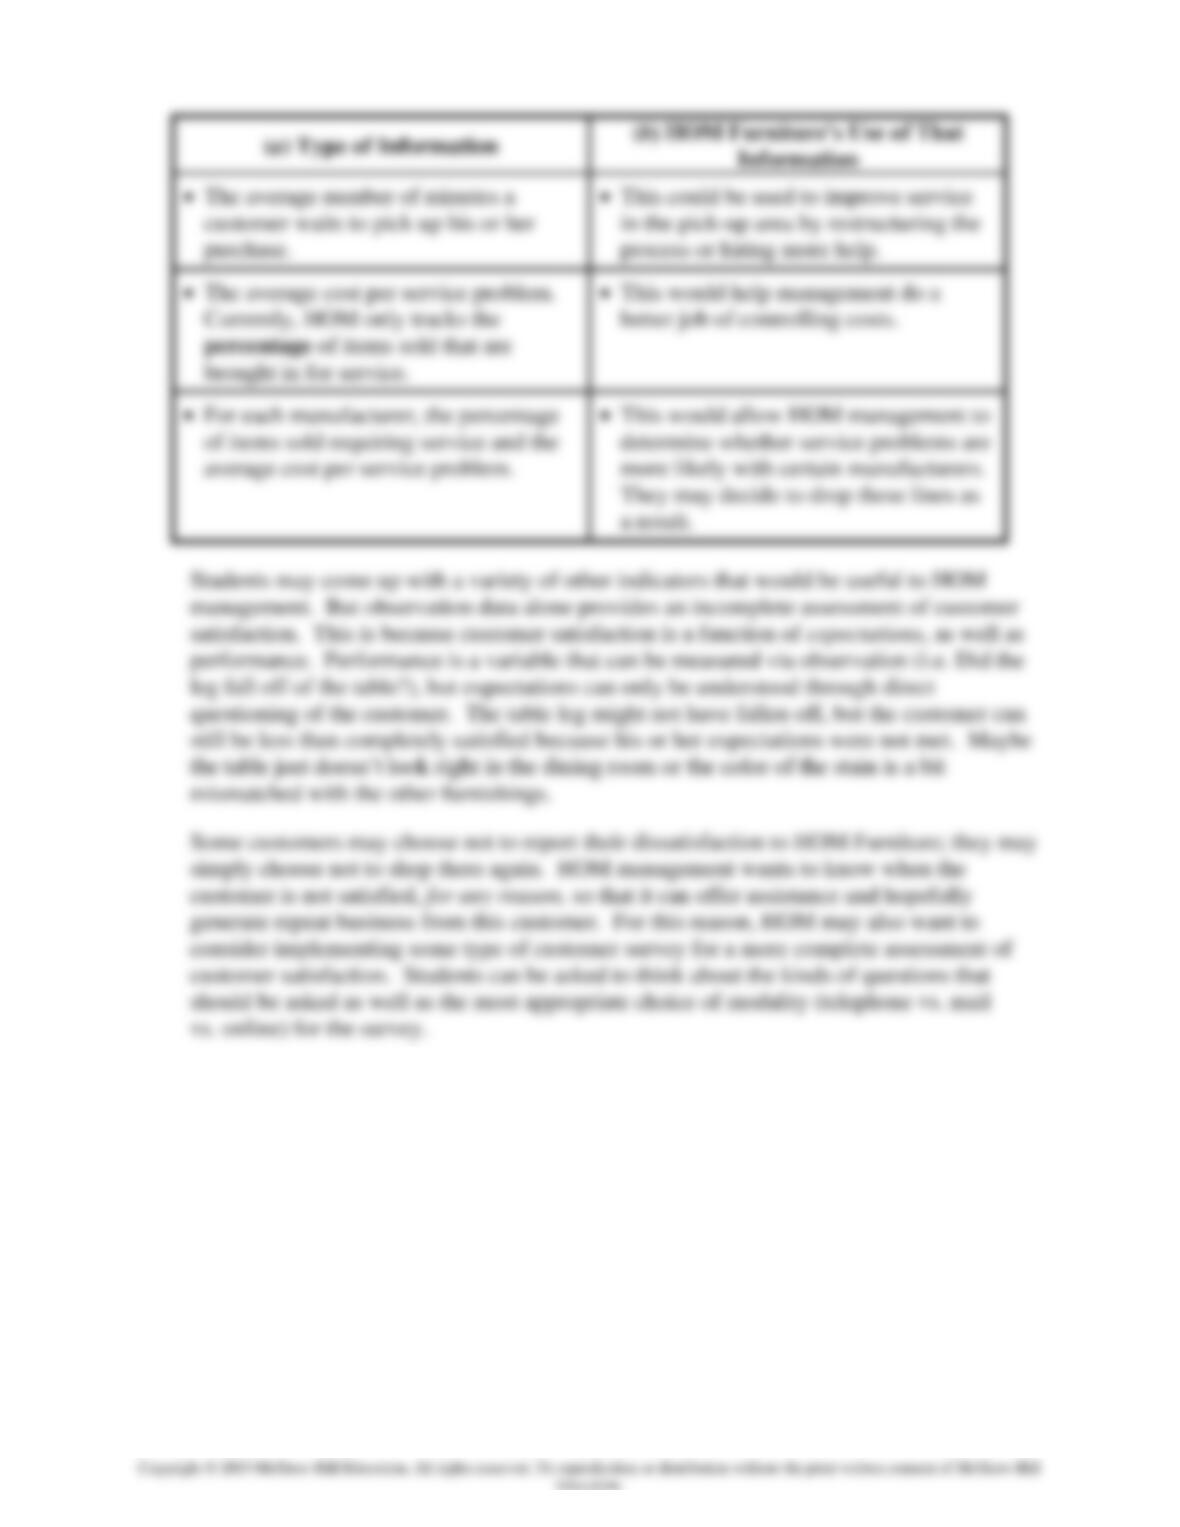
management. (a) What specific types of information should HOM collect to measure
customer satisfaction with its stores and services? (b) For each type of information
you identified in (a), how would HOM Furniture make use of that information to
improve customer satisfaction?
Answers:
Chapter 08 – Marketing Research: From Customer Insights to Actions
8-52
Chapter 08 – Marketing Research: From Customer Insights to Actions
8-53
ICA 8-1: IN-CLASS ACTIVITY
Interpreting Census Data
Learning Objectives. To have students: (1) learn how Census 2010 data and the
relatively new American Community Survey are collected; (2) locate specific data in Census
Bureau reports to become familiar with them; and (3) identify the size of market segments to
solve hypothetical marketing problems.
Nature of the Activity. To have students look at 2010 Census and 2012 Current
Population data to find specific numbers that provide initial estimates of the size of potential
market segments.
Estimated Class Time and Teaching Suggestions. About 20 minutes, taught in class in
4-person teams.
Materials Needed.
• View these forms online in the classroom, or make copies for each student of the
following:
Steps to Teach this ICA.
1. OPTIONAL: Bookmark the following websites on your classroom computer:
2. Form students into 4-person teams.
3. Click on the Internet icon to play the Census 2010 promotional video: The New
Portrait of America. [TRT = 3:19]
4. Give the following mini-lecture about the U.S. Census 2010:
Chapter 08 – Marketing Research: From Customer Insights to Actions
8-54
“Many of you are familiar with the 10-year census that reports statistics on U.S.
population, housing, income, and other demographic data. The U.S. Constitution
requires that a census be taken. The results are used to apportion seats in the U.S.
House of Representatives, allocate federal funds to local communities, etc. Because
6. Census 2010 Population Change. Have students locate their PopulationChange
Handout or Web site. Ask students the following questions:
• Question 1: What is the U.S. population in 2010 according to the U.S.
Census?
• Question 2: What was the percentage change in the U.S. population from
2000 to 2010?
• Question 3: Which state had the lowest growth rate from 2000 to 2010?
• Question 4: Which state had the highest growth rate from 2000 to 2010?
7. Census 2010 Sex and Age Composition. Have students locate their AgeSex Handout
or Web site. Ask students the following questions:
• Question 1: Which gender had the largest population in 2010?
• Question 2: Of the age groups listed, which segment was the largest?
• Question 3: Of the age groups listed, which grew the most from 2000 to
2010? The least?

Chapter 08 – Marketing Research: From Customer Insights to Actions
8-55
• Question 4: Assume Herff-Jones, a publisher, is considering producing a
coloring book for pre-schoolers. What is the number of children under 5
years of age?
8. Census 2010 Race and Hispanic Population. Have students locate their RaceHispanic
Handout or Web site. Ask students the following questions:
• Question 1: Which Racial or Hispanic segment is the largest? Grew the most
from 2000 to 2010?
• Question 2: Assume a Hispanic American entrepreneur is considering
developing a chain of U.S. fast-food restaurants. She assumes the initial
“core customers” will be other Hispanic Americans. What is the size of this
market?
9. Call on students to share their answers with the class. Stress that external secondary
10. OPTIONAL: 2013 American Community Survey (ACS). Click on the Internet icon
to play the ACS promotional video; TRT = 2:44.] Conclude this activity with the
following mini-lecture on the ACS:1
Marketing Lessons. Marketers need up-to-date information to use in identifying the size
of potential market segments on which to execute marketing strategies and tactics or actions.
1 American Community Survey Fact Sheet, U.S. Census Bureau.