1
Chapter 06 – Sampling: Theory and Methods
Chapter 6
Sampling: Theory and Methods
Learning Objectives (PPT slide 6-2)
1. Explain the role of sampling in the research process.
2. Distinguish between probability and nonprobability sampling.
Key Terms and Concepts
1. Area sampling
2. Census
3. Central limit theorem (CLT)
4. Cluster sampling
5. Convenience sampling
6. Defined target population
7. Disproportionately stratified sampling
8. Judgment sampling
Chapter Summary by Learning Objectives
2
Chapter 06 – Sampling: Theory and Methods
Explain the role of sampling in the research process.
Sampling uses a portion of the population to make estimates about the entire population. The
fundamentals of sampling are used in many of our everyday activities. For instance, we sample
before selecting a TV program to watch, test-drive a car before deciding whether to purchase it,
and take a bite of food to determine if our food is too hot or if it needs additional seasoning. The
Sampling is frequently used in marketing research projects instead of a census because sampling
can significantly reduce the amount of time and money required in data collection.
Distinguish between probability and nonprobability sampling.
In probability sampling, each sampling unit in the defined target population has a known
probability of being selected for the sample. The actual probability of selection for each
sampling unit may or may not be equal depending on the type of probability sampling design
used. In nonprobability sampling, the probability of selection of each sampling unit is not
known. The selection of sampling units is based on some type of intuitive judgment or
knowledge of the researcher.
Understand factors to consider when determining sample size.
3
Chapter 06 – Sampling: Theory and Methods
Researchers consider several factors when determining the appropriate sample size. The amount
of time and money available often affect this decision. In general, the larger the sample, the
greater the amount of resources required to collect data. Three factors that are of primary
Understand the steps in developing a sampling plan.
A sampling plan is the blueprint or framework needed to ensure that the data collected are
representative of the defined target population. A good sampling plan will include, at least, the
following steps: (1) define the target population; (2) select the data collection method; (3)
identify the sampling frames needed; (4) select the appropriate sampling method; (5) determine
necessary sample sizes and overall contact rates; (6) create an operating plan for selecting
sampling units; and (7) execute the operational plan.
Chapter Outline
Opening Vignette: Mobile Web Interactions Explode
The opening vignette in this chapter describes development of Internet searches by mobile
phone. There has been a vast increase in the use of mobile phones for content online but
consumers still prefer a desktop or laptop for searches. If a marketing research study were
conducted on mobile phone search adoption, following would be the key questions to answer.
• What respondents should be included in a study about consumer acceptance of mobile
search?
I. Value of Sampling in Marketing Research (PPT slide 6-3)
Sampling is selection of a small number of elements from a larger defined target group of
elements and expecting that the information gathered from the small group will allow judgments
4
Chapter 06 – Sampling: Theory and Methods
to be made about the larger group (PPT slide 6-3).
A. Sampling as a Part of the Research Process (PPT slide 6-4)
Sampling is often used when it is impossible or unreasonable to conduct a census. A census is
a research study that includes data about every member of the defined target population (PPT
slide 6-4).
II. The Basics of Sampling Theory (PPT slides 6-5 to 6-8)
A. Population (PPT slide 6-5)
A population is an identifiable group of elements (e.g., people, products, organizations) of
interest to the researcher and pertinent to the information problem. Most businesses that
collect data are not really concerned with total populations, but with a prescribed segment. A
B. Sampling Frame (PPT slide 6-5)
A sampling frame is a list of all eligible sampling units. Some common sources of sampling
frames are lists of registered voters and customer lists from magazine publishers or credit card
companies. There also are specialized commercial companies (for instance, Survey Sampling,
C. Factors Underlying Sampling Theory (PPT slide 6-6)
To understand sampling theory, researchers must know sampling-related concepts. Sampling
concepts and approaches are often discussed as if the researcher already knows the key
population parameters prior to conducting the research project. However, because most
business environments are complex and rapidly changing, researchers often do not know these
5
Chapter 06 – Sampling: Theory and Methods
parameters prior to conducting research. One of the major goals of researching small, yet
representative, samples of members of a defined target population is that the results of the
research will help to predict or estimate what the true population parameters are within a
certain degree of confidence.
If business decision makers had complete knowledge about their defined target populations,
they would have perfect information about the realities of those populations, thus eliminating
the need to conduct primary research.
With an understanding of the basics of the central limit theorem (CLT), the researcher can do
the following:
• draw representative samples from any target population
• obtain sample statistics from a random sample that serve as accurate estimates of the
target population’s parameters
• draw one random sample, instead of many, reducing the costs of data collection
D. Tools Used to Assess the Quality of Samples (PPT slides 6-7 to 6-8)
There are numerous opportunities to make mistakes that result in some type of bias in any
research study. This bias can be classified as either of the following (PPT slide 6-8):
• sampling error
• nonsampling error
6
Chapter 06 – Sampling: Theory and Methods
Random sampling errors could be detected by observing the difference between the sample
results and the results of a census conducted using identical procedures. Following are the two
difficulties associated with detecting sampling error.
• A census is very seldom conducted in survey research
completed
Sampling error is any bias that is attributable to mistakes in either drawing a sample or
determining the sample size. Moreover, random sampling error tends to occur because of
chance variations in the selection of sampling units. Even if the sampling units are properly
Nonsampling error is a bias that occurs in a research study regardless of whether a sample or
census is used. These errors can occur at any stage of the research process. Some examples
are as follows.
• The target population may be inaccurately defined causing population frame error
• Inappropriate question/scale measurements can result in measurement error
• A questionnaire may be poorly designed causing response error
• There may be other errors in gathering and recording data or when raw data are coded
and entered for analysis.
In general, the more extensive a study, the greater the potential for nonsampling errors. Unlike
sampling error, there are no statistical procedures to assess the impact of nonsampling errors
IV. Probability and Nonprobability Sampling (PPT slide 6-9)
There are two basic sampling designs.
• Probability sampling
• Nonprobability sampling
Exhibit 6.2 lists the different types of both sampling methods.
7
Chapter 06 – Sampling: Theory and Methods
In probability sampling, each sampling unit in the defined target population has a known
probability of being selected for the sample. The actual probability of selection for each
sampling unit may or may not be equal depending on the type of probability sampling design
• proper sample representation of the defined target population
Probability sampling enables the researcher to judge the reliability and validity of data collected
by calculating the probability that the sample findings are different from the defined target
population. The observed difference can be partially attributed to the existence of sampling error.
The results obtained by using probability sampling designs can be generalized to the target
population within a specified margin of error.
Nonprobability sampling is a sampling design in which the probability of selection of each
sampling unit is not known. The selection of sampling units is based on the judgment of the
A. Probability Sampling Designs (PPT slides 6-10 to 6-14)
Simple random sampling is a probability sampling in which every sampling unit has a
known and equal chance of being selected (PPT slide 6-11).
Simple random sampling has several advantages.
• The technique is easily understood and the survey’s results can be generalized to the
defined target population with a prespecified margin of error.
• Simple random samples produce unbiased estimates of the population’s characteristics.
Systematic random sampling is similar to simple random sampling but requires that the
8
Chapter 06 – Sampling: Theory and Methods
defined target population be ordered in some way, usually in the form of a customer list,
taxpayer roll, or membership roster (PPT slide 6-11). In research practices, systematic random
sampling has become a popular method of drawing samples. Compared to simple random
sampling, systematic random sampling is less costly because it can be done relatively quickly.
When executed properly, systematic random sampling creates a sample of objects or
prospective respondents that is very similar in quality to a sample drawn using simple random
sampling.
Skip interval = Defined target population list size ∕ Desired sample size
Exhibit 6.3 displays the steps that a researcher would take in drawing a systematic random
sample.
Stratified random sampling involves the separation of the target population into different
groups, called strata, and the selection of samples from each stratum. (PPT slide 6-12) It is
similar to segmentation of the defined target population into smaller, more homogeneous sets
of elements.
To ensure that the sample maintains the required precision, representative samples must be
drawn from each of the smaller population groups (stratum). Drawing a stratified random
sample involves three basic steps.
• Dividing the target population into homogeneous subgroups or strata
9
Chapter 06 – Sampling: Theory and Methods
• Combining the samples from each stratum into a single sample of the target population
Two common methods are used to derive samples from the strata.
• Proportionate: Proportionately stratified sampling is a stratified sampling method in
Dividing the target population into homogeneous strata has several advantages, including the
following:
• assurance of representativeness in the sample
The primary difficulty encountered with stratified sampling is determining the basis for
stratifying.
Cluster sampling is similar to stratified random sampling, but is different in that the
sampling units are divided into mutually exclusive and collectively exhaustive subpopulations
A popular form of cluster sampling is area sampling (PPT slide 6-14). In area sampling, the
clusters are formed by geographic designations. When using area sampling, the researcher has
two additional options.
• The one-step approach: The researcher must have enough prior information about the
various geographic clusters to believe that all the geographic clusters are basically
identical with regard to the specific factors that were used to initially identify the
clusters.
A primary disadvantage of cluster sampling is that the clusters often are homogeneous. The
10
Chapter 06 – Sampling: Theory and Methods
more homogeneous the cluster, the less precise the sample estimates. Another concern with
cluster sampling is the appropriateness of the designated cluster factor used to identify the
sampling units within clusters.
B. Nonprobability Sampling Designs (PPT slides 6-14 and 6-15)
Convenience sampling is a nonprobability sampling method in which samples are drawn at
the convenience of the researcher (PPT slide 6-14). The assumption is that the individuals
interviewed at the shopping mall are similar to the overall defined target population with
regard to the characteristic being studied.
Judgment Sampling or purposive sampling is a nonprobability sampling method in which
participants are selected according to an experienced individual’s belief that they will meet
the requirements of the research study (PPT slide 6-14).
Quota sampling involves the selection of prospective participants according to prespecified
quotas for either demographic characteristics, specific attitudes, or specific behaviors (PPT
slide 6-15). The purpose of quota sampling is to assure that prespecified subgroups of the
population are represented.
Snowball sampling is a nonprobability sampling method, also called referral sampling, in
11
Chapter 06 – Sampling: Theory and Methods
which a set of respondents is chosen, and they help the researcher identify additional people
to be included in the study (PPT slide 6-15). Snowball sampling is typically used in the
following situations.
• The defined target population is small and unique
• Compiling a complete list of sampling units is very difficult
C. Determining the Appropriate Sampling Design (PPT slide 6-16)
Determining the best sampling design involves consideration of several factors. Exhibit 6.5
provides an overview of the major factors that should be considered (PPT slide 6-16).
• Research objectives
• Degree of accuracy
• Resources
V. Determining Sample Sizes (PPT slides 6-18 to 6-24)
Determining the sample size is not an easy task. The researcher must consider how precise the
estimates must be and how much time and money are available to collect the required data, since
A. Probability Sample Sizes (PPT slides 6-18 to 6-21)
Three factors play an important role in determining sample sizes with probability designs
(PPT slide 6-18).
• The population variance, which is a measure of the dispersion of the population, and its
square root, referred to as the population standard deviation. The greater the variability
in the data being estimated the larger the sample size needed.
12
Chapter 06 – Sampling: Theory and Methods
• The level of confidence desired in the estimate. The higher the level of confidence
desired the larger the sample size needed.
For a particular sample size, there is a trade-off between degree of confidence and degree of
precision, and the desire for confidence and precision must be balanced. These two
considerations must be agreed upon by the client and the marketing researcher based on the
research situation.
When formulas are used to determine sample size, there are separate approaches for
determining sample size based on a predicted population mean and a population proportion.
The formulas are used to estimate the sample size for a simple random sample. When the
situation involves estimating a population mean, the formula for calculating the sample size
is:
n = (Z2 B,CL) (σ2∕ e2)
Where
ZB,CL = The standardized z-value associated with the level of confidence
σµ = Estimate of the population standard deviation (σ) based on some type of prior information
e = Acceptable tolerance level of error (stated in percentage points)
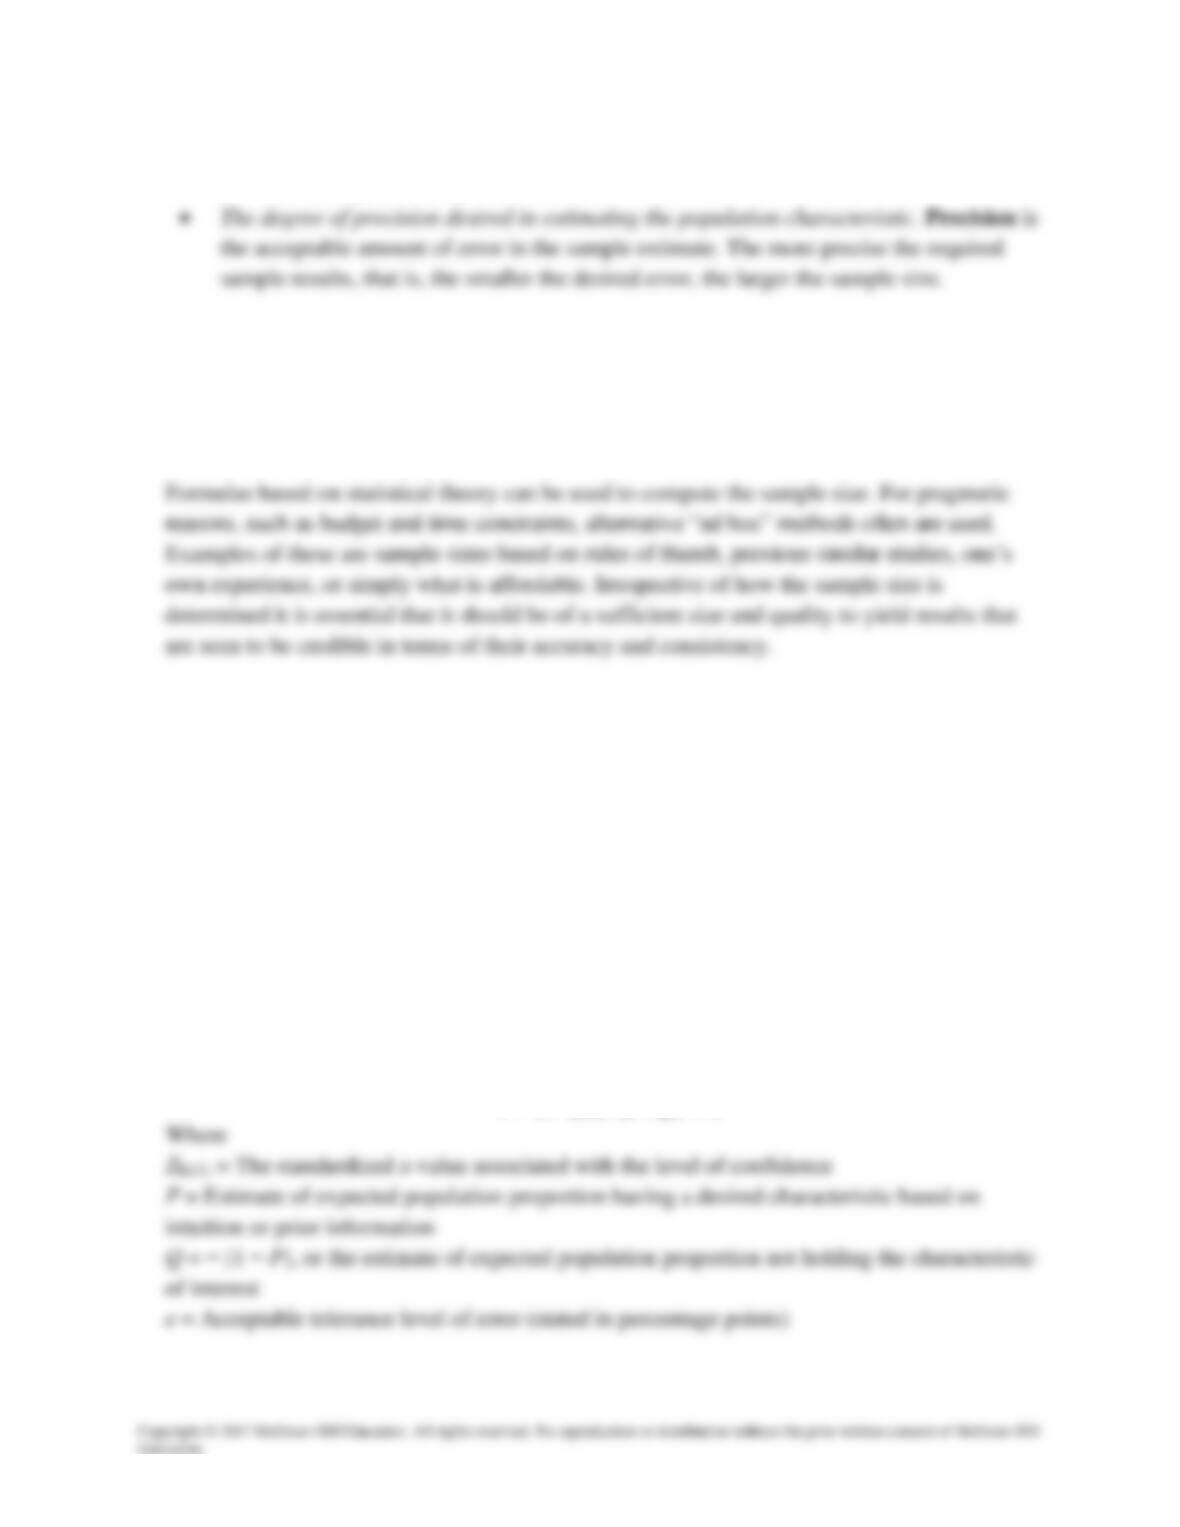
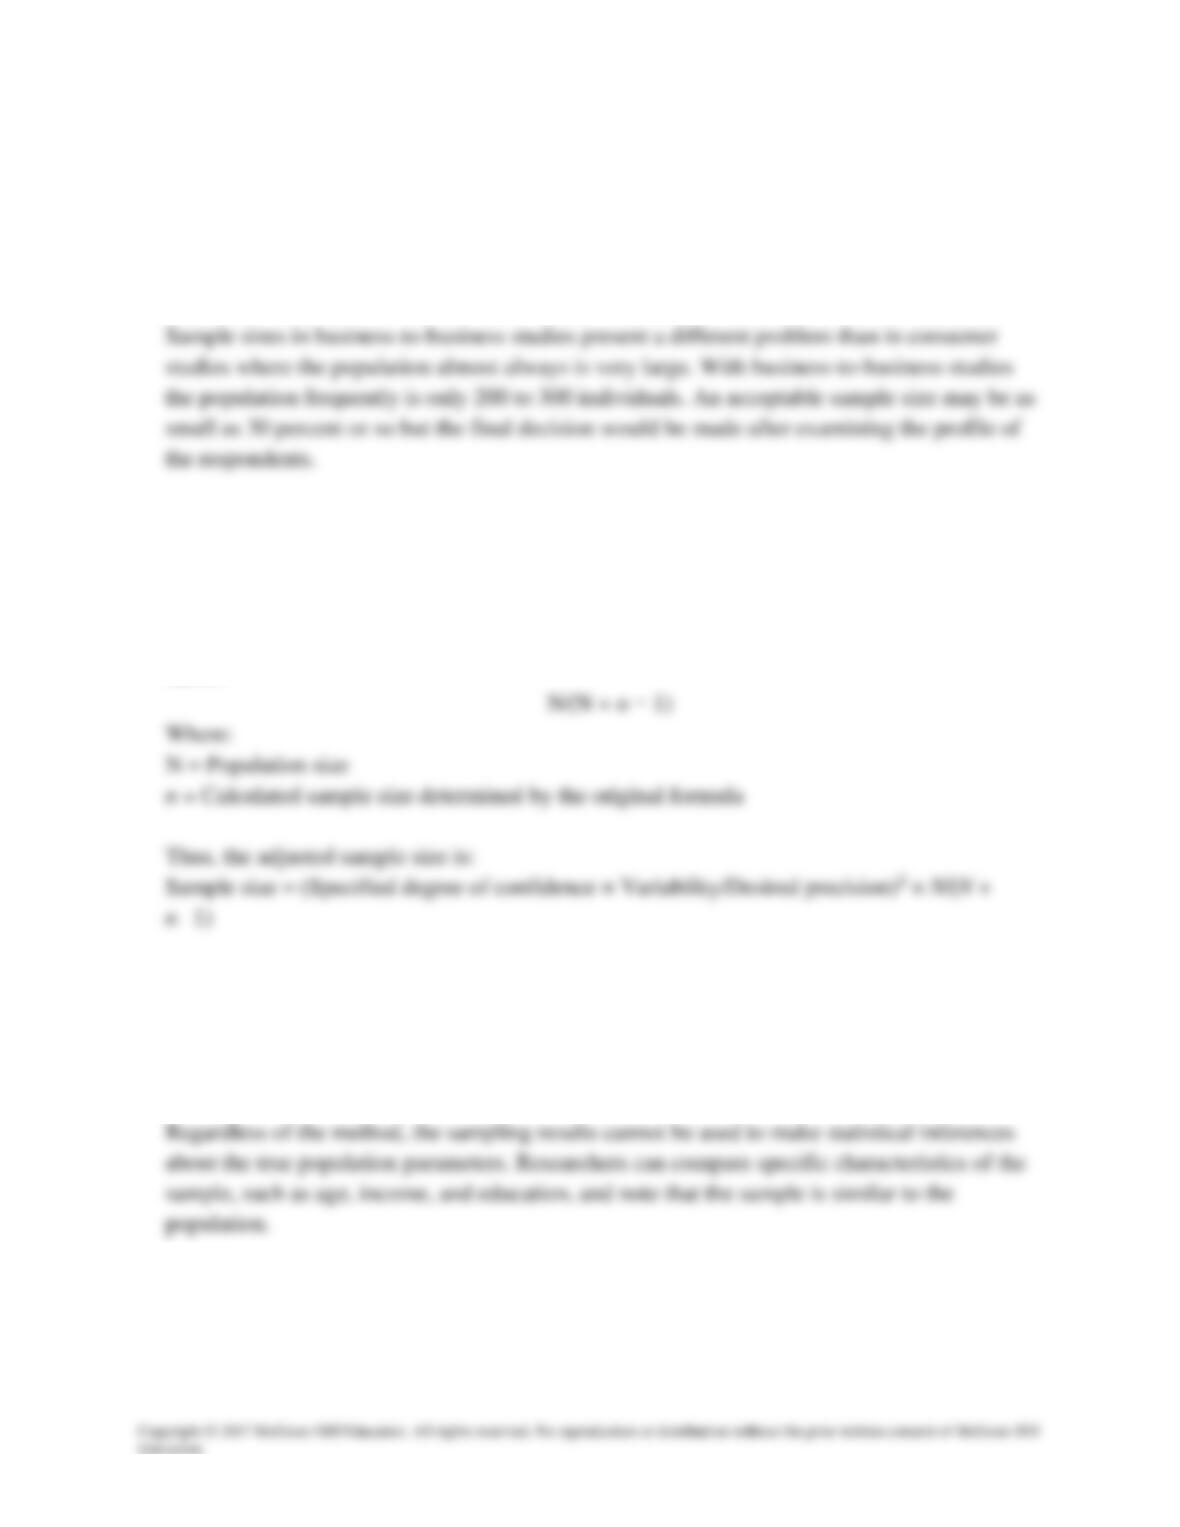
In situations where estimates of a population proportion are of concern, the standardized
formula for calculating the needed sample size would be:
n = (Z2 B,CL) ([P×Q] ∕ e2)
13
Chapter 06 – Sampling: Theory and Methods
When the defined target population size in a consumer study is 500 elements or less, the
researcher should consider taking a census of the population rather than a sample. The logic
behind this is based on the theoretical notion that at least 384 sampling units need to be
included in most studies to have a +/- 5 percent confidence level and a sampling error of +/– 5
percentage points.
B. Sampling from a Small Population (PPT slide 6-20)
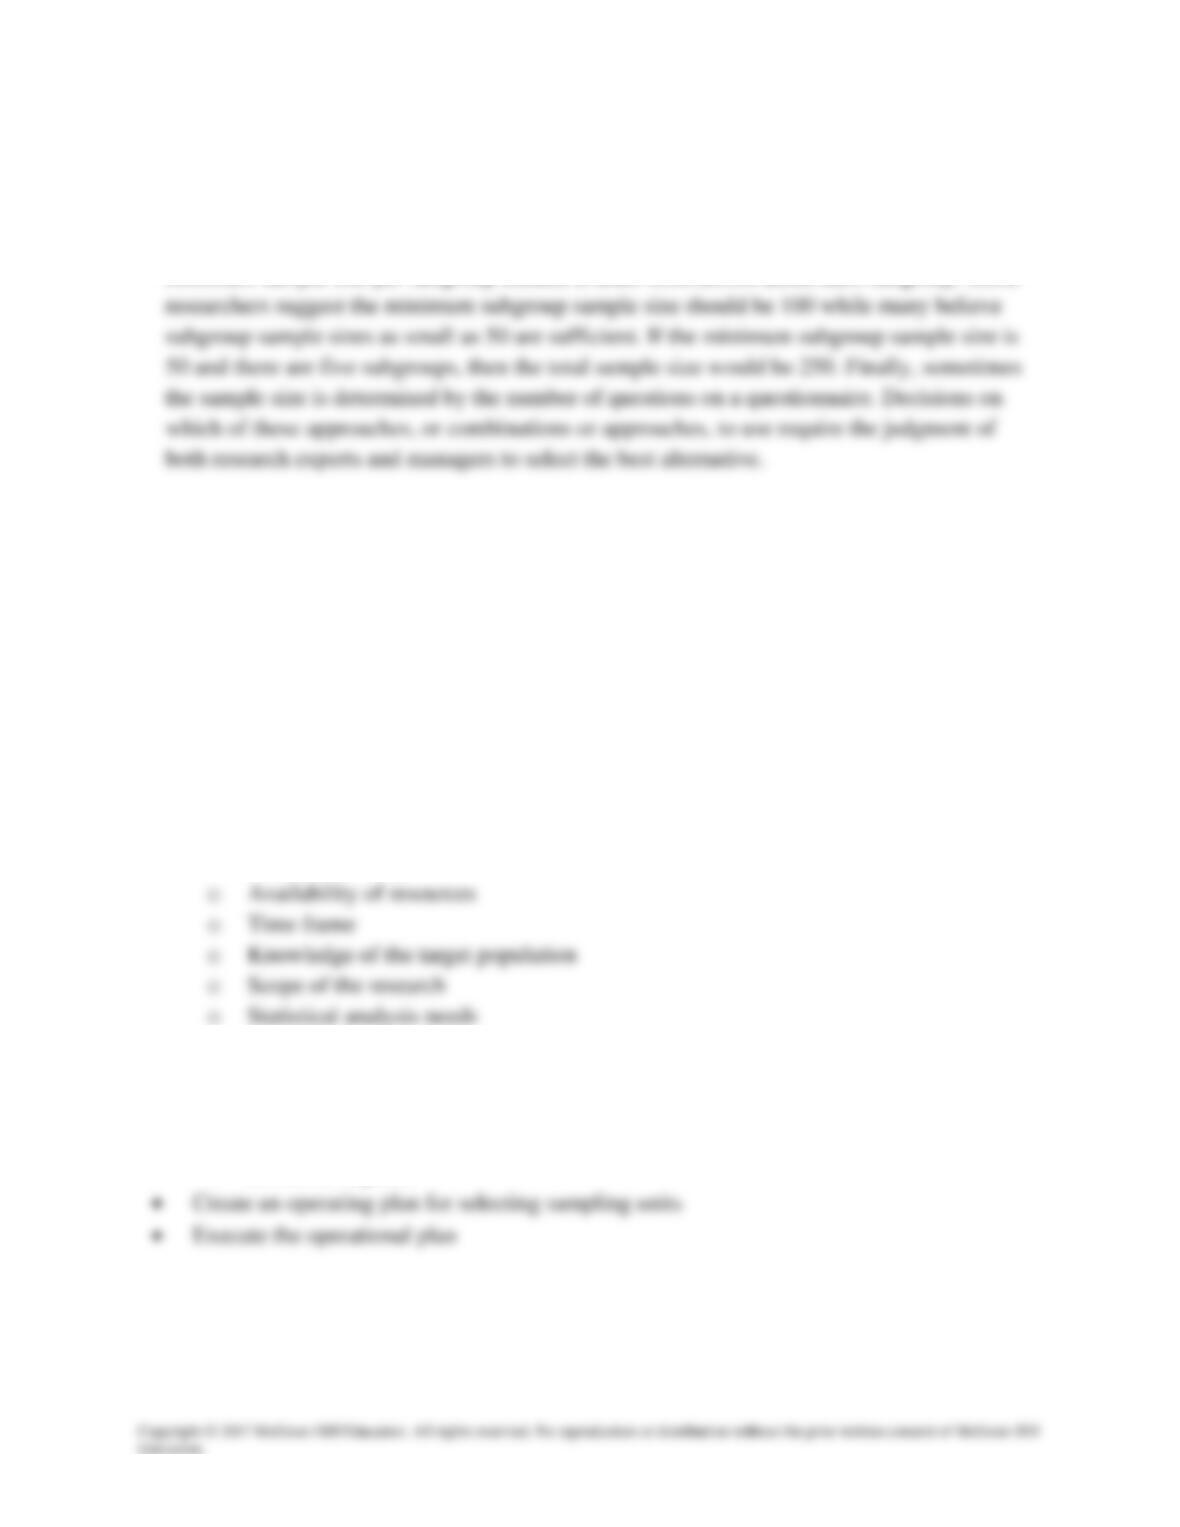
When working with small populations, however, use of the above formulas may lead to an
unnecessarily large sample size. If, for example, the sample size is larger than 5 percent of the
population then the calculated sample size should be multiplied by the following correction
factor:
C. Nonprobability Sample Sizes (PPT slide 6-21)
Sample size formulas cannot be used for nonprobability samples. Determining the sample size
for nonprobability samples is usually a subjective, intuitive judgment made by the researcher
based on either past studies, industry standards, or the amount of resources available.
D. Other Sample Size Determination Approaches (PPT slide 6-21)
Sample sizes are often determined using less formal approaches. For example, the budget is
14
Chapter 06 – Sampling: Theory and Methods
almost always a consideration, and the sample size then will be determined by what the client
can afford. A related approach is basing sample size on similar previous studies that are
considered comparable and judged as having produced reliable and valid findings.
Consideration also is often given to the number of subgroups that will be examined and the
VI. Steps in Developing a Sampling Plan (PPT slides 6-22 and 6-23)
Sampling plan is the blueprint or framework needed to ensure that the data collected are
representative of the defined target population (PPT slide 6-22).
A good sampling plan includes the following steps (PPT slide 6-25).
• Define the target population
• Select the data collection method
• Identify the sampling frames needed
• Select the appropriate sampling method—in determining the sampling method, the
researcher must consider seven factors:
o Research objectives
o Desired accuracy
• Determine necessary sample sizes and overall contact rates—to determine the appropriate
sample size, decisions have to be made concerning the:
o Variability of the population characteristic under investigation
o Level of confidence desired in the estimates
o Precision required
Marketing Research in Action
Developing a Sampling Plan for a New Menu Initiative Survey (PPT slides 6-24 and 6-25)
15
Chapter 06 – Sampling: Theory and Methods
The Marketing Research in Action introduces the fact that the owners of the Santa Fe Grill
realize that in order to remain competitive in the restaurant industry, new menu items need to be
Answers to Hands-On Exercise
1. How many questions should the survey contain to adequately address all possible new
menu items, including the notion of assessing the desirability of new cuisines? In short,
how can it be determined that all necessary items will be included on the survey without
the risk of ignoring menu items that may be desirable to potential customers?
The number of questions should be limited to enable participants to complete the survey
quickly. Otherwise, participants may be annoyed at the time investment they were asked to
make.
2. How should the potential respondents be selected for the survey? Should customers be
interviewed while they are dining? Should customers be asked to participate in the survey
upon exiting the restaurant? Or should a mail or telephone approach be used to collect
information from customers/noncustomers?
An exit interview might be appropriate. As diners receive their checks they could be given
a short survey and asked to complete it before they leave.
3. How many new menu items can be examined on the survey? Remember, all potential menu
possibilities should be assessed but you must have a manageable number of questions so
the survey can be performed in a timely and reasonable manner. Specifically, from a list of
all possible menu items that can be included on the survey, what is the optimal number of
menu items that should be used? Is there a sampling procedure one can use to determine
the maximum number of menu items to place on a survey?
First, Santa Fe Grill is a niche player. There is a reason for that. If they try to be all things
16
Chapter 06 – Sampling: Theory and Methods
to all people, they will need to have a great deal of resources to put into their operation.
They obviously don’t have that option. Therefore, if they are thinking about expanding the
menu, they should think of items that are congruent with, or complimentary to, their
present offering.
How you decide on an optimal menu offering is a business decision, not based on
consumers’ tastes and preferences. Make an estimate of contribution to margin that each
menu item will generate. Start at the top and work down through the list. Stop when you
get to zero. Stop before that if you get to the place that you don’t have resources to support
the offering. Include some items that are complimentary to the real profit drivers. There is
no “optimum” number of items for a menu. It all depends on the individual situation. Menu
items can even change seasonally, to keep up with ingredient availability and/or customer’s
seasonal expectations.
4. Determine the appropriate sample design. Develop a sample design proposal for the Santa
Fe Grill that addresses the following: Should a probability or nonprobability sample be
used? Given your answer, what type of sampling design should be employed (simple
random, stratified, convenience, etc.)? Given the sample design suggested, how will
potential respondents be selected for the study? Finally, determine the necessary sample
size and suggest a plan for selecting the sample units.
It is possible to use a probability sample in this case and the results can be generalized to
the target population. A systematic random sample is probably adequate for this
17
Chapter 06 – Sampling: Theory and Methods
Answers to Review Questions
1. Why do many research studies place heavy emphasis on correctly defining a target
population rather than a total population?
When performing marketing research today, it’s important to ensure the people and objects
under scrutiny have a direct relationship to the objectives of the research project. A total
population is a grouping of people, objects, products, and organizations that are of interest
2. Explain the relationship between sample sizes and sampling error. How does sampling
error occur in survey research?
Sampling error is any type of bias that can be attributed to how the sample was drawn or
how sample size was determined. Estimated standard error measures the sampling error
3. The vice president of operations at Busch Gardens knows that 70 percent of the patrons
like roller-coaster rides. He wishes to have an acceptable margin of error of no more than
+/– 2 percent and wants to be 95 percent confident about the attitudes toward the “Gwazi”
roller coaster. What sample size would be required for a personal interview study among
on-site patrons?
This is an interesting review question; however, it should be assigned as a take-home
question as a way of preparing your class participants for some of the more sophisticated
discussion questions concerning sample size below. For this reason it’s advised that you
18
Chapter 06 – Sampling: Theory and Methods
Answers to Discussion Questions
1. Summarize why a current telephone directory is not a good source from which to develop a
sampling frame for most research studies.
The current telephone directory is a less than adequate source from which to develop a
sampling frame because of what’s referred to as an under-registration condition. Under
registration occurs when eligible sampling units are accidentally (and in this case
and write a brief summary on how sampling affects the ability to conduct accurate market
research.
Students’ answers will vary. Students should be able to summarize the importance of
sampling in their own words.