Chapter 21 – Implementing Interactive and Multichannel Marketing
21-1
CHAPTER CONTENTS
PAGE
POWERPOINT RESOURCES TO USE WITH LECTURES …………………………………… 21-2
LEARNING OBJECTIVES (LO) ……………………………………………………………………………. 21-3
KEY TERMS ………………………………………………………………………………………………………….. 21-3
LECTURE NOTES
• Chapter Opener: Seven Cycles Delivers Just One Bike. Yours …………………………….. 21-4
• Creating Customer Value, Relationships, and Experiences in Marketspace
(LO 21-1) …………………………………………………………………………………………………….. 21-5
• Online Consumer Behavior and Marketing Practice in Marketspace (LO 21-2;
LO 21-3) …………………………………………………………………………………………………….. 21-12
• Cross-Channel Shoppers and Multichannel Marketing (LO 21-4) ………………………. 21-19
APPLYING MARKETING KNOWLEDGE …………………………………………………………… 21-22
BUILDING YOUR MARKETING PLAN ………………………………………………………………. 21-24
VIDEO CASE (VC)
• VC-21: Pizza Hut and imc2: Becoming a Multichannel Marketer ……………………….. 21-25
APPENDIX D CASE (D)
• D-21: Crate and Barrel: Multichannel Marketing ………………………………………………. 21-27
IN-CLASS ACTIVITY (ICA)
• ICA 21-1: Buying an Automobile: Marketplace vs. Marketspace ……………………….. 21-29
CONNECT APPLICATION EXERCISES ………………………………………………21-32
• Creating Customer Value in Marketspace Click and Drag*
• Why Consumers Shop and Buy Online Click and Drag*
• Creating the Online Customer Experience Click and Drag*
• Multichannel Marketing at Pizza Hut Video Case
• Marketing Analytics: Web Design Analytics Exercise
*Note: An alternate version of each Click and Drag exercise is available in Connect for students with
accessibility needs.

Chapter 21 – Implementing Interactive and Multichannel Marketing
21-2
POWERPOINT RESOURCES TO USE WITH LECTURES
PowerPoint
Textbook Figures Slide
Figure 21-1 Seven website design elements that drive customer experience …………………………….. 21-8
Figure 21-2 Six product categories account for about 70% of online retail sales today …………….. 21-15
Figure 21-3 Why consumers shop and buy online ………………………………………………………………. 21-16
Figure 21-4 Cross-channel consumers engage in showrooming and webrooming …………………… 21-24
Figure 21-5 Implementing multichannel marketing with promotional websites ……………………….. 21-27
Video Case VC-21: IMC2 Brand Sustainability Map™ ………………………………………………………….. 21-29
Selected Textbook Images (Ads, People, Products, and Websites)
Chapter Opener: Photo of a Seven Cycles bicycle rider …………………………………………………………. 21-4
Applying Marketing Metrics
Sizing Up Site Stickiness at Sewell Automotive Companies: Average Time Spent per Unique
Visitor (Minutes) [See UMD21TimeSpentVisitors.xls] ………………………………………………………… 21-11
Making Responsible Decisions and Marketing Insights About Me
Marketing Insights About Me: Am I Addicted to the Internet? ……………………………………………….. 21-13
Making Responsible Decisions—Ethics: Who Is Responsible for Internet Privacy and Security? .. 21-23
Videos
21-1: My M&Ms Video ……………………………………………………………………………………………………… 21-7
21-2: Frito-Lay Video ………………………………………………………………………………………………………. 21-21
21-3: Pampers Video …………………………………………………………………………………………………………. 21-28
21-4: Pizza Hut Video Case ……………………………………………………………………………………………….. 21-28
In-Class Activity (ICA)
ICA 21-1: Buying an Automobile: Marketplace vs. Marketspace …………………………………………… 21-33

Chapter 21 – Implementing Interactive and Multichannel Marketing
21-3
LEARNING OBJECTIVES (LO)
After reading this chapter students should be able to:
LO 21-1: Describe what interactive marketing is and how it creates customer value, customer
relationships, and customer experiences.
LO 21-2: Explain why certain types of products and services are particularly suited for
interactive marketing.
LO 21-3: Describe why consumers shop and buy online and how marketers influence online
purchasing behavior.
LO 21-4: Define cross-channel consumers and the role of multichannel marketing in reaching
these consumers.
KEY TERMS
behavioral targeting
interactive marketing
bots
online consumers
choiceboard
permission marketing
collaborative filtering
personalization
cookies
showrooming
cross-channel consumer
social commerce
customerization
spam
dynamic pricing
viral marketing
eight-second rule
web communities

Chapter 21 – Implementing Interactive and Multichannel Marketing
21-4
LECTURE NOTES
SEVEN CYCLES DELIVERS JUST ONE BIKE. YOURS.
• Seven Cycles is the largest custom bicycle frame builder in the world.
• The company produces a broad range of road, mountain, cyclocross, tandem, touring,
single-speed, and commuter bikes annually; no two are alike.
• At Seven Cycles:
a. Attention is focused on each customer’s unique cycling experience through…
b. The optimum fit, function, performance, and comfort of his or her very own bike.
• The Seven Cycles website:
a. Has multiple languages.
b. Lets customers:
• Select components to complete the bike.
• Design their own bike frames.
– Uses the company’s Custom Kit™ fitting system that…
– Considers the rider’s size and riding habits.
• Monitor their bike’s progress through:
– The development and production process by…
– Clicking “Where’s My Frame?”
• This customization process and continuous feedback:
a. Makes for a collaborative relationship between:
• Seven Cycles.
• About 200 authorized dealers in U.S. and 30 distributors internationally.
• Customers in 40 countries.
b. Results in a customer experience as unique as each bike made.
• Website visitors can:
a. Peruse weekly news stories.
b. Learn about new-product introductions.
c. Read employee biographies to learn more about the people who build the bikes.
d. Channel partners can obtain updated information from a 24/7 repository.
Chapter 21 – Implementing Interactive and Multichannel Marketing
21-5
e. Interact with Seven on the Seven Cycles blog to learn about the company’s
activities and products.
f. Use its company Facebook page and Twitter account to post updates and build a
stronger sense of community around the brand.
I. CREATING CUSTOMER VALUE, RELATIONSHIPS,
AND EXPERIENCES IN MARKETSPACE [LO 21–1]
• Consumers and companies populate two market environments:
a. The traditional marketplace.
• Is where buyers and sellers engage…
• In face-to–face exchange relationships…
• In a material environment characterized by…
– Physical facilities (stores and offices) and…
– Mostly tangible objects.
b. The marketspace.
• Is an Internet-enabled digital environment characterized by…
A. Marketing Challenges in Two Environments.
• Consumers now:
a. Browse and purchase a variety of offerings in both market environments.
b. More are expected to do so in the future as smartphones and tablets proliferate.
• About 90 percent of Internet users ages 15 and older shop online in the U.S. and are
expected to spend $500 billion in products and services in 2021, totaling 11 percent
of U.S. retail sales.
• Marketing in two market environments poses significant challenges for companies.
• Legacy Companies with a traditional marketplace origin, such as P&G, Walmart, and
General Motors:
a. Are challenged to define the nature and scope of their marketspace presence.
b. Must refine the role of Internet technology to…
• Attract, retain, and build consumer relationships to…
Chapter 21 – Implementing Interactive and Multichannel Marketing
21-6
• Internet Companies with a marketspace origin, such as Amazon.com, Google,
eBay, and E*TRADE:
a. Are challenged to refine, broaden, and deepen their marketspace presence.
b. Must consider what role the traditional marketplace will play in their future.
• Regardless of origin, a company’s success in achieving a meaningful marketspace
presence:
a. Hinges on its ability to design and execute a marketing program that…
b. Capitalizes on the value-creation and relationship-building capabilities of Internet
technology in…
c. Delivering a favorable customer experience.
B. Customer Value Creation in Marketspace
• Marketers believe that the possibilities for customer value creation are greater in
the digital marketspace than in the physical marketplace.
a. In marketspace, the provision of direct, on-demand information is possible
from marketers anywhere to customers anywhere at any time (place and time
utility).
• The greatest marketspace opportunity lies in its potential for creating form utility.
a. Interactive two-way Internet-enabled communication invites consumers to tell
marketers exactly what their requirements are.
b. This makes possible the customization of a product or service to fit the
buyer’s exact needs.
C. Interactivity, Individuality, and Customer Relationships in Marketspace
• Marketers benefit from two unique capabilities of Internet technology that
promote and sustain customer relationships:
a. Interactivity. Listening and responding to consumer needs.
b. Individuality. Empowering consumers to:
• Influence the timing and extent of the buyer-seller interactions.
Chapter 21 – Implementing Interactive and Multichannel Marketing
21-7
• Have a say in:
– The kind of products and services they buy.
• Interactive marketing.
a. Involves two-way buyer-seller electronic communication in a computer-
mediated environment in which…
b. The buyer controls the kind and amount of information received from the
seller.
c. Is characterized by choiceboard and personalization systems.
d. Transforms customers’ supplied information into customized responses to
their individual needs.
1. Choiceboards.
a. A choiceboard:
• Is an interactive, Internet-enabled system that…
• Allows individual customers to design their own products and services by:
– Answering a few questions.
[Video 21-1: My M&Ms Video)]
• Collects precise information about a buyer’s preferences and behaviors.
• Enables a firm to become more knowledgeable about customers to better
anticipate and fulfill their needs.
• Is essentially a transaction technology.
b. Collaborative filtering:
• Is a process that:
– Automatically groups people with similar buying intentions,
preferences, and behaviors.
– Predicts future purchases.
• Gives marketers the ability to make a dead-on sales recommendation to a
buyer in real time.
• Example: Amazon’s “Customers who bought this (item) also bought ….”
2. Personalization.
Chapter 21 – Implementing Interactive and Multichannel Marketing
21-8
a. Choiceboards and collaborative filtering are marketer-initiated efforts to
provide customized responses to the needs of individual buyers.
b. Personalization systems are typically buyer-initiated efforts.
c. Personalization:
• Is the consumer-initiated practice of generating content on a marketer’s
website that…
• Is custom-tailored to an individual’s specific needs and preferences.
d. Permission marketing:
• Is the solicitation of a consumer’s consent (called “opt-in”) to:
– Receive e-mail and advertising…
• Is a proven vehicle for building and maintaining customer relationships.
e. Companies that employ permission marketing adhere to three rules:
• Make sure opt-in customers only receive information that is relevant and
meaningful to them.
• Ensure customers are given the option to opt out or change the kind,
amount, or timing of information sent to them.
D. Creating an Online Customer Experience
• An ongoing challenge for companies is to:
a. Design and execute marketing programs that…
b. Capitalize on the customer value-creation capabilities of Internet technology.
• Companies realize that simply applying Internet technology to create time, place,
form, and possession utility is not enough.
• The quality of the customer experience produced is the standard for a meaningful
marketspace presence.
• Customer experience.
a. Is the sum total of the interactions that a customer has with a firm’s website.
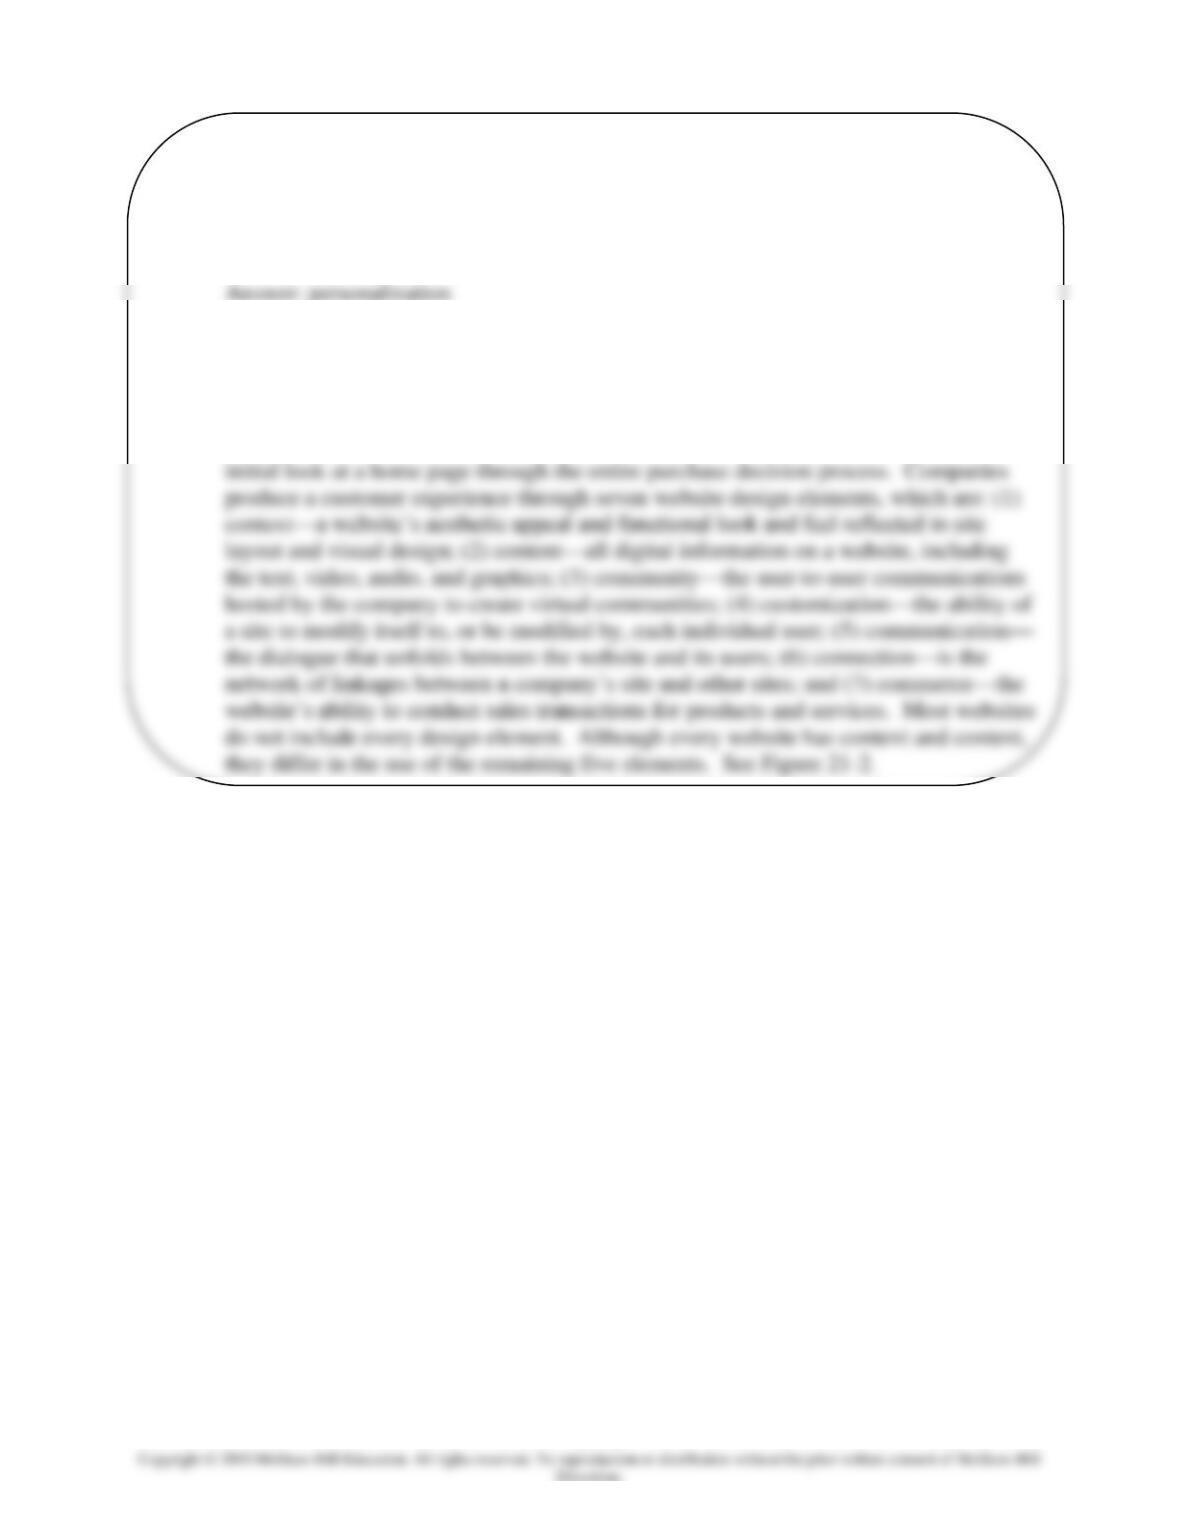
• [Figure 21-1] Seven website design elements are used to produce a customer
experience:
Chapter 21 – Implementing Interactive and Multichannel Marketing
21-9
1. Context.
• Refers to a website’s:
– Aesthetic appeal.
– Functional look and feel.
2. Content.
• Applies to all digital information on a website.
• Includes the text, video, audio, and graphics to engage a website visitor.
3. Customization.
• Is the ability of a website to modify itself or be modified by each user.
4. Connection.
• Is the network of linkages between a firm’s website and other sites.
• These links:
– Are embedded in the website.
– Appear as highlighted words, a picture, or graphic.
5. Communication.
• Refers to the dialogue that unfolds between the website and its users.
6. Community.
Chapter 21 – Implementing Interactive and Multichannel Marketing
21–10
7. Commerce.
• Is the website’s ability to conduct quick and simple sales transactions.
• In well-designed websites, online transactions are quick and simple.
• Amazon:
– Has mastered this design element with “one–click shopping,” which…
– Is a patented feature that allows users to order products with a single
mouse click.
• Although every website has context and content, they differ in the remaining five
elements based on its purpose.
a. Websites that emphasize the actual sale of products and service only include
the commerce element.
• Companies:
a. Use a broad array of measures to assess website performance such as…
b. The amount of time per month visitors spend on their website, or “stickiness,”
to…
c. Gauge customer experience.

Chapter 21 – Implementing Interactive and Multichannel Marketing
21–11
APPLYING MARKETING METRICS
Sizing Up Site Stickiness at Sewell Automotive Companies
Average Time Spent per Unique Visitor (Minutes)
Automotive dealerships commonly measure website performance by tracking visits,
visitor traffic, and “stickiness”—the amount of time per month visitors spend on their
website. To gauge stickiness, companies monitor the average time spent per unique visitor
(in minutes) on their websites. This is done by tracking and displaying the average visits per
monthly unique visitor and the average time spent per visit in minutes. This information is
displayed on a marketing dashboard and is shown below:
Average Time Spent per
Unique Visitor (minutes)
=
Average Visits per Monthly
Unique Visitor
×
Average Time Spent per
Visit (minutes)
[See UMD21TimeSpentVisitors.xls]
Your Challenge.
To assess whether the recent improvements in the company’s website has increased
the amount of time per month visitors spend on the website.
Your Findings.
The monthly marketing dashboard traffic and time measures are displayed below for
June 2016, three months before the website improvements (green arrow), and June 2017,
three months after the improvements were made fired arrow). The average time spent per
unique monthly visitor increased from 8.5 minutes in June 2016 to 11.9 minutes in June
2017—a sizeable jump. The increase is due primarily to the upturn in the average time spent
per visit from 7.1 minutes to 8.5 minutes. The average number of visits also increased, but
the percentage change was much less.
Your Actions.
Improvements in the website have noticeably “moved the needle” on average time
spent per unique visitor. Still, additional action may be required to increase average visits
per monthly unique visitor, such as:
• Analyze Sewell’s Internet advertising program and search engine initiatives with
Google.
• Assess the links to automobile manufacturer corporate websites.
• Broaden print and electronic media advertising.
Chapter 21 – Implementing Interactive and Multichannel Marketing
21–12
LEARNING REVIEW
21-1. The consumer-initiated practice of generating content on a marketer’s website
that is custom tailored to an individual’s specific needs and preferences is called
__________.
21-2. Companies produce a customer experience through what seven website design
elements?
Answer: From an interactive marketing perspective, customer experience is defined as
the sum total of the interactions that a customer has with a company’s website, from the
II. ONLINE CONSUMER BEHAVIOR AND
MARKETING OPPORTUNITIES AND PRACTICE
• Who are online consumers and what do they buy?
• Why and when do they choose to shop and purchase products in marketspace rather
than or in addition to the marketplace?
• Answers to these questions have a direct bearing on marketspace marketing practices.
A. Who is the Online Consumer?
• Online consumers:
a. Are the subsegment of all Internet users who…
b. Research products and services and…
c. Make purchases.
d. Are equally likely to be women and men.
e. Are more educated, younger, and more affluent than the general U.S.
population.
Chapter 21 – Implementing Interactive and Multichannel Marketing
21–13
f. Observe the 80/20 Rule:
• 20 percent of online consumers…
• Account for 69 percent of total consumer online sales.
g. Women tend to purchase more products and services online than men.
h. Online consumers use a range of information and communication
technology to express themselves online and engage the marketspace.
MARKETING INSIGHTS ABOUT ME
Am I Addicted to the Internet? Answer 20 Questions to Find Out.
B. What Consumers Buy Online [LO 21-2]
• Much still needs to be learned about online consumer purchase behavior.
a. Research has documented the most frequently purchased products and
services bought online.
b. Marketers also need to know why these items are popular in the digital
marketspace.
• [Figure 21-2] Six general offering categories account for over 70 percent of
online consumer buying:
a. Items for which:
• Product information is an important part of the purchase decision but…
• Prepurchase trial is not necessary (computers, electronics, and books).
b. Items for which audio or video demonstration is important (CDs and DVDs).
c. Items that can be delivered digitally (computer software, books, music, and
video).
d. Unique items (collectibles, specialty products, and gifts).
e. Regularly purchased items for which convenience is important (groceries).
Chapter 21 – Implementing Interactive and Multichannel Marketing
21–14
f. Highly standardized products and services for which information about price
is important (small appliances, casual apparel, and toys).
C. Why Consumers Shop and Buy Online [LO 21-4]
• Why do consumers shop and buy online? Marketers emphasize:
a. The customer value-creation possibilities.
[ICA 21-1: Buying an Automobile: Marketplace vs. Marketspace]
• [Figure 21-2] Consumers refer to six reasons why they shop and buy online:
1. Convenience.
a. Online shopping and buying is convenient. Consumers:
• Can visit a given retailer to browse and order products.
• Don’t have to deal with traffic, long aisles, and store checkout lines.
b. Online consumers can use bots, which:
• Are electronic shopping agents or robots that…
• Comb websites to compare prices and product or service features.
c. To remain source of customer value creation:
d. The eight-second rule is a view that customers will abandon their efforts to
enter and navigate a website if download time exceeds eight seconds.
e. The more clicks and pauses between clicks required to access information or
make a purchase, the more likely a customer will exit a website.
2. Choice. Has two dimensions:
a. Choice exists in the product or service selection offered to consumers.
• Buyers desiring selection can avail themselves of numerous websites…
• For almost anything they want.
b. Choice assistance through interactive Internet-enabled technologies.
• Invites customers to engage in an electronic dialogue with marketers.
Chapter 21 – Implementing Interactive and Multichannel Marketing
21–15
c. Carefully designed search capabilities permit consumers to review products
by brand and particular items.
3. Customization. Some customers prefer one-of-a-kind items that fit their specific
needs:
a. Customization:
• Arises from Internet-enabled capabilities that…
b. Customerization:
• Is the growing practice of:
– Customizing a product or service.
4. Communication.
a. The communication capabilities of Internet-enabled technologies take 3 forms:
• Marketer-to-consumer e-mail notification.
• Consumer-to-marketer buying and service requests.
• Consumer-to-consumer chat rooms, instant messaging, and social
networking websites (Twitter and Facebook).
b. The interactive communication capabilities of Internet-enabled technologies:
• Increase convenience.
c. Communication promotes the development of company-hosted and
independent web communities—websites that:
• Allow people to congregate online and…
Chapter 21 – Implementing Interactive and Multichannel Marketing
21–16
• Exchange views on topics of common interest.
d. The web log or blog:
• Is a web page that serves as a publicly accessible personal journal for an
individual or an organization.
e. Spam.
• Is communications that take the form of electronic junk mail or unsolicited
e-mail.
• Comprises 67 percent of all e-mail messages in the world.
• Has led to online services to:
– Institute policies and procedures to…
– Prevent spammers from spamming their subscribers.
• Has led to the:
– Passage of The Controlling the Assault of Non-Solicited Pornography
and Marketing Act (2004) or CAN-SPAM, which…
– Restricts information collection and unsolicited e-mail promotions on
the Internet.
f. Internet-enabled communication also makes possible buzz:
• Is a popular term for word-of-mouth behavior in marketspace.
g. Viral marketing:
• Is an Internet-enabled promotional strategy that…
[Video 21-2: Frito-Lay Video]
h. There are three approaches to viral marketing:
• Embed a message in the product or service so that customers hardly
realize they are passing it along.
• Make the website’s content so compelling that viewers share it with
others.
• Offer incentives (discounts, free merchandise, etc.) for referrals.
21–17
5. Cost.
a. Is the same price or cheaper online than in retail stores.
b. Has given rise to showrooming:
• Occurs when a shopper:
– Visits a retail store to inspect merchandise but then…
– Goes online to compare prices from other retail and online sellers to
attempt to make the best purchase.
• Shoppers:
– Use showrooming for pricing time-sensitive, scarce, and out-of-date
items.
– Are motivated to obtain a lower prices for an item.
• About half of U.S. online shoppers engage in showrooming.
• The most popular showrooming product categories are consumer
electronics, apparel, books, and home appliances.
c. Dynamic pricing.
• Is the practice of changing prices for products and services in real time in
response to supply and demand conditions.
• Is a form of flexible pricing.
d. Reduces a consumer’s cost of external information search, which…
• Includes the time spent and the hassle of shopping.
• Is one reason why online shopping is popular among women who work
outside the home.
6. Control.
a. Consumers want control over their online shopping behaviors as they:
• Seek information and evaluate alternatives.
b. Some online consumers are concerned about privacy and security—a 7th “C.”
7. Cookies.
Chapter 21 – Implementing Interactive and Multichannel Marketing
21–18
a. Are computer files that a marketer can…
• Download onto an online shopper’s computer and mobile phone who…
• Visits the marketer’s website.
b. Allow the marketer’s website to:
• Record a user’s visit.
c. Contain product preferences, personal data, passwords, and credit card
numbers visitors provide.
d. Make possible customized and personalized content.
e. Make possible the practice of behavioral targeting, in which:
• Marketers use information provided by cookies…
• For directing online advertising from marketers to…
• Shoppers whose behavioral profiles suggest they would be interested in it.
MAKING RESPONSIBLE DECISIONS
Ethics: Who Is Responsible for Internet Privacy and Security?
Privacy and security are two key reasons why consumers are leery of online shopping
and buying. Many consumers have stopped shopping a website or forgone an online
purchase because of these concerns. Industry analysts estimate that over $30 million in
e-commerce sales are lost annually due to these concerns from online shoppers.
According to the Federal Trade Commission, 46 percent of fraud complaints are
Internet related, costing consumers $560 million each year. In addition, consumers lose
millions of dollars each year due to identity theft resulting from breaches in company
D. When and Where Consumers Shop and Buy Online
• Shopping and buying happen at different times in marketspace than in the
traditional marketplace.