Chapter 2
Analyzing Financial Statements
and Ratios
Chapter Overview
I. Introduction
II. Accounting basics
III. Financial statements
a. The balance sheet
IV. Financial ratios
a. Liquidity
i. Current ratio
ii. Quick/acid-test ratio
b. Asset management
i. Total asset turnover ratio
V. Conclusion
Key Concepts
When reading this chapter, students should focus on the following key concepts:
1. The balance sheet, income statement, and statement of cash flows are vital tools to be
used by financial managers.
2. How to interpret data contained in financial statements.
Concept Check Responses
1. What is a T-account and how is it utilized in double-entry bookkeeping?
A T-account is a visual tool that tracks individual accounts by using a ledger to separate
2. What are the three major sections of the balance sheet? Provide at least one example of
an item that would be found under each of those sections.
The three sections of the balance sheet are Assets, Liabilities, and Owners’, or
3. What is the primary difference between an income statement and a statement of cash
flows?
The income statement shows revenues coming in to and expenses going out of an
4. What is the purpose of computing financial ratios?
Financial ratios provide information about the condition and performance of a
5. If an organization’s current ratio value is below 1.00, what might that suggest about the
organization?
A current ratio value below 1.00 suggest that an organization is unable to cover its debts
6. What information do leverage ratios provide?
Leverage ratios show how a company finances its operation with debt and equity. An
7. Why is the price-to-earnings ratio so widely used among investors?
The price-to-earnings, or P/E, ratio gives an estimate of how much money investors will
8. This chapter repeatedly states that financial ratios are most valuable when viewed in
comparison to the organization’s historical ratio values as well as to competitors. Why is
this context valuable when examining financial ratio values?
Successful organizations evaluate themselves both internally and externally. From a
Response to Practice Problem
Students will have the option to choose a competitor to Nike. We will be using Under
Armour’s financial statements for the example ratio calculations: The ten financial ratios
discussed in the chapter were calculated as shown below:
1. Current ratio = Current assets
Current liabilities
2. Quick ratio = (Current assets – inventory)
Current liabilities
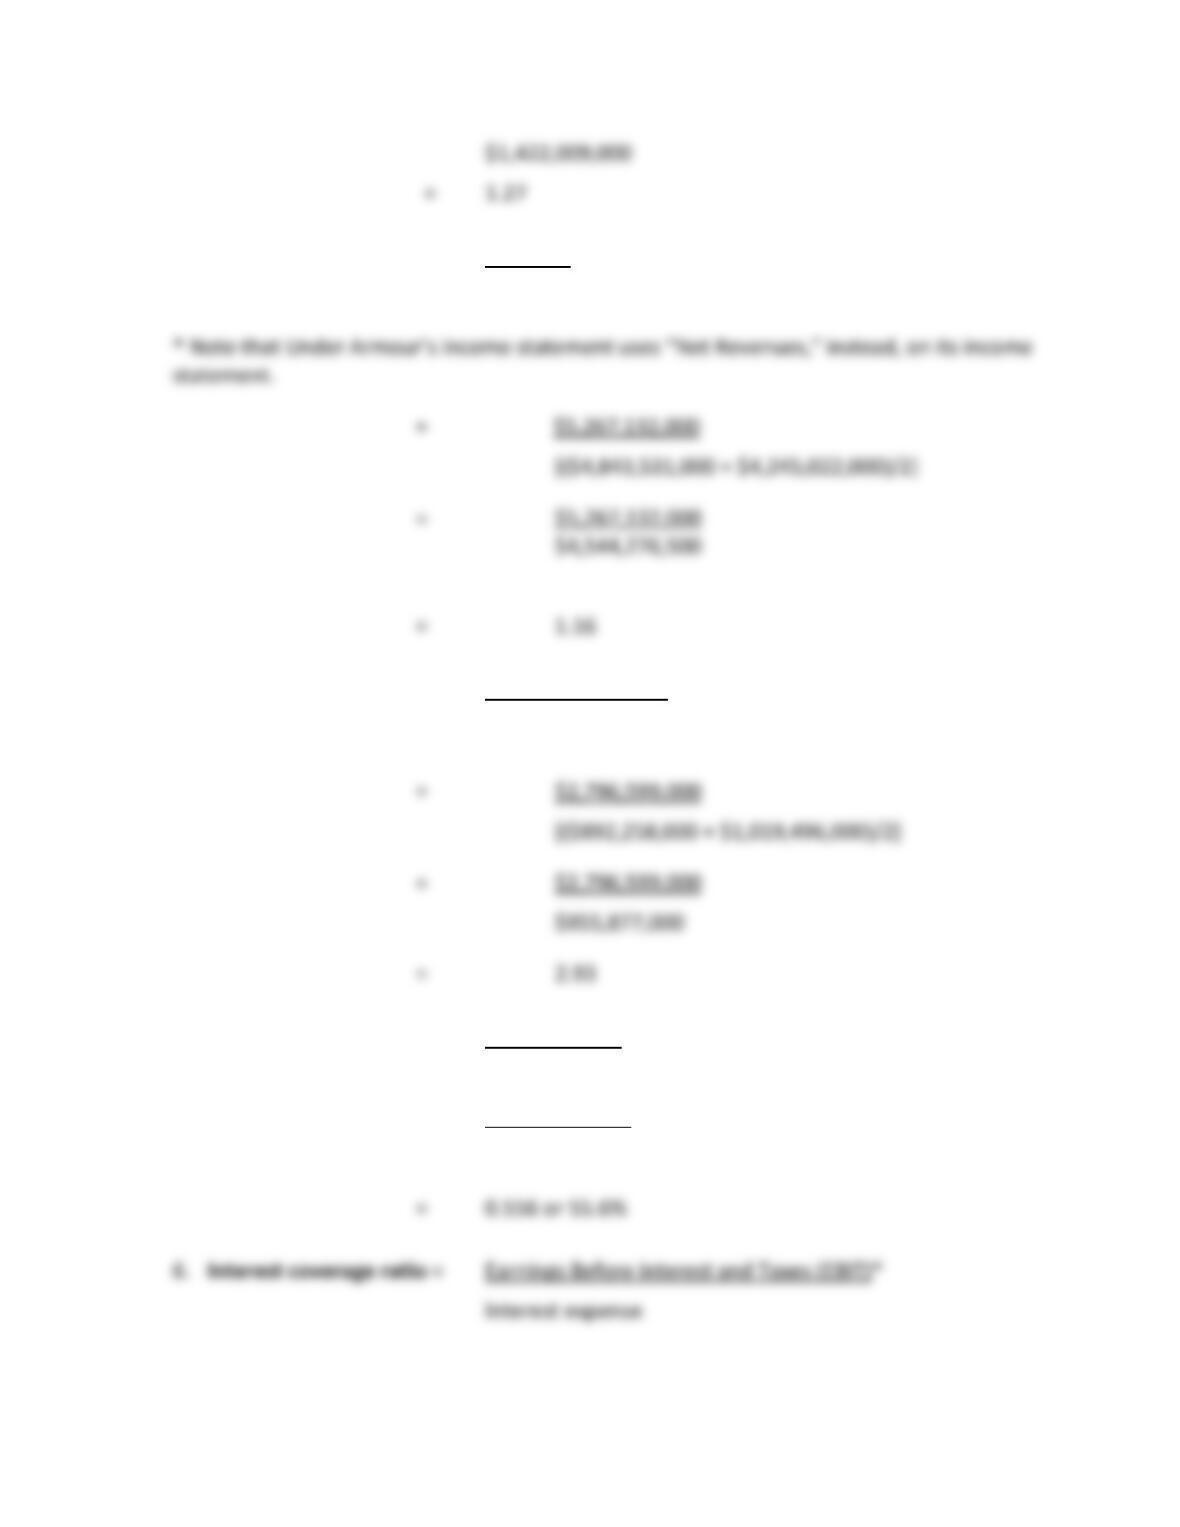
3. Total asset turnover ratio = Net sales*
Average total assets
4. Inventory turnover ratio = Cost of goods sold*
Average inventory
5. Debt ratio = Total liabilities
Total assets
= $2,693,444,000
$4,843,531,000
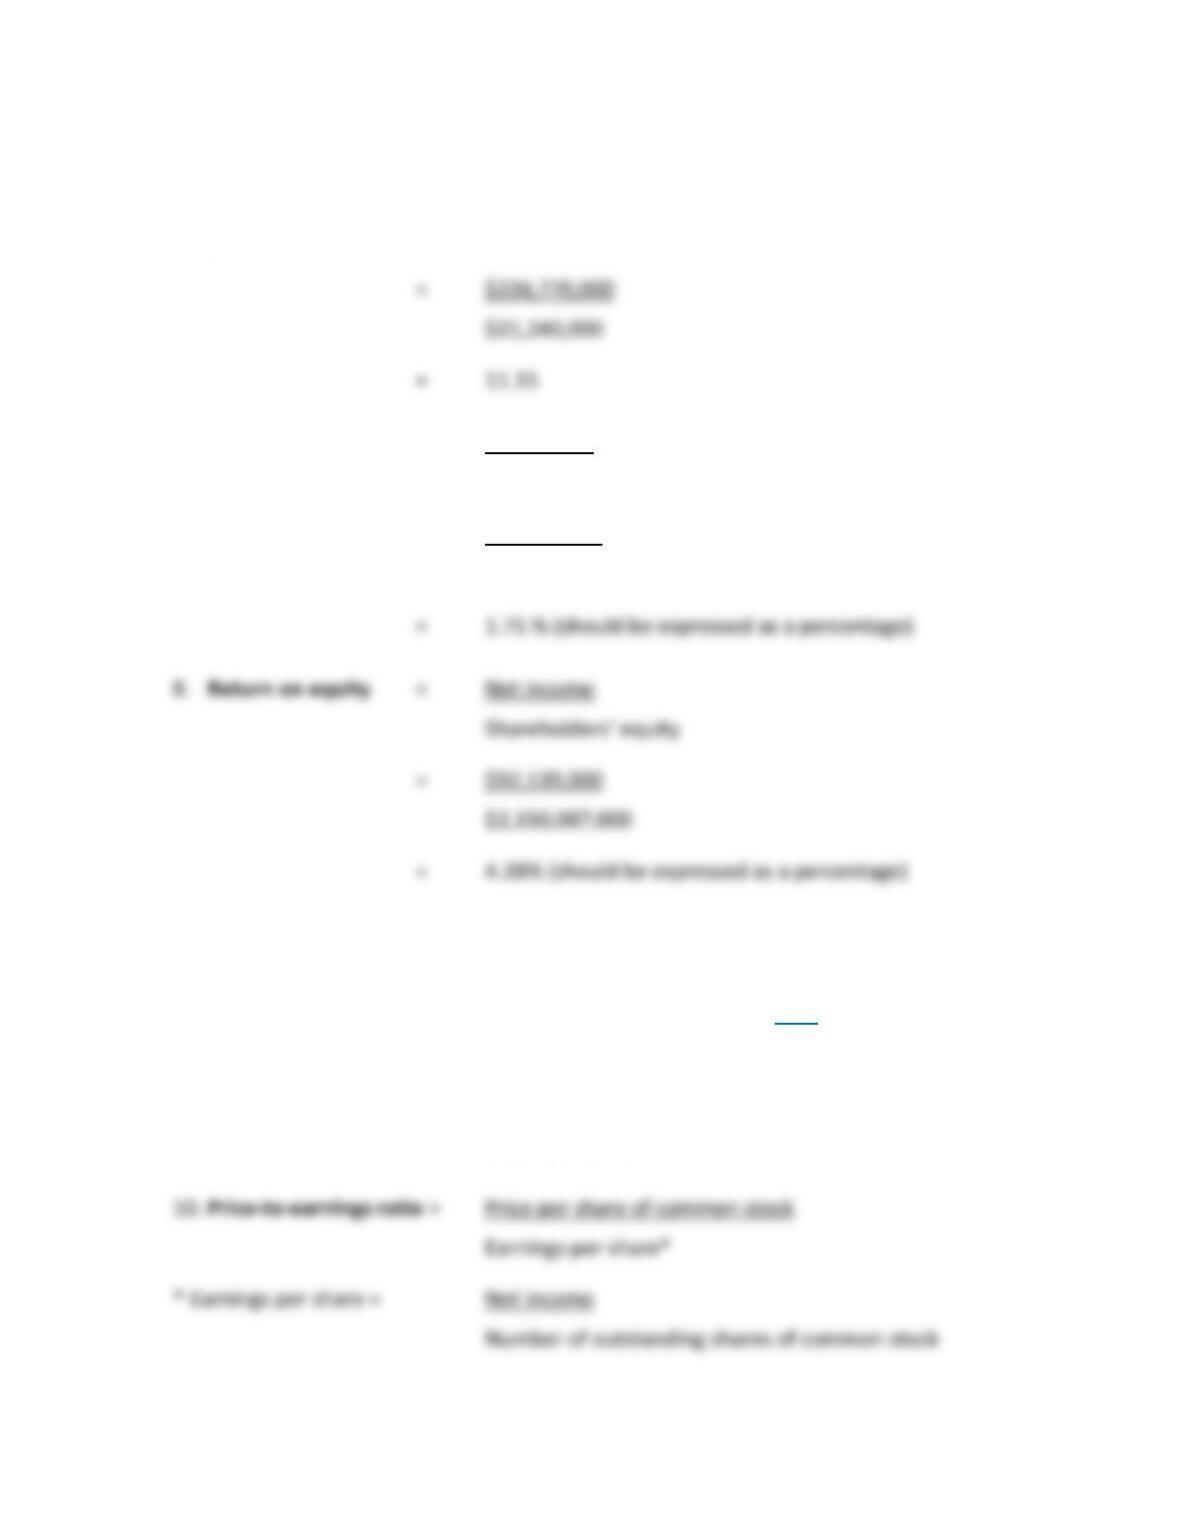
* On Nike’s income statement, EBIT is not directly provided. It must be self-calculated by
using the Gross Margin figure and subtracting the subsequent expenses not related to
interest or taxes, which here represent the four lines/values immediately below Gross
Margin.
7. Net profit margin = Net income
Sales
= $92,139,000
$5,267,132,000
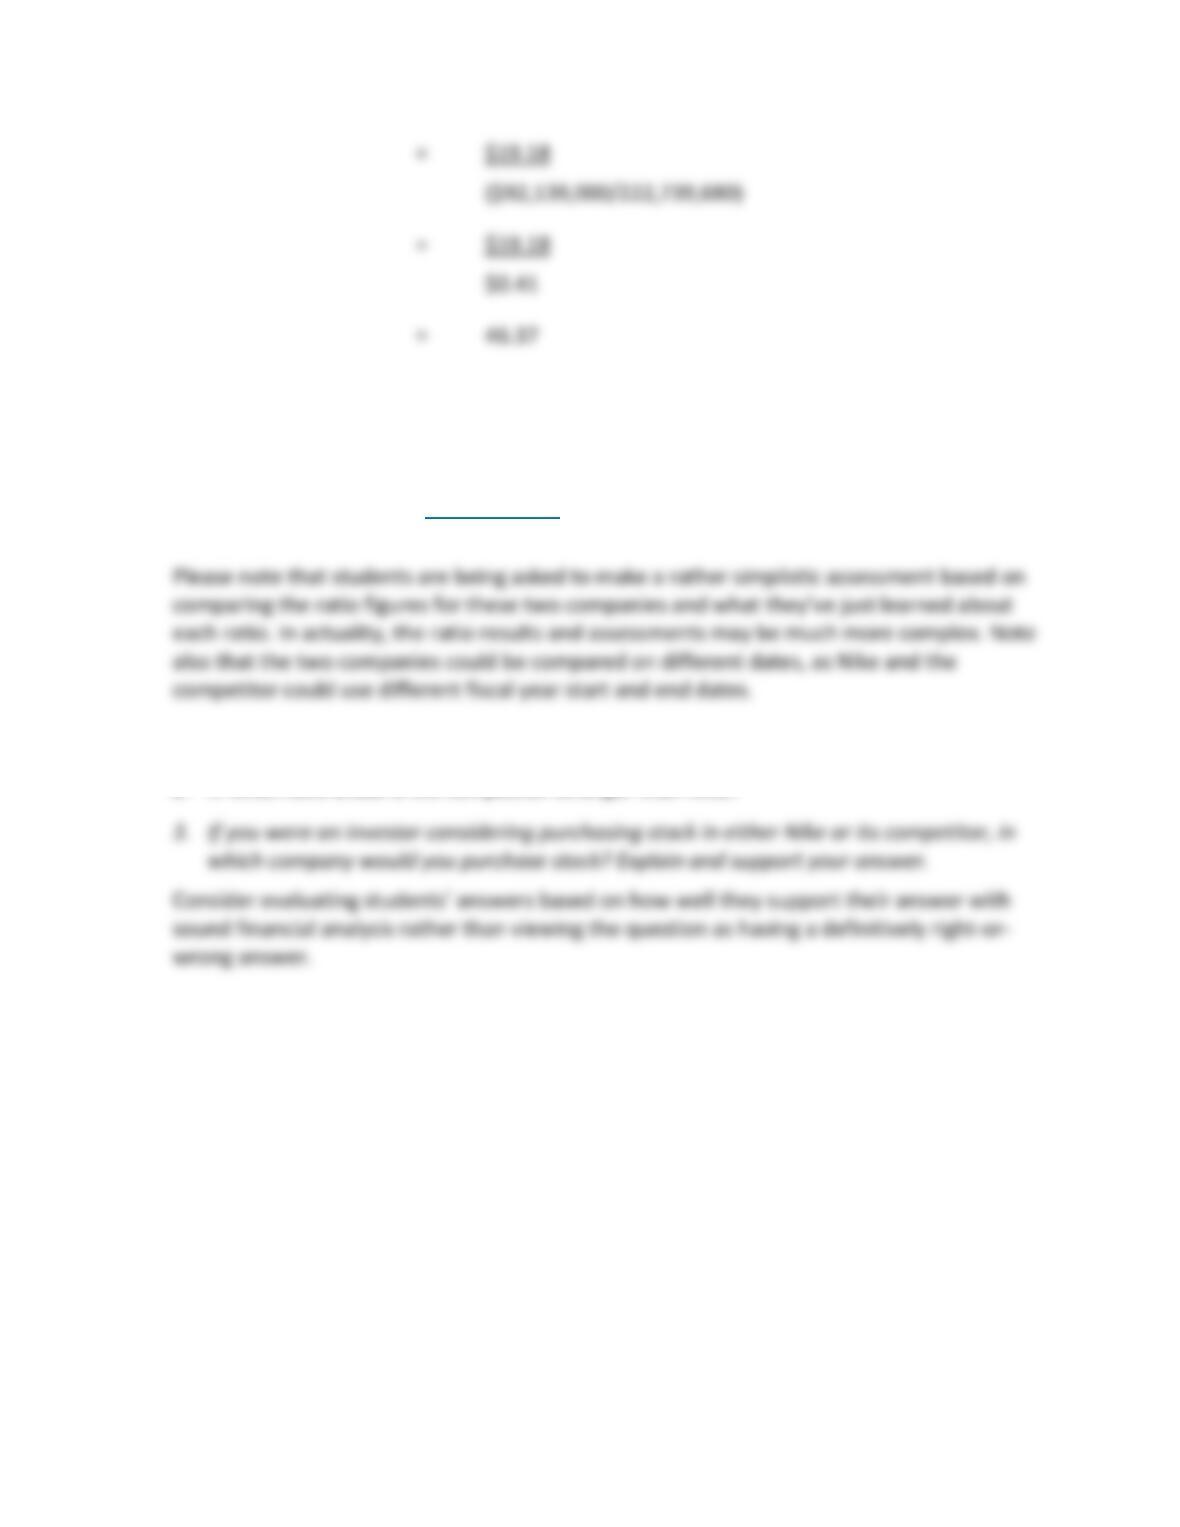
9. Market value= Price per share of common stock number of outstanding
shares*
* The number of shares of outstanding common stock is found here. Per Yahoo Finance,
the price per share finished at $19.18 (188,289,680 + 34,450,000 = 222,739,680).
= $19.18 222,739,680
= $4,272,147,062
Responses to Case Analysis Questions
The case study at the end of the chapter asks students to compare the financial health of
Nike and a competitor based on the ten financial ratios discussed in the chapter. For the
competitor we will look at Under Armour; students have access to Nike’s financial ratios in
the chapter.
1. In what ratio areas is Nike stronger than its competitor?
2. In what ratio areas is the competitor stronger than Nike?