4.1 Why are so many companies adopting yield management systems?
A yield management system is a technique for adjusting prices so that unused capacity is filled. YMS are very
4.2 Explain the relationship between supply and demand and yield management systems.
Students’ answers will vary.
4.3 Why is targeting technology so effective?
5.1 Your firm has based its pricing strictly on cost in the past. As the newly hired marketing manager, you
believe this policy should change. Write the president a memo explaining your reasons.
Although students’ answers will vary, they should address some of these points: Prices determined strictly on the
5.2 Why is it important for managers to understand the concept of break-even points? Are there any
drawbacks?
The advantage of break-even analysis is that a firm can quickly discover how much it must sell to cover costs and
6.1 Divide the class into teams of five. Each team will be assigned a different grocery store from a different
chain. (An independent is fine.) Appoint a group leader. The group leaders should meet as a group and pick
fifteen nationally branded grocery items. Each item should be specifically described as to brand name and
size of the package. Each team will then proceed to its assigned store and collect price data on the fifteen
items. The team should also gather price data on fifteen similar store brands and fifteen generics, if possible.
Each team should present its results to the class and discuss why there are price variations between stores,
national brands, store brands, and generics.
As a next step, go back to your assigned store and share the overall results with the store manager. Bring
back the manager’s comments and share them with the class.
6.2 How does the stage of a product’s life cycle affect price? Give some examples.
Demand factors and competitive conditions tend to change as a product moves through the different stages of its
Chapter 19 ♦ Pricing Concepts 19–13
6.3 Go to Priceline.com. Can you research a ticket’s price before purchasing it? What products and services are
available for purchase? How comfortable are you with naming your own price? Relate the supply and
demand curves to customer-determined pricing.
Student answers will vary as to their comfort with naming their own price. Periodically, Priceline.com changes the
Supplemental Exercise: Group Work
Review and Applications
Review and Application Question 6.1 lends itself well to group work. For this activity, divide the class into small
groups of 4-5 people. Students from each group should read the question and then use their textbooks, or any work
that was completed previously, to perform the exercise. Then each group should discuss or present its work to the
class.
APPLICATION EXERCISES
Purpose: To have students investigate the relationship between price and quality and perceptions of quality.
Setting It Up: This exercise requires high-school algebra to calculate the price-quality coefficient. You can assign this as
an individual or group project.
This exercise was inspired by the following Great Idea in Teaching Marketing:
Vaughn C. Judd
Auburn University Montgomery
ANALYZING THE PRICE-QUALITY RELATIONSHIP
The relationship between product price and quality is more relevant to students when they analyze it using “third
party data.” Food product ratings in Cook’s Illustrated magazine provide the data for the analyses. Consumer Reports,
however, can be used as a data source if Cook’s Illustrated is not readily available. The Spearman rank correlation
coefficient, an easy statistic to calculate in class with a hand-held calculator, is used to measure the relationship.
An Example of the Process
Step 1: Students are grouped in teams of two or three. Each team is given a reprint of a different food review from
Cook’s Illustrated magazine, and a worksheet which is equivalent in form to Table 1, but with only the column headings.
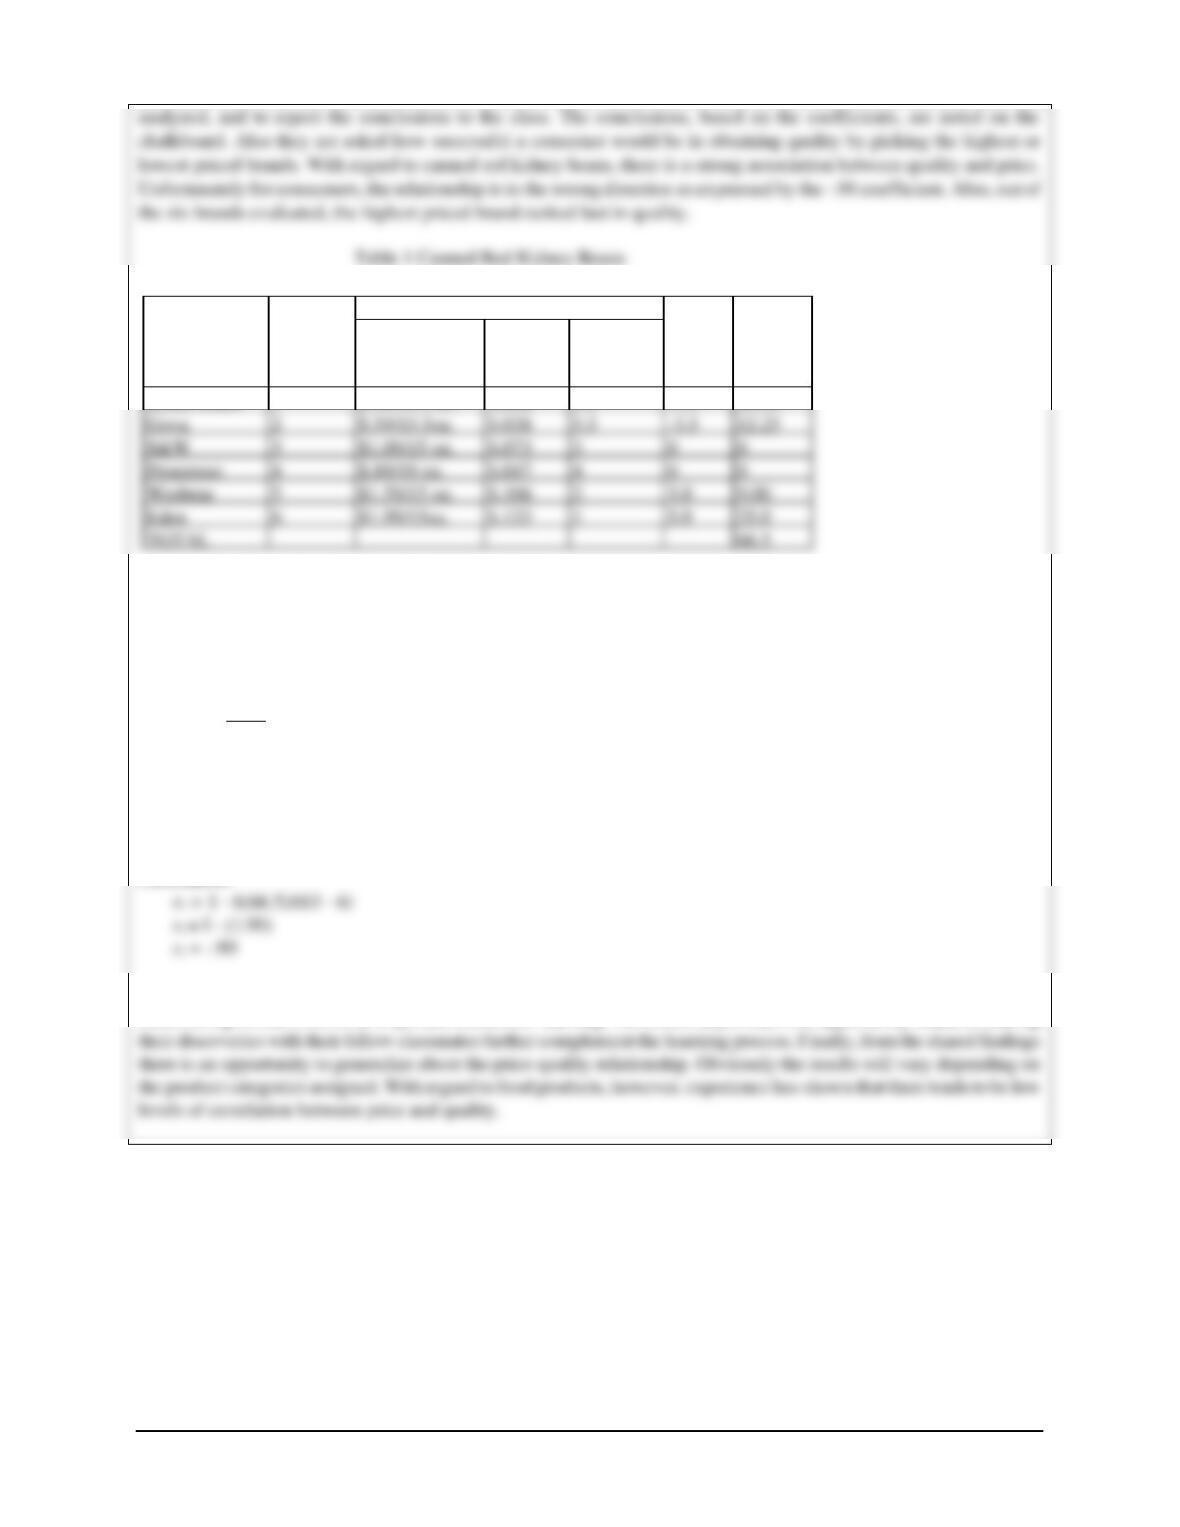
Step 2: The example, Table 1, is based on ratings of six brands of canned red kidney beans. Students list the brands
in column 1, and the rank order of quality in column 2-the best quality being ranked number one. Although there are no
19–14 Chapter 19 ♦ Pricing Concepts
(1)
Brand
(2)
Quality
Rank
(y)
Price
(6)
d
(y–x)
(7)
d 2
(3)
Price/Wt.
(4)
*Price per
Unit
(5)
Price Rank
(x)
Green Giant
1
$.59/15.5 oz.
$.038
5.5
-4.5
20.25
Goya
2
$.59/15.5oz.
$.038
5.5
-3.5
12.25
S&W
3
$.073
3
0
0
Progresso
4
$.89/19 oz.
$.047
4
0
0
Wesbrae
5
$.106
2
9.00
Eden
6
$.133
1
5.0
25.0
TOTAL
66.5
Source: Cook‘s Illustrated (September/October 1997)
*Converted to a per/ounce basis
The formula for calculating Spearman‘s rho is:
rs = 1- 6
d2
(n3 – n)
Where: rs= Spearman rank order correlation, d, = difference in rank in the paired rankings, n = number of items ranked,
and 6 = a constant in the formula.
Calculation:
Conclusion
Discovering on one’s own is an important element of learning. This exercise provides that opportunity. Students sharing
Chapter 19 ♦ Pricing Concepts 19–15
ETHICS EXERCISE
1. Should ABM maximize its profits?
Profit maximization entails setting prices so that total revenue is as large as possible relative to total costs. It is
2. Does the AMA Statement of Ethics address this issue? Go to www.marketingpower.com and review the
code. Then, write a brief paragraph on what the AMA Statement of Ethics contains that relates to ABM’s
dilemma.
MARKETING PLAN EXERCISE
The next stage of the strategic planning process – pricing – completes the elements of the marketing mix. Use the
exercises in this section to guide you through the pricing part of your strategic marketing plan.
CASE STUDY
Apple iPhone: Life in the Technology Lane
1. Which pricing objective was LivingSocial adopting with its Amazon gift card offer?
LivingSocial was adopting a market share pricing objective. Since LivingSocial bought the gift cards from
2. For a small business using a Groupon or LivingSocial, the deal itself typically would not be very
profitable. Most likely the motivation for small businesses would also be to draw new customers and
increase exposure. Some people question how effective these deals can be though for small businesses
beyond the short term bump in traffic. Do you think these deals can benefit small businesses in the long
run? If you ran a small business, would you offer deals through Groupon or LivingSocial? Why or why
not?
LESSON PLAN FOR VIDEO
Company Clips
Segment Summary: Acid+All = Serious Pricing
As long as people have stomachaches, companies will sell remedies. Acid+All is banking that America will
continue is love affair with bad food and has made an interesting move into the antacid market. The tiny pills come
packaged in a tin priced at $3.89, which clearly sets the product apart from competitors like Rolaids, Tums, and
others. The gambit of staking out a position as a prestige product is high. Watch the video to see what issues
helped forged the $3.89 unit price and if the company has been successful at this price point.
1. How do the product, place, and promotion elements of Acid+All’s marketing mix influence the pricing strategy
the company has chosen?
2. Would you expect demand for Acid+All to be elastic? Why or why not?
Students’ answers may vary, but must be supported. The demand for Acid+All is inelastic because:
3. What role do the product life cycle, competition, and perceptions of quality play in Acid+All’s suggested retail
price?
As the advertising representative in this segment says, “premium products command premium prices”. Acid+All’s
4. Would you buy Acid+All for the $3.89 retail price? Why or why not?
Students’ answers will vary. Some students would argue that if they had an upset stomach or heartburn, a less costly
Supplemental Exercise: Video
Company Clips
Pre-Class Prep for You:
• Preview the Company Clips video segment for Chapter 19. This exercise reviews concepts for LO1-LO6.
Chapter 19 ♦ Pricing Concepts 19–17
• Have students review and familiarize themselves with the following terms and concepts: importance of pricing
decisions; pricing objectives; demand determinant of price; cost determinant of price; competitive determinant of
price; and prestige pricing.
• Have students bring written definitions of three of the above terms or concepts to class.
Video Review Exercise Activity
• Warm-up
o Briefly discuss the terms that students brought to class, and have them offer some examples of companies
they to which they can apply those concepts.
• In-Class Preview
the video segment.
• Follow-up
o Divide students into groups of 3-5 and have them figure out a way to apply a yield management system
(YMS) to Acid+All’s business model. Give them about 5 to 10 minutes to come up with a solution, and,
time permitting, have them share their ideas with the class.
19–18 Chapter 19 ♦ Pricing Concepts
Supplemental Exercise: Class Activity
Retail Price Comparison
To demonstrate to students the wide variation in pricing of an identical item, ask them to visit three different stores and
compare prices on similar items.
First, each student should select a category of store. Some suggestions are:
• Grocery: large chain store, local chain store, convenience store
A student who chooses to investigate clothing stores could compare the price of Levi’s 501 jeans for men at the three
different types of stores. A student who chooses health and beauty aids could compare the price of a certain brand of
shampoo (same size, weight, and so on) at the three stores. Students may come up with other categories and items of
interest.
Supplemental Exercise: Class Activity
Retail Price Comparison
Class Activity 2 – Pricing Strategies
The goal of this exercise is to make students aware of pricing strategies that local businesses may be using.
• Have your students collect price-oriented advertisements from the local newspaper. What pricing approach is
being used and why?
strategy would they say is being used?
Chapter 19 ♦ Pricing Concepts 19–19
GREAT IDEAS FOR TEACHING CHAPTER 19
Philip R. Kemp, DePaul University
SURVIVAL BARTER EXERCISE
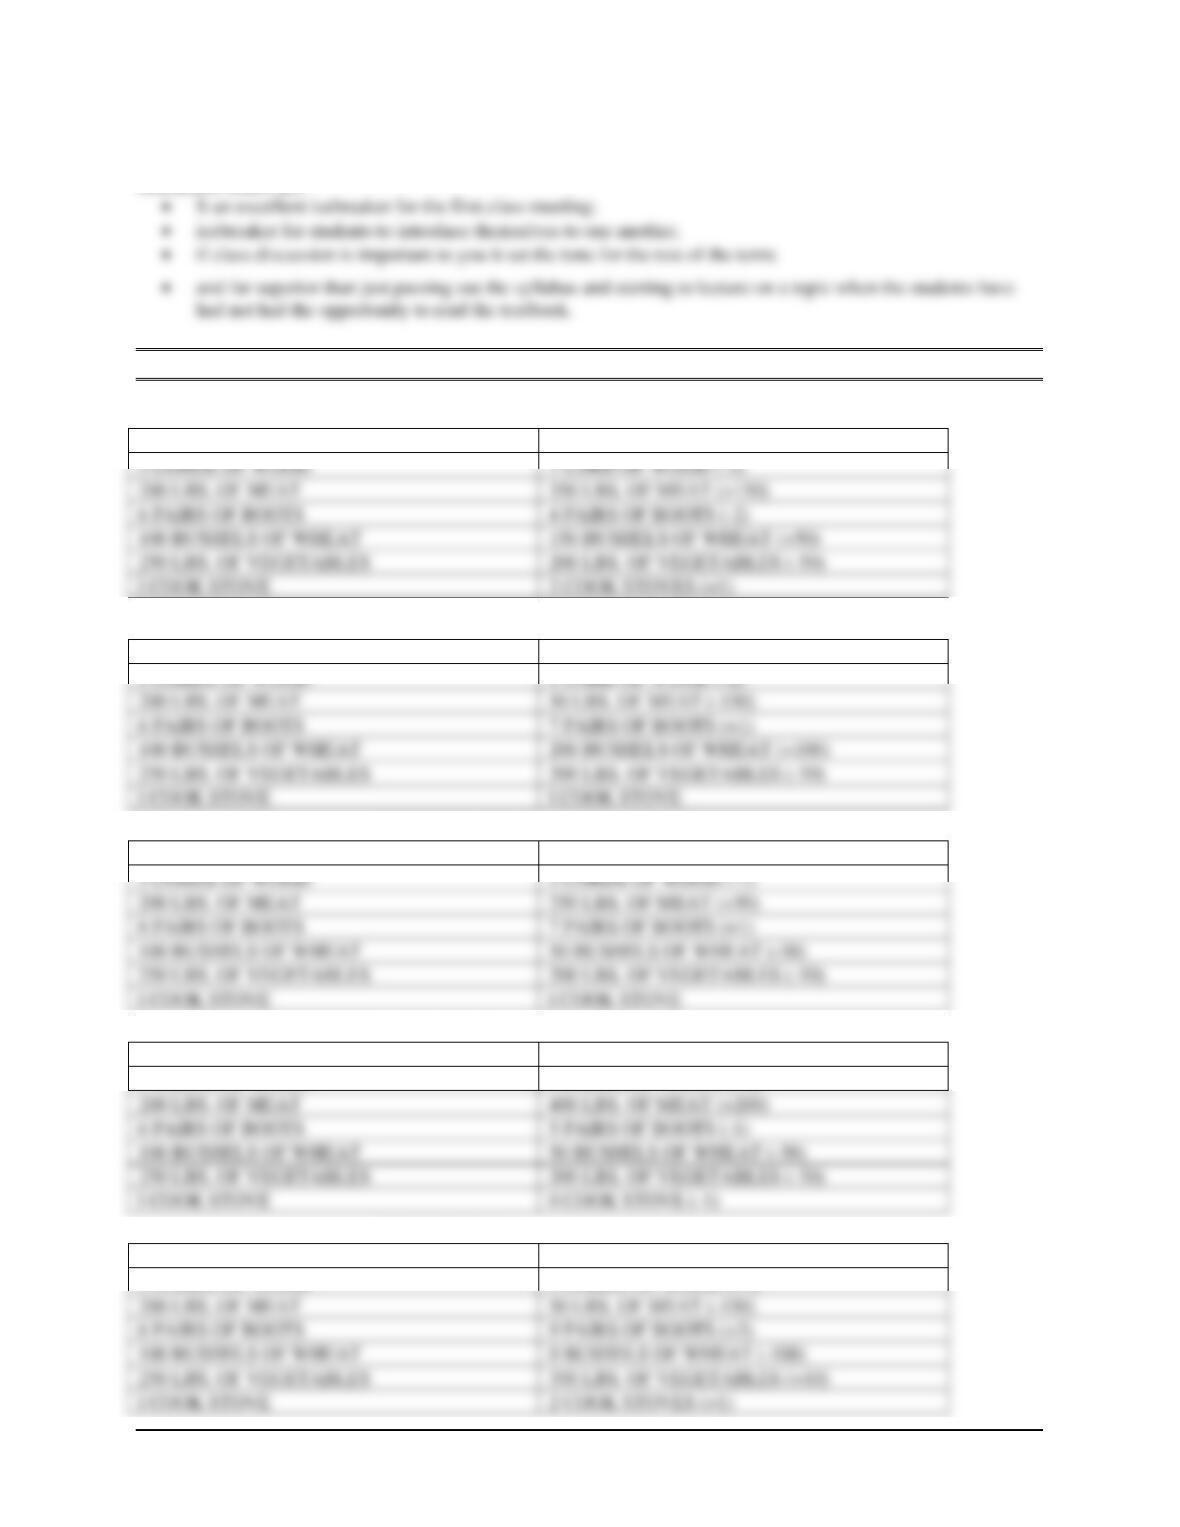
Survival is a group exercise in which student teams must use the barter system to gather the necessary items in order to
survive. Each group is given a list of six items (on a sheet of paper or index card) with the amounts of each item they
must gather to survive, see Table 1. As seen m Table 1 a team may have the exact amount, a shortage or excess of goods
in a category of what they need to survive. A team with an excess of goods in a particular category can use these excess
goods to barter for other goods.
After the teams have been formed, and the roles of bookkeeper and group observer and overall observer have been
assigned, the class is instructed that they have twenty minutes to complete the exercise. No additional assistance is
provided by the instructor. After about 20-25 minutes the exercise tends to end on its own. Hint: Move the class to an
open area or arrange the room so that desks are at the one side of the room. This will eliminate any physical barriers from
interfering with the exercise.
After the national accounts have been shown, ask this question of the class “What would have helped you to accomplish
your teams’ survival in this exercise?” The usual answers to this question are:
• better communications,
The overall exercise dynamic usually runs as follows, each team gathers in their respective groups, then one member of
the team goes to other teams to determine what they have to trade (excess products). They soon realize that sending out
one person is too slow a process. They then decide to send out other group’s members to talk to different groups to barter
their excess goods (This is the time when goods are created and lost at the Marco level).
When more than one team member is sent out of the group typically a central market forms (all the teams gather in a
section of the room, which looks like the trading floor of a commodities exchange pit). Finally, the central marketplace
disbands and the teams then reform. Using diagrams on the blackboard with circles as the groups and lines with arrows
as the trader’s one can show the exchange process that takes place in a barter market. Then add to the diagram the other
“runners” coming from each group. This diagram shows the formation of the central market, one can just use a large
19–20 Chapter 19 ♦ Pricing Concepts
circle around all six groups on the board. I have become so bold as to draw these diagrams on a flip chart and just turn
the pages as the observers describe the dynamics of the exercise. These diagrams are useful to introduce and discuss the
topics of communication (promotion), central markets and functions of middlemen. The exercise has benefits beyond
instruction which are:
TABLE 1
TEAM ONE (1)
YOU NEED THE FOLLOWING
YOU NOW HAVE THE FOLLOWING
200 LBS. OF MEAT
350 LBS. OF MEAT (+150)
6 PAIRS OF BOOTS
4 PAIRS OF BOOTS (–2)
100 BUSHELS OF WHEAT
150 BUSHELS OF WHEAT (+50)
250 LBS. OF VEGETABLES
200 LBS. OF VEGETABLES (-50)
I COOK STOVE
2 COOK STOVES (+1)
TEAM TWO (2)
YOU NEED THE FOLLOWING
YOU NOW HAVE THE FOLLOWING
3 CORDS OF WOOD
1 CORD OF WOOD (–2)
200 LBS. OF MEAT
50 LBS. OF MEAT (-150)
6 PAIRS OF BOOTS
7 PAIRS OF BOOTS (+1)
100 BUSHELS OF WHEAT
200 BUSHELS OF WHEAT (+100)
250 LBS. OF VEGETABLES
200 LBS. OF VEGETABLES (-50)
I COOK STOVE
I COOK STOVE
TEAM THREE (3)
YOU NEED THE FOLLOWING
YOU NOW HAVE THE FOLLOWING
3 CORDS OF WOOD
2 CORDS OF WOOD (-1)
200 LBS. OF MEAT
250 LBS. OF MEAT (+50)
6 PAIRS OF BOOTS
7 PAIRS OF BOOTS (+1)
100 BUSHELS OF WHEAT
50 BUSHELS OF WHEAT (-50)
250 LBS. OF VEGETABLES
200 LBS. OF VEGETABLES (-50)
I COOK STOVE
I COOK STOVE
TEAM FOUR (4)
YOU NEED THE FOLLOWING
YOU NOW HAVE THE FOLLOWING
3 CORDS OF WOOD
5 CORDS OF WOOD (+2)
200 LBS. OF MEAT
400 LBS. OF MEAT (+200)
6 PAIRS OF BOOTS
5 PAIRS OF BOOTS (–1)
100 BUSHELS OF WHEAT
50 BUSHELS OF WHEAT (-50)
250 LBS. OF VEGETABLES
200 LBS. OF VEGETABLES (-50)
I COOK STOVE
0 COOK STOVE (–1)
TEAM FIVE (5)
YOU NEED THE FOLLOWING
YOU NOW HAVE THE FOLLOWING
3 CORDS OF WOOD
3 CORDS OF WOOD (+1)
200 LBS. OF MEAT
50 LBS. OF MEAT (-150)
6 PAIRS OF BOOTS
9 PAIRS OF BOOTS (+3)
100 BUSHELS OF WHEAT
0 BUSHELS OF WHEAT (-100)
250 LBS. OF VEGETABLES
350 LBS. OF VEGETABLES (+10)
I COOK STOVE
2 COOK STOVES (+1)
Chapter 19 ♦ Pricing Concepts 19–21
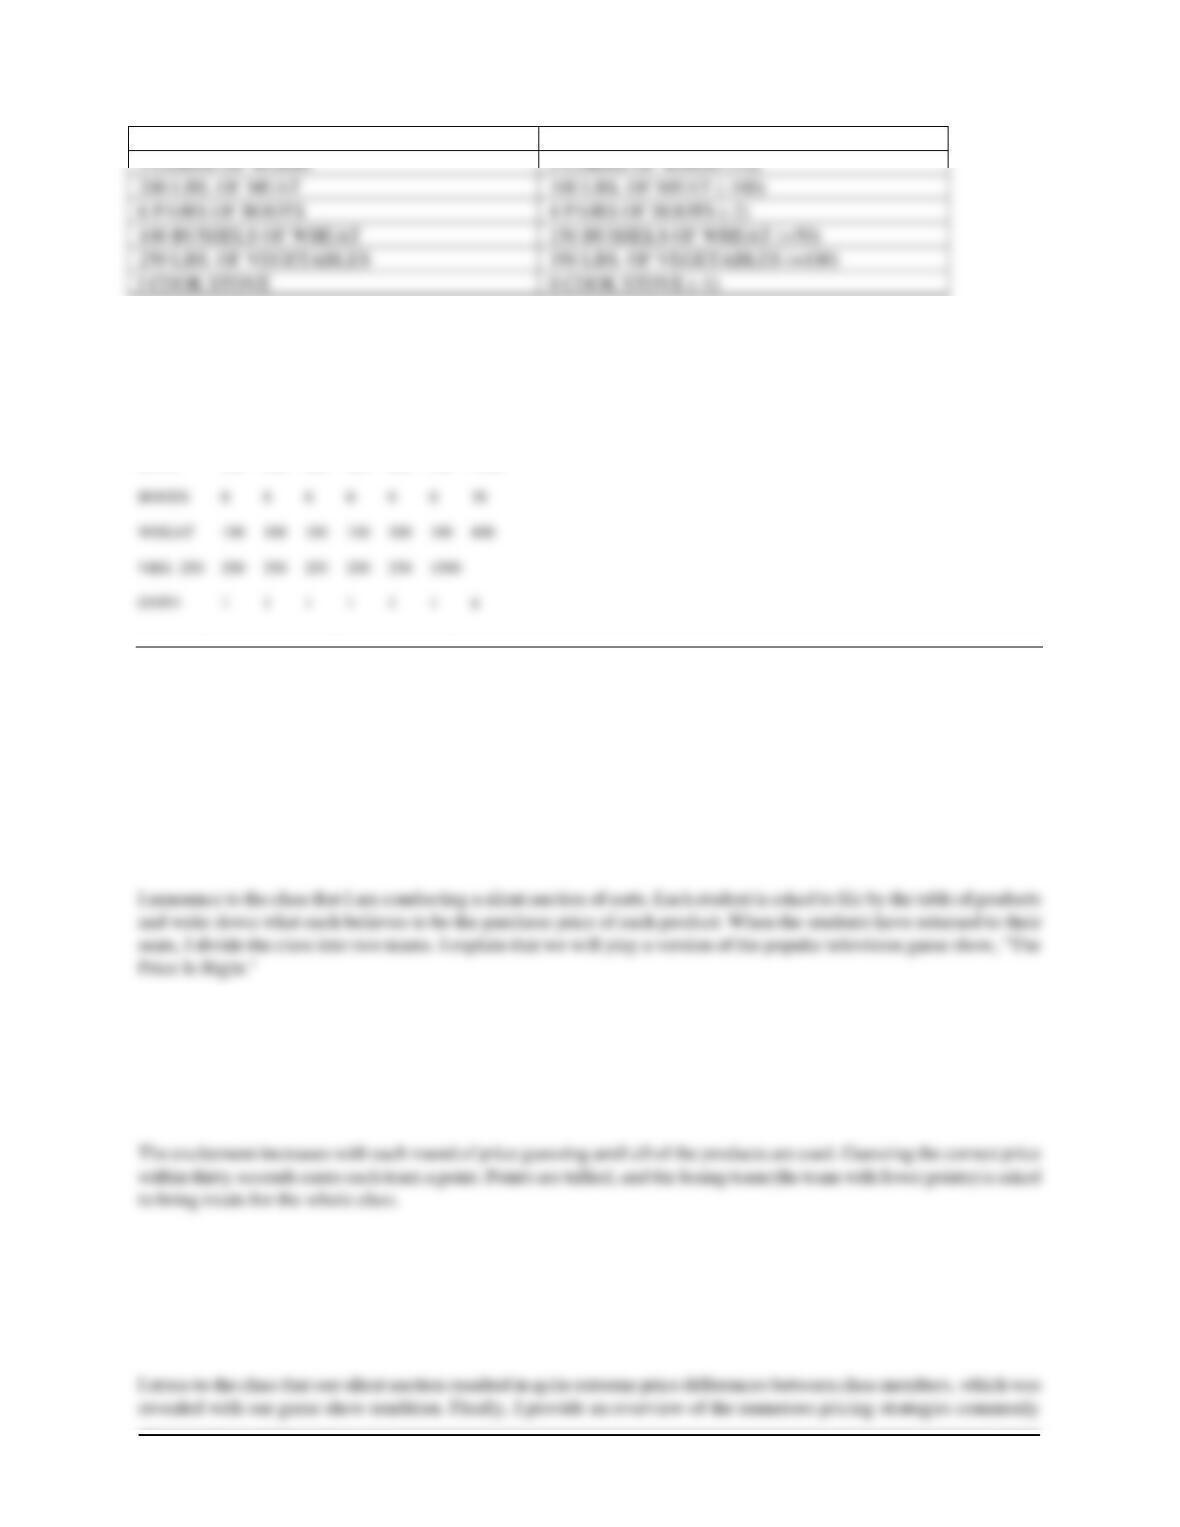
TEAM SIX (6)
YOU NEED THE FOLLOWING
YOU NOW HAVE THE FOLLOWING
NATIONAL ACCOUNTS (KEY)
TEAM 1 TEAM 2 TEAM 3 TEAM 4 TEAM 5 TEAM 6 TOTAL
WOOD 3 3 3 3 3 3 18
MEAT 200 200 200 200 200 200 1200
Laura Balus, Central Community College
PRICING … AN ART OR A MATHEMATICAL FORMULA?
To introduce the third element of the 4 P’s, pricing, I gather various products from my home and office. Some of these
products include grocery items, toys, office equipment, and computer software. Various products were ordered through a
mail-order catalog and others were beauty items purchased through a home party. All of these items are arranged on a
long table at the front of the classroom. All price tags have been removed. In preparation for this activity, I completed
small recipe cards that individually listed specifics on each product and the purchase price.
Members of each team take turns at being either the game show host or the contestant. The game show host selects one
product from the table and the accompanying recipe card of information, and then orally presents a brief description of
the product and its many uses and benefits. Then the price guessing begins. The contestant is given thirty seconds to
randomly call out prices, with the game show host responding with “higher” or “lower” until the correct price is
announced.
The activity proceeds with an explanation of how pricing is indeed a game in itself. I refer to our study of the consumer’s
“black box” and how research and creativity go hand in hand when establishing price. Indeed, mathematical pricing
formulas are used with careful planning to cover the cost of goods, overhead, and retain a profit. However, I further
explain that a price tag should not reflect wishful thinking. Pricing must revolve around the consumers’ innate sense of
value.
3 CORDS OF WOOD
5 CORDS OF WOOD (+2)
200 LBS. OF MEAT
100 LBS. OF MEAT (-100)
6 PAIRS OF BOOTS
4 PAIRS OF BOOTS (–2)
100 BUSHELS OF WHEAT
150 BUSHELS OF WHEAT (+50)
250 LBS. OF VEGETABLES
350 LBS. OF VEGETABLES (+100)
I COOK STOVE
0 COOK STOVE (–1)