Chapter Fifteen: Testing for Differences Between Groups and for Predictive Relationships 423
This test is appropriate when means that need to be compared are not from independent samples
(i.e., when the same respondent is measured twice).
c. a 2 test
8. Are t-tests or Z-tests used more often in marketing research? Why?
9. A sales force received some management-by-objectives training. Are the before/after mean
scores for salespeople’s job performance statistically significant at the 0.05 level? The results
Chapter Fifteen: Testing for Differences Between Groups and for Predictive Relationships 425
Descriptives
Att
N
Mean
Std. Deviation
Std. Error
95% Confidence Interval for Mean
Minimum
Maximum
Lower Bound
Upper Bound
Germany
24
16.07
2.797
.571
14.89
17.25
10
21
USA
26
13.32
2.225
.436
12.42
14.22
7
17
Total
50
14.64
2.851
.403
13.83
15.45
7
21
ANOVA
Att
Sum of Squares
df
Mean Square
F
Sig.
Between Groups
94.671
1
94.671
14.965
.000
Within Groups
303.664
48
6.326
Total
398.335
49
11. Interpret the following output (see the textbook for the output) examining group differences
for purchase intentions. The three groups refer to consumers from three states: Florida,
Chapter Fifteen: Testing for Differences Between Groups and for Predictive Relationships 429
RESEARCH ACTIVITIES
1. [Ethics Question/Internet Question] How ethical is it to do business in different countries
around the world? An international organization, Transparency International, keeps track of
the perception of ethical practices in different countries. Visit the Web site and search for the
latest corruption indices
(http://cpi.transparency.org/cpi2013/results/). Using the data found here, test the following
research question:
Results of these analyses will vary depending on when students collect this data and which
countries they include in the analyses. For example, corruption perception indices (CPIs) are
2. Using the retail data available in the resources for this chapter, examine the following
research questions: (1) Verizon consumers have a more favorable attitude than do AT&T
consumers. (2) Are consumers with a coupon willing to pay the same amount as are
consumers without a coupon? (3) Does the combination of store/phone brand and coupon
influence willingness to pay (WTP_ACC)? The following table contains a guide to the file.
CASE 15.1 Old School versus New School Sports Fans
Data: Students are instructed to download the data from the Web site or to request them from
the instructor.
Objective: Illustrating the analysis of a chi-square test from an SPSS computer program is the
purpose of this case.
Chapter Fifteen: Testing for Differences Between Groups and for Predictive Relationships 430
© 2016 Cengage Learning. All Rights Reserved. May not be scanned, copied or duplicated, in whole or in
part, except for use as permitted in a license distributed with a certain product or service or otherwise on a
password-protected website for classroom use.
emerges from old-fashioned American notions of the team before the player, sportsmanship and
loyalty above all else, and competition simply for the “love of the game.”
New school was measured by asking agreement with ten attitude statements. Higher scores
represent old school values. For this case the scores were grouped into high, medium, and low
groups. Case Exhibit 22.1-1 shows the SPSS output of a cross-tabulation to relate the gender of
the respondent with the New School/Old School grouping.
Questions
1. Is this form of analysis appropriate?
2. Interpret the computer output and critique the analysis.
Two-Way Frequency Table with Chi-square Test:
Purpose. Most marketing research studies investigate the relationship between demographic
variables and the variable of interest, in the case new school versus old school values.
The student should be able to interpret each particular cell. One section of the table is given here.
It shows the cell of women who score high:
9 count
This cell can be compared for men who are high on the scale. It indicates there is a very small
percentage difference between men and women. Inspection of other cells indicates that 52.9 % or
women are low but only 37.8% of men score low.
© 2016 Cengage Learning. All Rights Reserved. May not be scanned, copied or duplicated, in whole or in
part, except for use as permitted in a license distributed with a certain product or service or otherwise on a
password-protected website for classroom use.
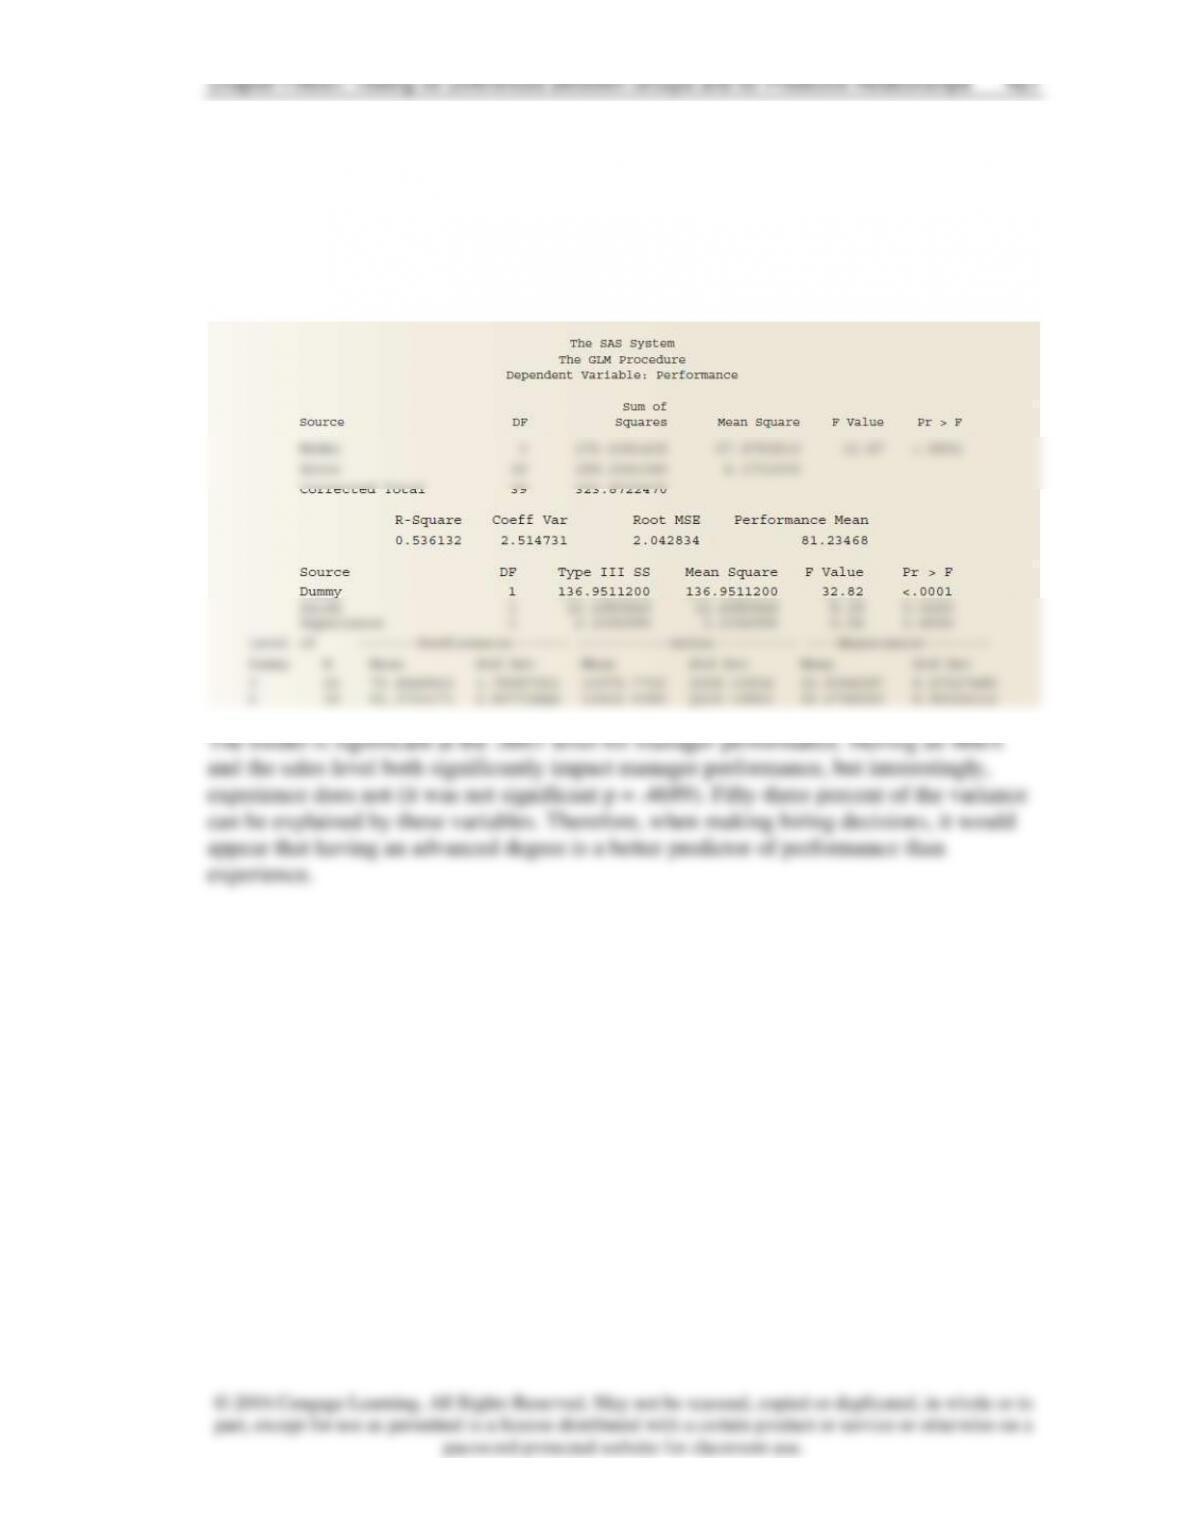
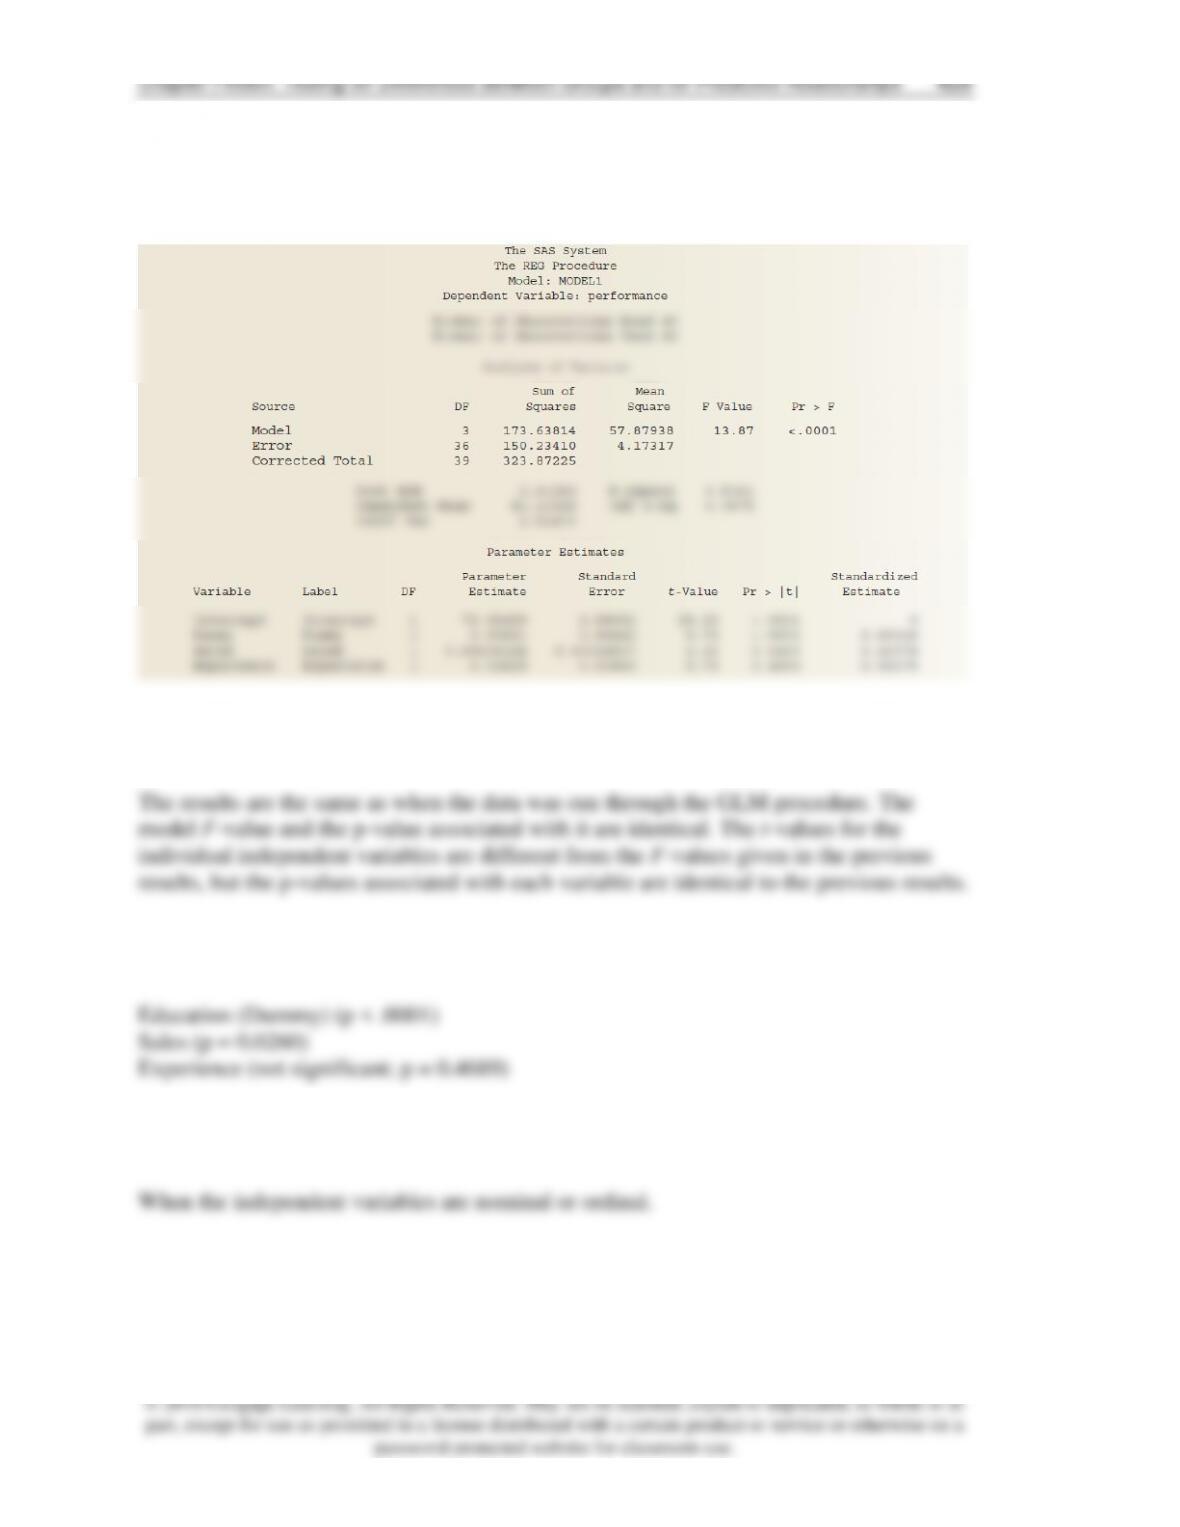
3. Explore the GLM (General Linear Model) procedure in SAS or SPSS by testing a model
using show_off as the dependent variable and gender as the independent variable (a fixed
effect in the SPSS GLM window and a class variable in SAS Proc GLM).
Descriptive Statistics
Dependent Variable:Q10 – There is no harm in showing off after a victory.
0 = Women,
1 = Men
Mean
Std. Deviation
N
0
4.6429
2.16568
84
1
5.2432
2.23370
185
Total
5.0558
2.22617
269
Tests of Between-Subjects Effects
Dependent Variable:Q10 – There is no harm in showing off after a victory.
Source
Type III Sum of Squares
df
Mean Square
F
Sig.
Corrected Model
20.824a
1
20.824
4.253
.040
Intercept
5646.103
1
5646.103
1153.112
.000
gender
20.824
1
20.824
4.253
.040
Error
1307.340
267
4.896
Total
8204.000
269
Corrected Total
1328.164
268
a. R Squared = .016 (Adjusted R Squared = .012)
CASE 15.2: International Operations at CarCare Inc.
[Note: This data set can be found in the files labeled car.sav or car.xls available at the textbook’s
Web site.]
Objective: This case allows students to practice running correlation and regression analyses.
Summary: CarCare is considering expanding its operations to other countries. The company
wants to know whether it should target countries with consumers who tend to have a positive
attitude toward their current cars. Students are asked to conduct analyses on the data gathered on
U.S. and German car owners.
Chapter Fifteen: Testing for Differences Between Groups and for Predictive Relationships 432
Questions
1. Test the hypothesis: Attitude toward one’s car is related positively to spending for car care
products.
2. Would you recommend they do more research to identify nations with relatively favorable
attitudes toward the cars they own?