Chapter 14 – Developing the Sampling Plan
I. Learning Objectives:
Upon completing this chapter, the student should be able to:
1. Explain the difference between a parameter and a statistic.
2. Explain the difference between a probability sample and a nonprobability sample.
In a probability sample, each member of the target population has a known,
3. List the primary types of nonprobability samples.
4. List the primary types of probability samples.
5. Discuss the concept of total sampling elements (TSE).
6. Cite three factors that influence the necessary sample size.
7. Explain the relationship between population size and sample size.
II. Chapter Outline:
A. Defining the Target Population
Exhibit 14.1: Six-Step Procedure for Drawing a Sample
1. Parameters versus Statistics
Exhibit 14.2: 2016 Participation Rate in Various Sports Categories
Chapter 14 – Developing the Sampling Plan
.
2
B. Identifying the Sampling Frame
Exhibit 14.3: The Relationship Between Populations and Samples
C. Selecting a Sampling Procedure
1. Nonprobability Samples
Exhibit 14.4: Classification of Sampling Techniques
2. Probability Samples
a. Simple Random Samples
D. Determining How Big a Sample You Need
1. Basic Considerations in Determining Sample Size
Manager’s Focus
3. Population Size and Sample Size
4. Other Approaches to Determining Sample Size
E. Summary
F. Key Terms
G. Review Questions
H. Appendix 14A – Basics of the Sampling Distribution
1. Derived Population
Exhibit 14A.1: Population
3. Central-Limit Theorem
Figure 14A.4: Population Distribution versus Sampling Distribution
Chapter 14 – Developing the Sampling Plan
.
3
III. Answers to Review Questions:
1. A census is a type of sampling plan in which data are collected from or about each
2. It is important to carefully define the population because that data collected from
your population will affect the subsequent steps and the results of your study.
3. A parameter is a characteristic of a population; if it were possible to take measures
4. In a probability sample, each member of the target population has a known,
nonzero chance of being included in the sample. The chances of each member of
6. The primary types of probability samples are simple random samples (p. 209),
7. A cluster sample is a probability sampling plan in which the parent population is
divided into mutually exclusive and exhaustive subsets, and a random sample of
8. Because it is rare that all of the people who have been selected to participate in a
study will do so, it is usually necessary to draw a larger pool of sample elements
.
9. In determining sample size, you must consider the desired degree of precision, the
10. Increases in desired precision, confidence, or the variation of the characteristics in
the population lead to increases in the necessary sample size.
12. One can determine sample size by taking the remaining budget of a project and
dividing it by the expected cost per contact of the method of administration, by
IV. Instruction Suggestions:
1. To set the stage for the various sampling techniques discussed in the chapter, it is
helpful to review some actual examples of sampling plans such as those employed
2. Review next the process by which a sample is selected. At this early stage in the
3. Provide students with an overview of the contents of this chapter. Then discuss the
4. Turn next to a discussion of nonprobability sampling plans covering in turn
convenience sampling, judgment sampling, and quota sampling. Although
convenience sampling and judgment sampling can be covered rather quickly, quota
.
of fulfilling a quota defined on multiple characteristics soon becomes obvious, as
does the lack of probability associated with the selection process.
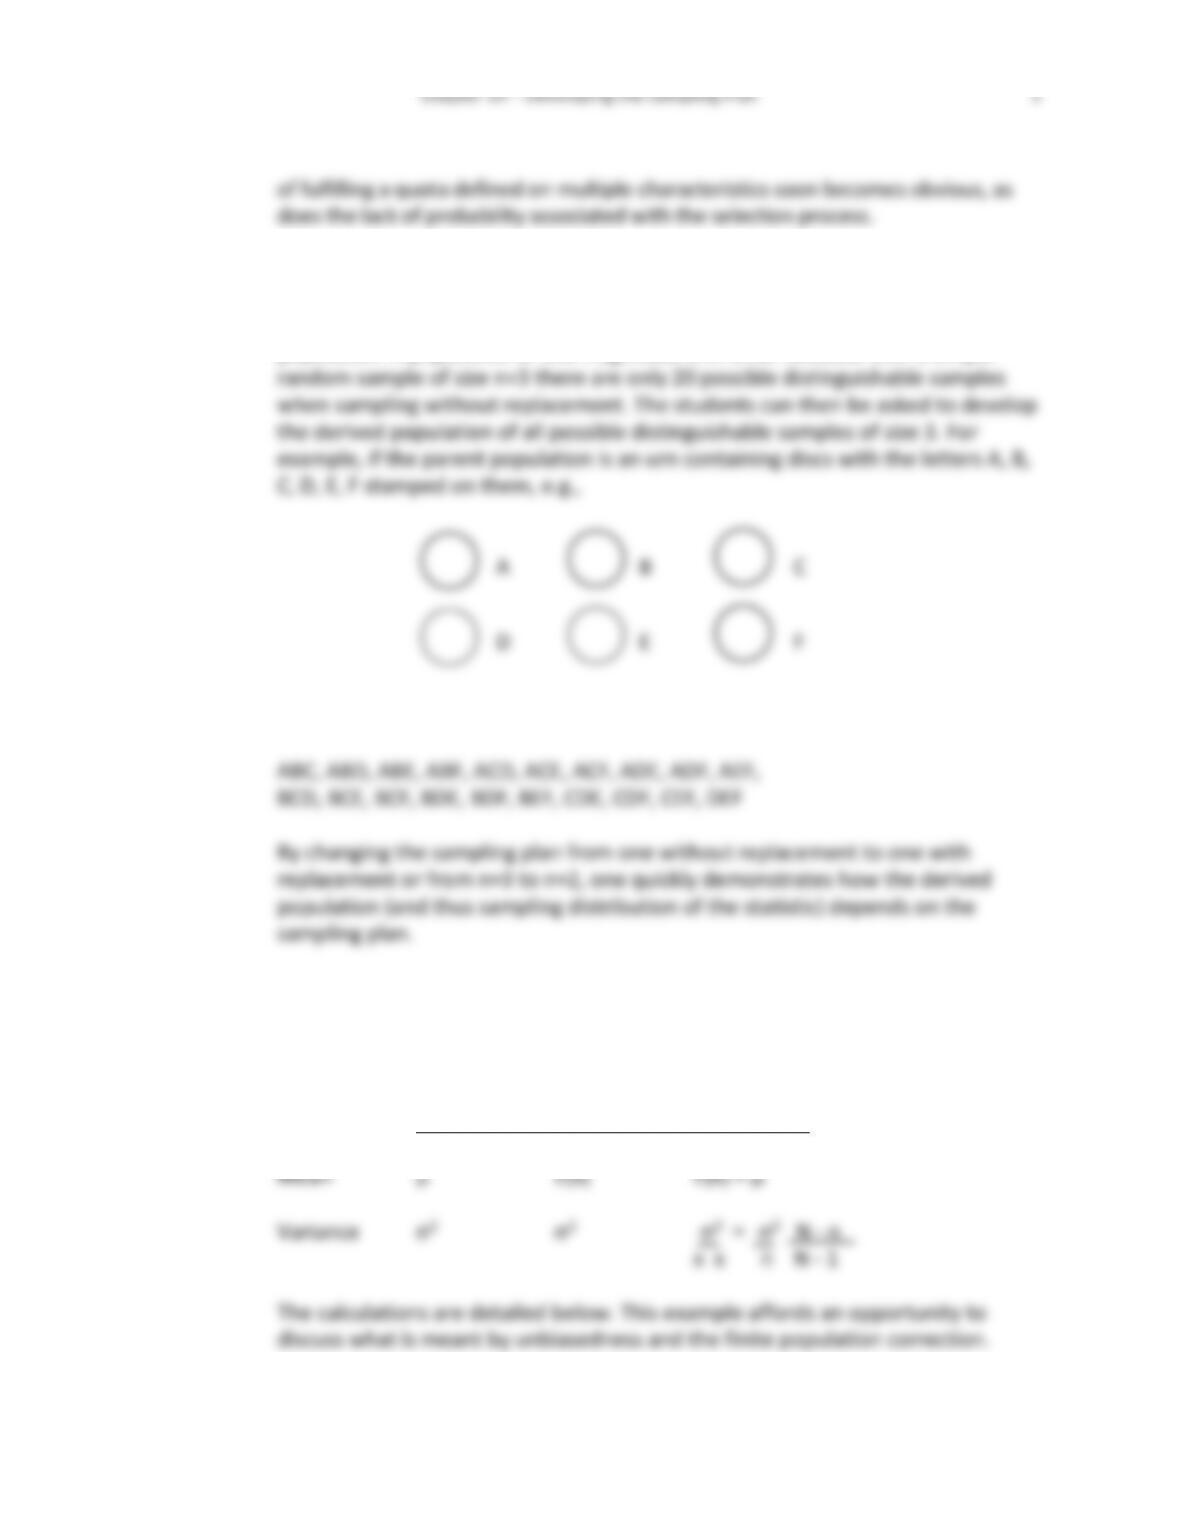
5. Employing some simplified example, e.g., a population with only six elements
from which you are considering selecting a sample of size 3, review the basic
notions of parameter versus statistic and parent population versus derived
population. A population of this magnitude is in order because with a simple
the derived population of all possible distinguishable samples is
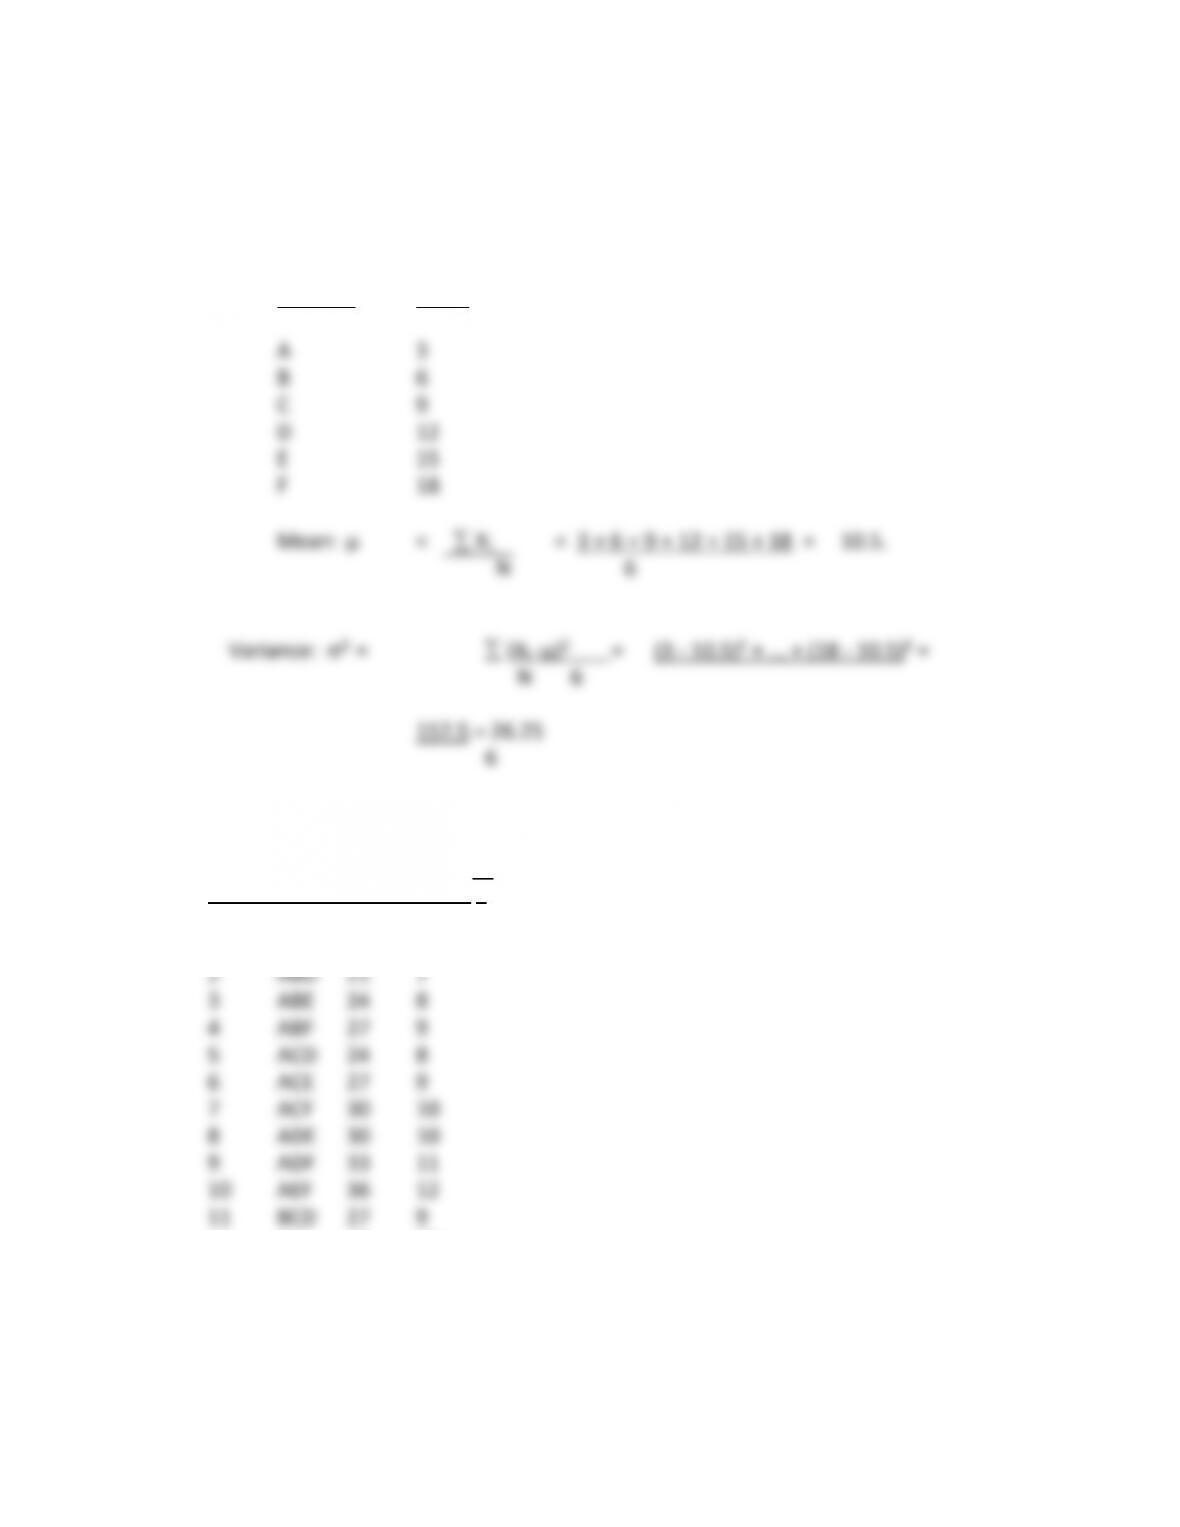
6. Employing the example above and some assumed values for the discs, e.g., A=3,
B=6, C=9, D=12, E=15, F=18, or some other simple example, review how the
parameters of the two populations are related, e.g.,
Parent Derived
Population Population Relationship
Chapter 14 – Developing the Sampling Plan
.
6
Relationship Between Parameters of Parent
Population and Derived Population
Parent Population
Element Value
Derived Population
j= Sample Total Mean xj
1 ABC 18 6
12 BCE 30 10
13 BCF 33 11
14 BDE 33 11
15 BDF 36 12
16 BEF 39 13
.
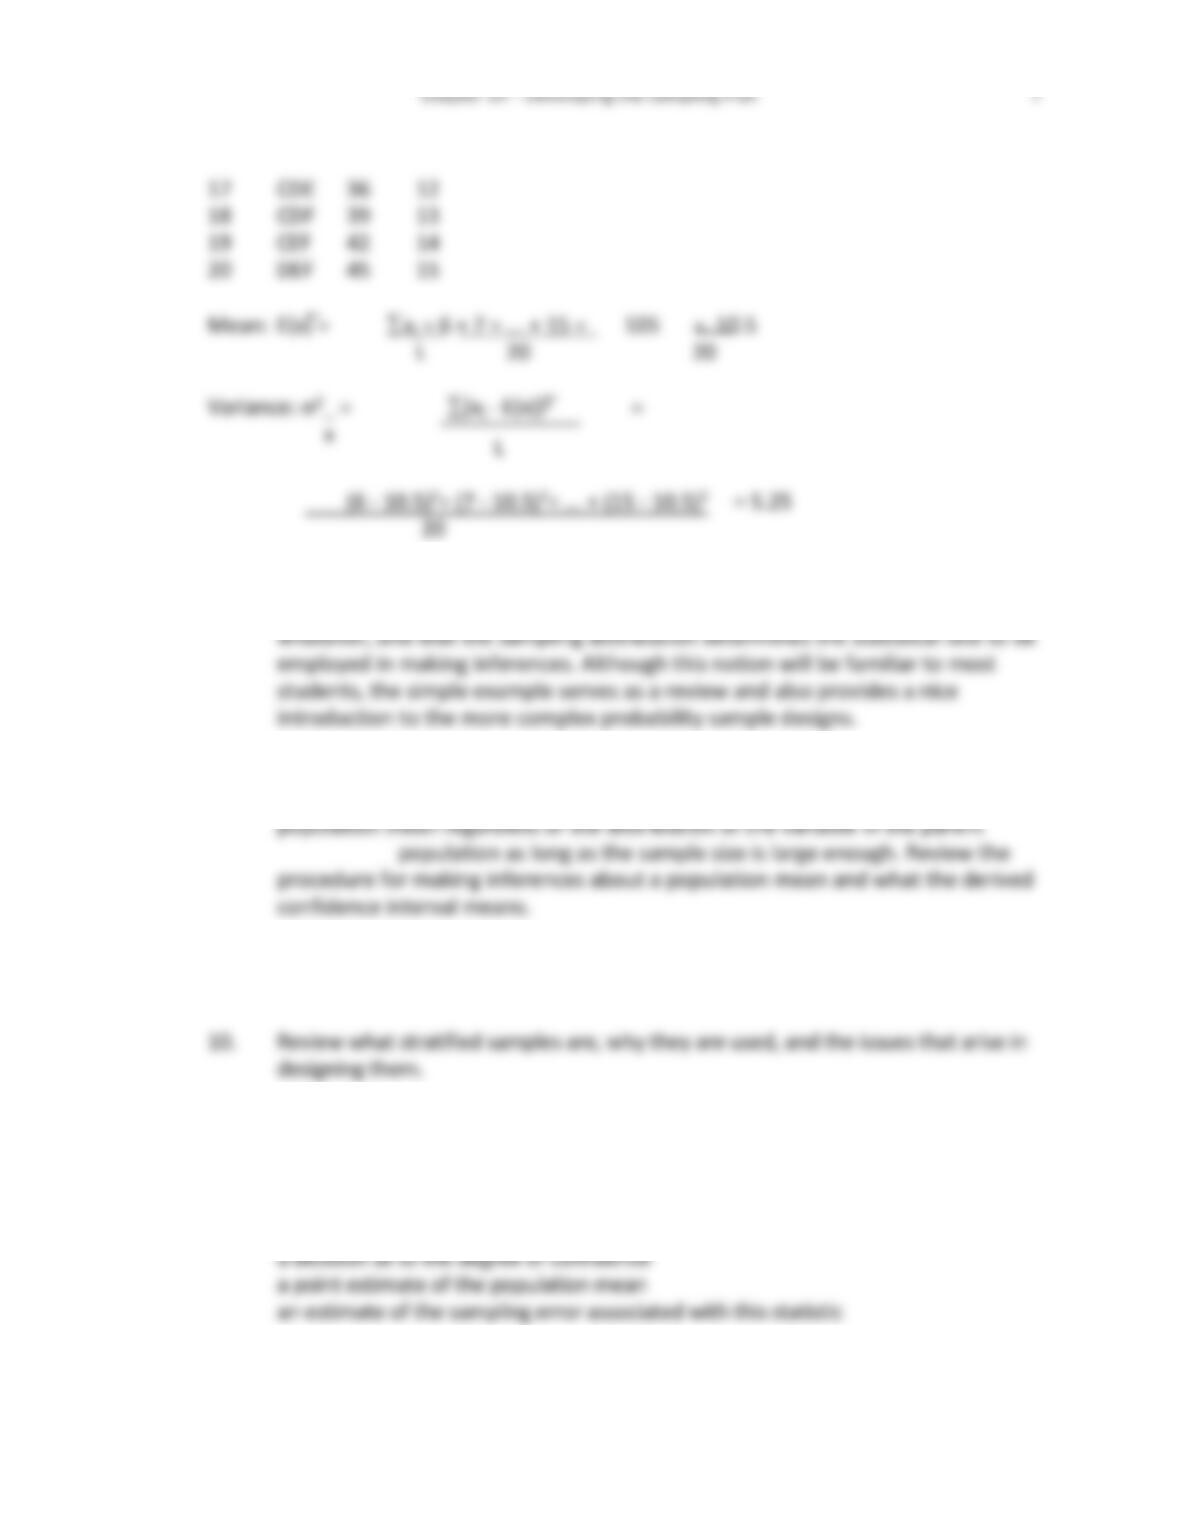
17 CDE 36 12
18 CDF 39 13
19 CEF 42 14
20 DEF 45 15
Mean: E(x) = xj = 6 + 7 + … + 15 = 105 = 10.5
L 20 20
Variance: 2_ = (xj – E(x))2 =
x L
(6 – 10.5)2+ (7 – 10.5)2+ … + (15 – 10.5)2 = 5.25
20
7. Construct the two distributions. Point out that the derived population produces
a sampling distribution of some statistic, be it a mean, variance, mode, range or
8. Using the two plotted distributions, introduce and discuss the operation of the
Central Limit Theorem and how it allows us to make inferences about a
9. Review how a simple random sample is properly drawn using a table of random
numbers.
11. Some students seem to have difficulty grasping why stratified samples produce
estimates that have smaller sampling error. For them, it is useful to illustrate how
confidence intervals are developed with stratified samples. It seems helpful to
begin simply by stating the quantities that are needed for this interval estimate:
.
The point can then easily be made that the estimates are obtained by
“appropriately weighting” the individual strata results. Using an example, the
procedure can be illustrated and the interval formed. Once the interval is formed,
the increased precision that arises with stratified samples becomes readily
apparent, particularly if the instructor illustrates what happens to s_2 , as the
individual strata are made more homogeneous. xst
12. Turn to a discussion of the two basic types of stratified samples—proportionate
and disproportionate—and emphasize the different knowledge requirements from
13. Progress to a review of the procedure for selecting a cluster sample: (a) divide the
14. It is useful here to drive home the difference between stratified and cluster
samples using a simplified example. Suppose the issue here is whether a new mass
transit system would be favorably received (i.e., used) by workers for their daily
15. Turn next to a discussion of the efficiency notions surrounding sampling, including
statistical efficiency, economic efficiency, and overall efficiency. Point out that
16. Turn then to a discussion of the systematic sample. Illustrate the generation of the
17. Introduce and emphasize the basic principle underlying area sampling—a target
group for which a list of population elements is not readily available (e.g., an up-to–

.
elements, which is readily available in the form of areas on a map so that a
probability sample can be selected.