Chapter Thirteen: Big Data Basics: Describing Samples and Populations
Variable = SPEED; country speed limit – MPH
56|**
70|*
81|*
87|*
5. Why is the standard deviation rather than the average deviation typically used?
The average deviation always equals zero. Hence, the average deviation must be manipulated so
that we have a quantitative index reflecting the distribution’s spread or variability. By squaring
6. Calculate the sample standard deviation for the data in question 2.
X (𝑿 − 𝑿 ) (𝑿 − 𝑿 )𝟐
87 18.85 355.32
75 6.85 46.92
75 6.85 46.92
70 1.85 3.42
62 -6.15 37.82
886 1175.66
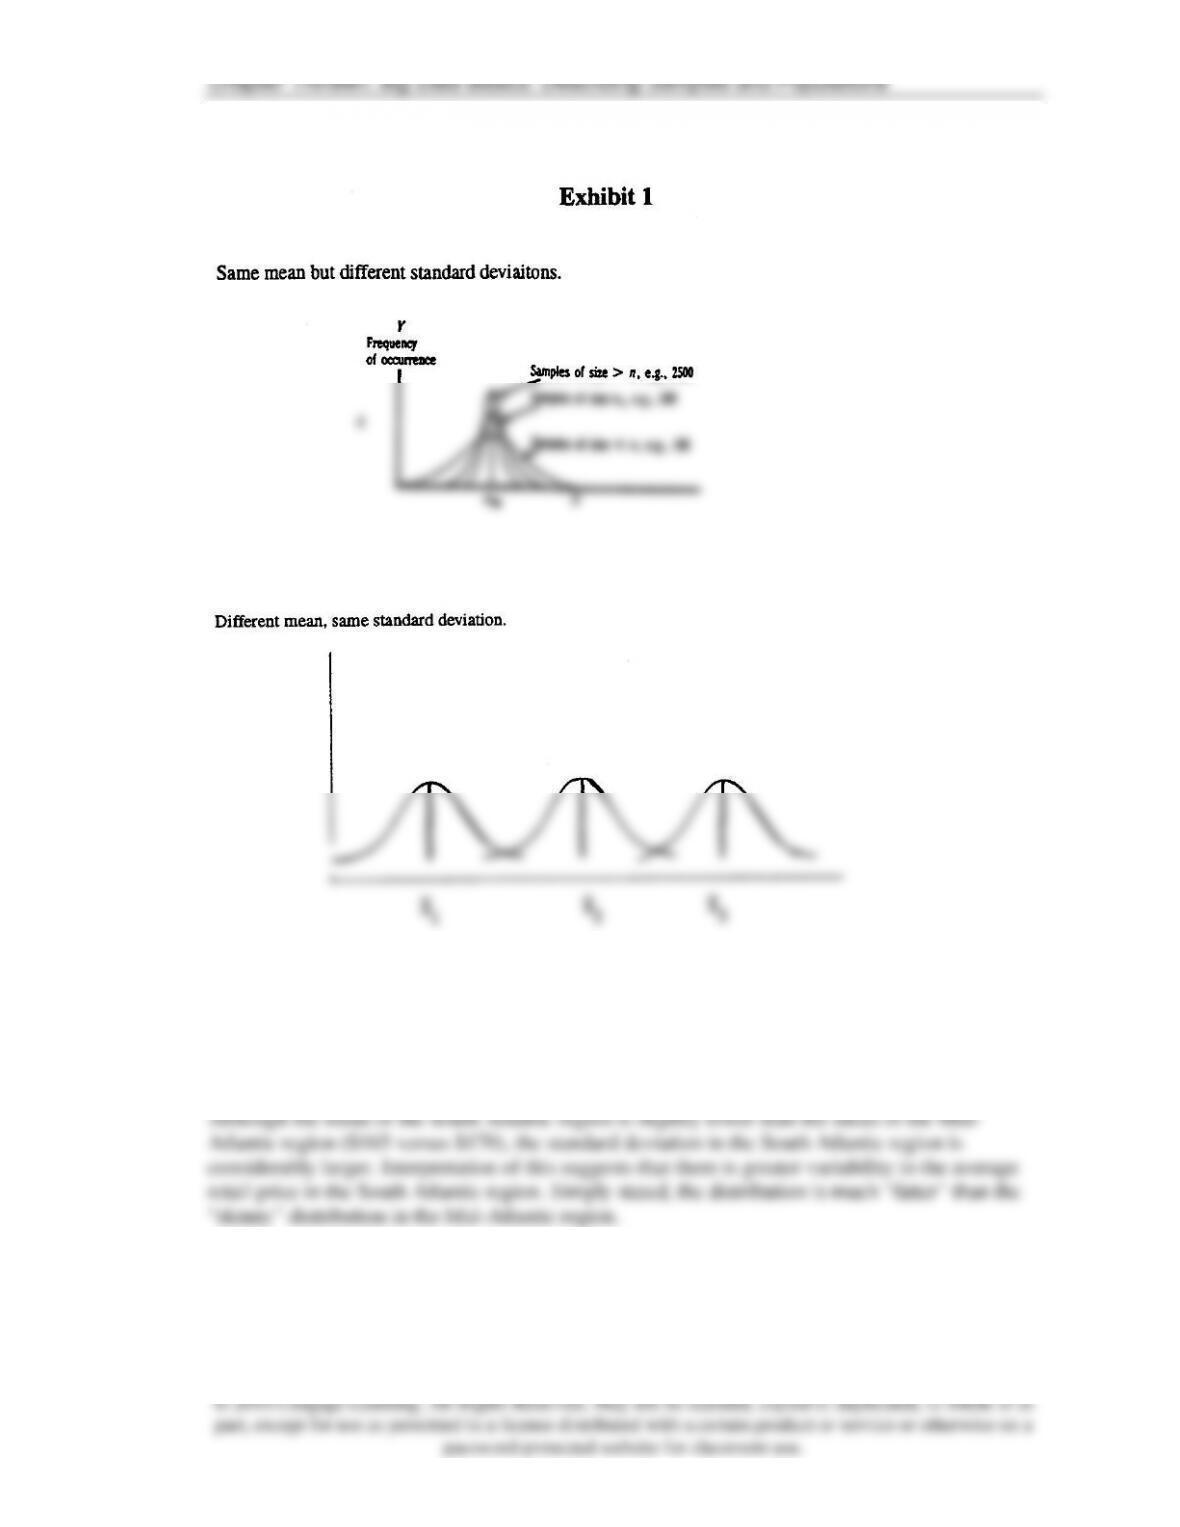
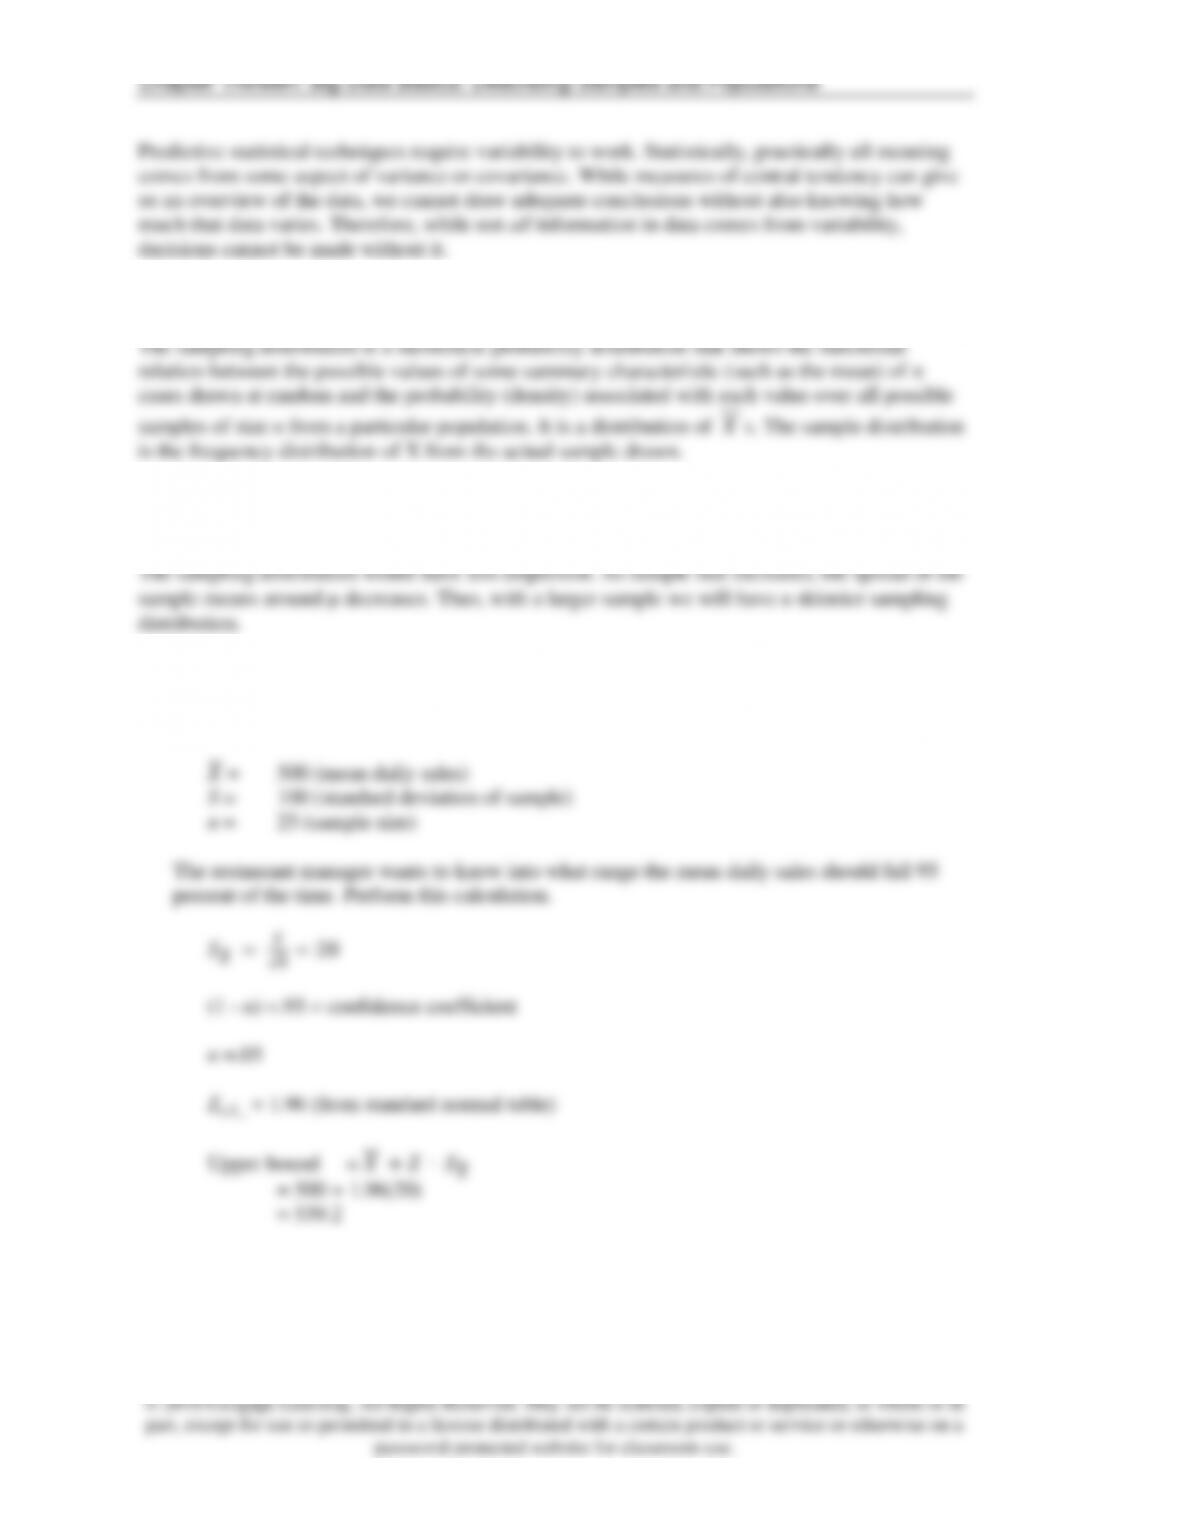
7. Draw three distributions that have the same mean value but different standard deviation
© 2016 Cengage Learning. All Rights Reserved. May not be scanned, copied or duplicated, in whole or in
part, except for use as permitted in a license distributed with a certain product or service or otherwise on a
password-protected website for classroom use.
10. What is the sampling distribution? How does it differ from the sample distribution?
11. What would happen to the sampling distribution of the mean if we increased the sample size
from 5 to 25?
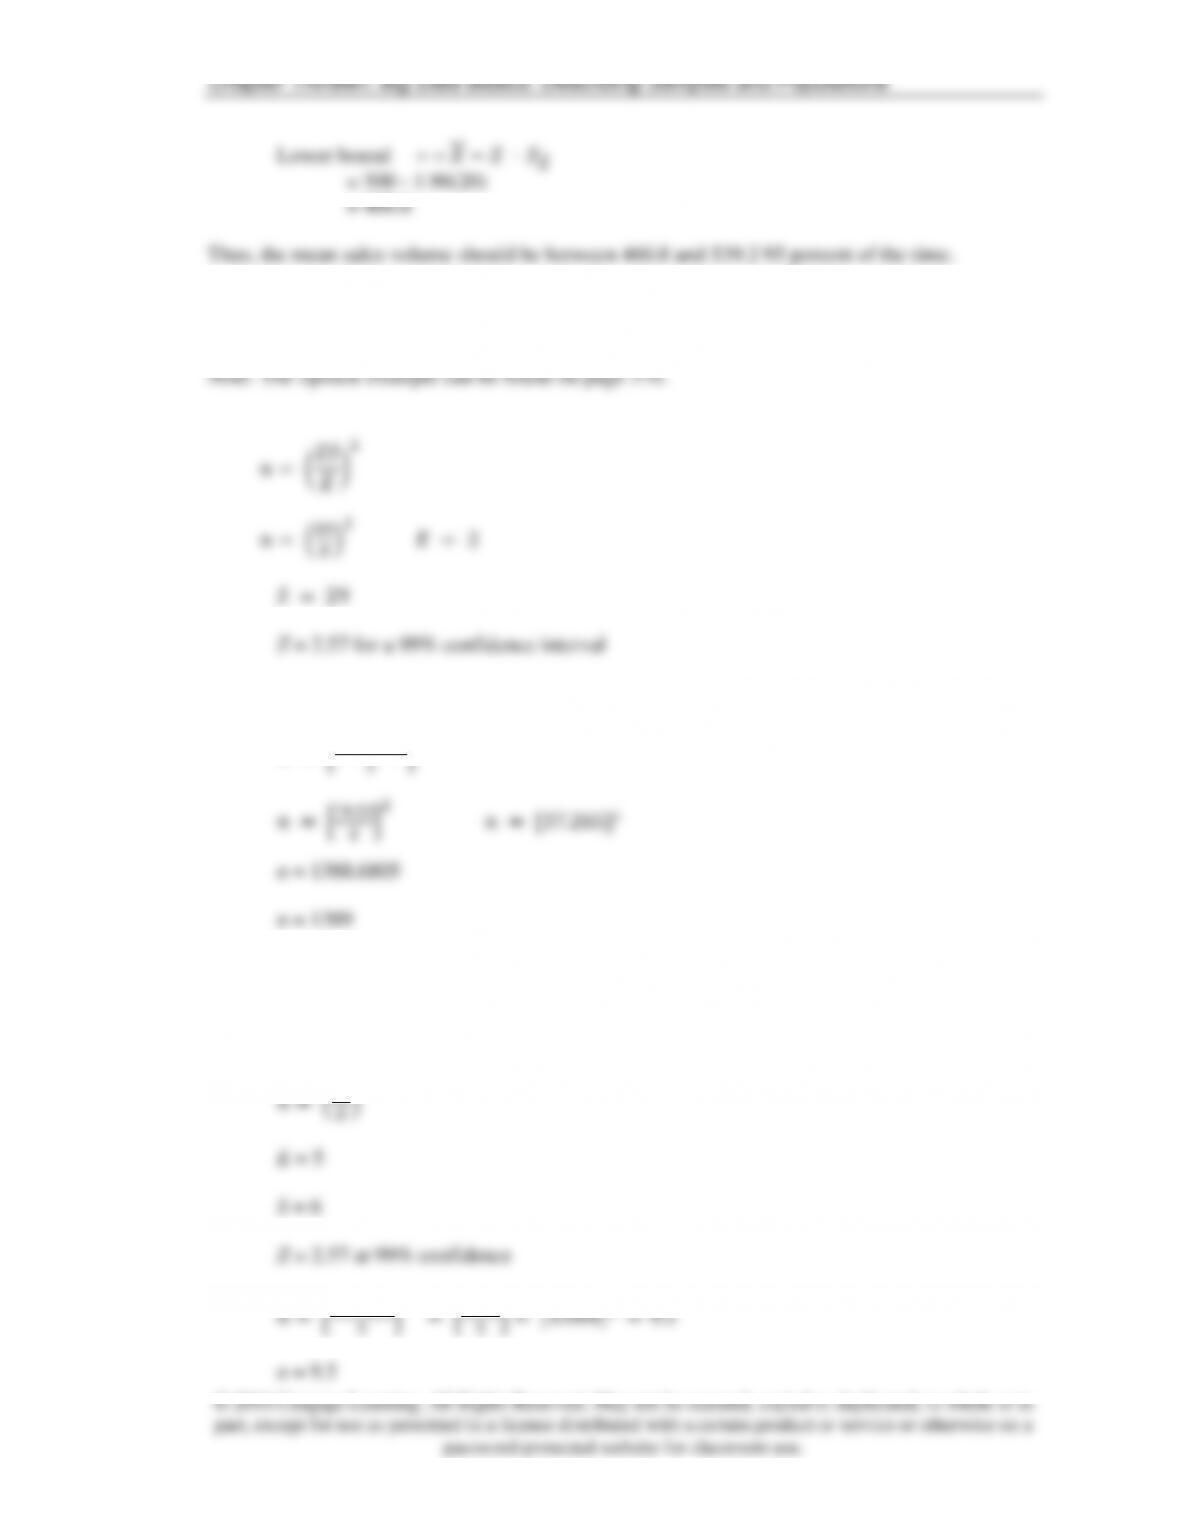
12. Suppose a fast-food restaurant wishes to estimate average sales volume for a new menu item.
The restaurant has analyzed the sales of the item at a similar outlet and observed the
following results:
© 2016 Cengage Learning. All Rights Reserved. May not be scanned, copied or duplicated, in whole or in
part, except for use as permitted in a license distributed with a certain product or service or otherwise on a
password-protected website for classroom use.
13. In the example on page 378 of research on lipstick where E = $2 and S = $29, what sample
size would we require if we desired a 99 percent confidence level?
𝑛 = [(2.57)(29)
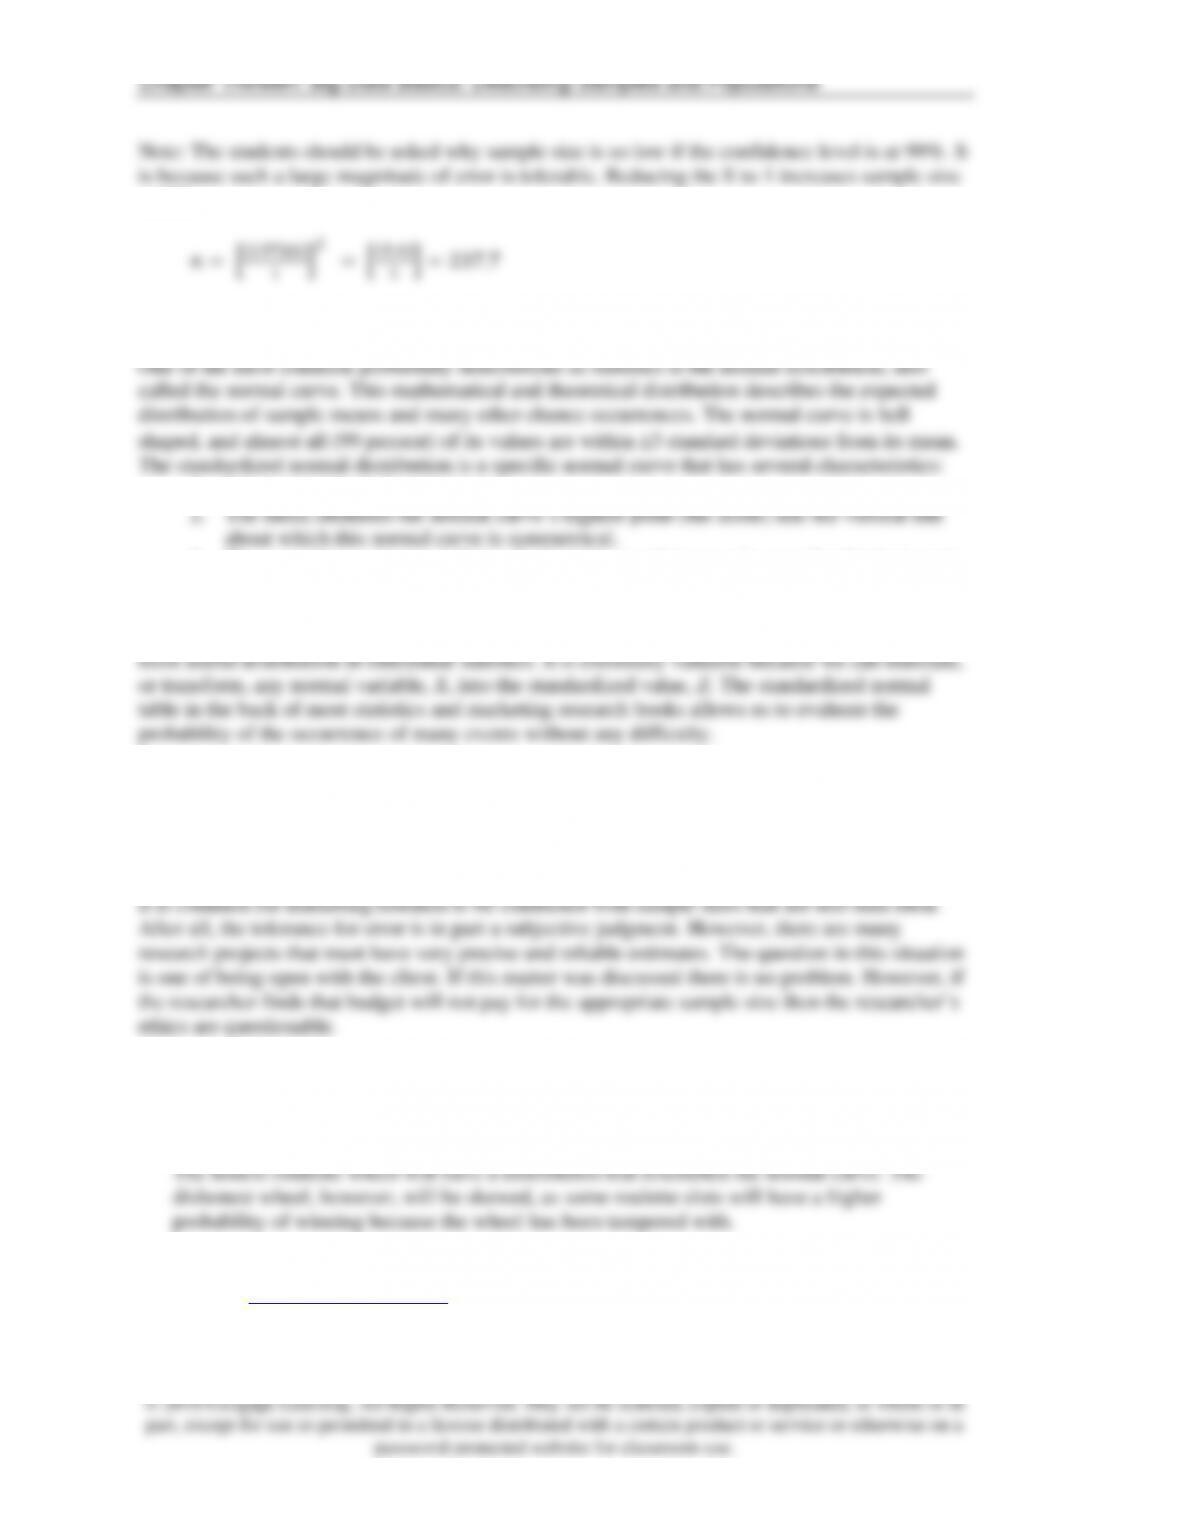
14. Suppose you are planning to sample cat owners to determine the average number of cans of
cat food they purchase monthly. The following standards have been set: a confidence level of
99 percent and an error of less than 5 units. Past research has indicated that the standard
deviation should be 6 units. What is the required sample size?
© 2016 Cengage Learning. All Rights Reserved. May not be scanned, copied or duplicated, in whole or in
part, except for use as permitted in a license distributed with a certain product or service or otherwise on a
password-protected website for classroom use.
to 238.
15. What is a standardized normal curve?
1. It is symmetrical about its mean.
3. The normal curve has an infinite number of cases (it is a continuous distribution), and
the area under the curve has a probability density equal to 1.0.
4. The standardized normal distribution has a mean of 0 and a standard deviation of 1.
The standardized normal distribution is a purely theoretical probability distribution, but it is the
16. [Ethics Question] Using the formula in this chapter, a researcher determines that at the 95
percent confidence level, a sample of 2,500 is required to satisfy a client’s requirements.
The researcher actually uses a sample of 1,200, however, because the client has specified a
budget cap for the survey. What are the ethical considerations in this situation?
17. Draw the distribution that should result from an honest roulette wheel. Draw the distribution
from a dishonest roulette wheel. Assuming samples of 500 spins were taken from each wheel,
what would the distribution of sample means of 10 look like for each wheel?
18. [Internet Question] A random number generator and other statistical information can be
found at http://www.random.org. Flip some virtual coins. Perform twenty flips with an
Aurelian coin. Perform twenty flips with a Constatius coin. Perform frequency tables for each
result. What conclusion might you draw? Would the result change if you flipped the coins
200 times or 2000 times?
© 2016 Cengage Learning. All Rights Reserved. May not be scanned, copied or duplicated, in whole or in
part, except for use as permitted in a license distributed with a certain product or service or otherwise on a
password-protected website for classroom use.
19. What role do auxiliary variables play in inferential marketing statistics?
RESEARCH ACTIVITIES
1. Look up at least five academic articles in an area of interest to you that involve survey
research. Do they all discuss the sample and sample size? From any description about the
sample provided, can the reader make a judgment about what population the statistics
generalize too (presuming inferential statistics are involved)?
2. [Internet Question] Use an online library service to find basic business research studies that
report a “response rate” or number of respondents compared to number of contacts. You may
wish to consult journals like the Journal of Business Research or the Journal of Marketing or
the Journal of Personal Selling and Sales Management. Find at least 10 such studies. What is
the average response rate across all of these studies? Do the resulting sample sizes seem
adequate? Do the researchers mention whether or not the results generalize to some
population? Write a brief report on your findings.
3. This activity would make a good in-class assignment. Assign each student a random number.
Then, randomly select eight students and ask each a small number of survey questions such
as (feel free to add a few of your own):
a) what is your political affiliation?
b) what is your religious affiliation?
c) do you park a car on campus?
d) what is your major?
e) how old are you in years?
Chapter Thirteen: Big Data Basics: Describing Samples and Populations
Now, assuming your instructor compiles results for the entire class, compare your results
from your sample of 8 to the class results. How well does your sample generalize to the entire
class? Compare your results and then that of the entire class to data available from your
university web site on these questions (some of this should be available from institutional
research at your school). How well does you sample 8 and the sample that is your entire class
generalize to the entire university? This illustrates the use of auxiliary variables.
CASE 17.1 Coastal Star Sales Corporation
Students are instructed to download the data set for this Cengage website for this text or request
them from the instructor.
Objectives: The objective of the case is for students to calculate a mean and a standard deviation
and to determine a 95 percent confidence interval around the mean for each of the variables.
Students are also asked to organize the data into a frequency distribution and a percentage
distribution.
Summary: Coastal Star Sales Corporation is a West Coast wholesaler that markets products of
several manufacturers of leisure products to retailers. Coastal Star has an eighty-person sales
force that sells in a six-state area to wholesalers. Its sales force is divided into two sales regions.
Descriptive information about each salesperson and his or her sales performance of the past two
years is presented..
Questions
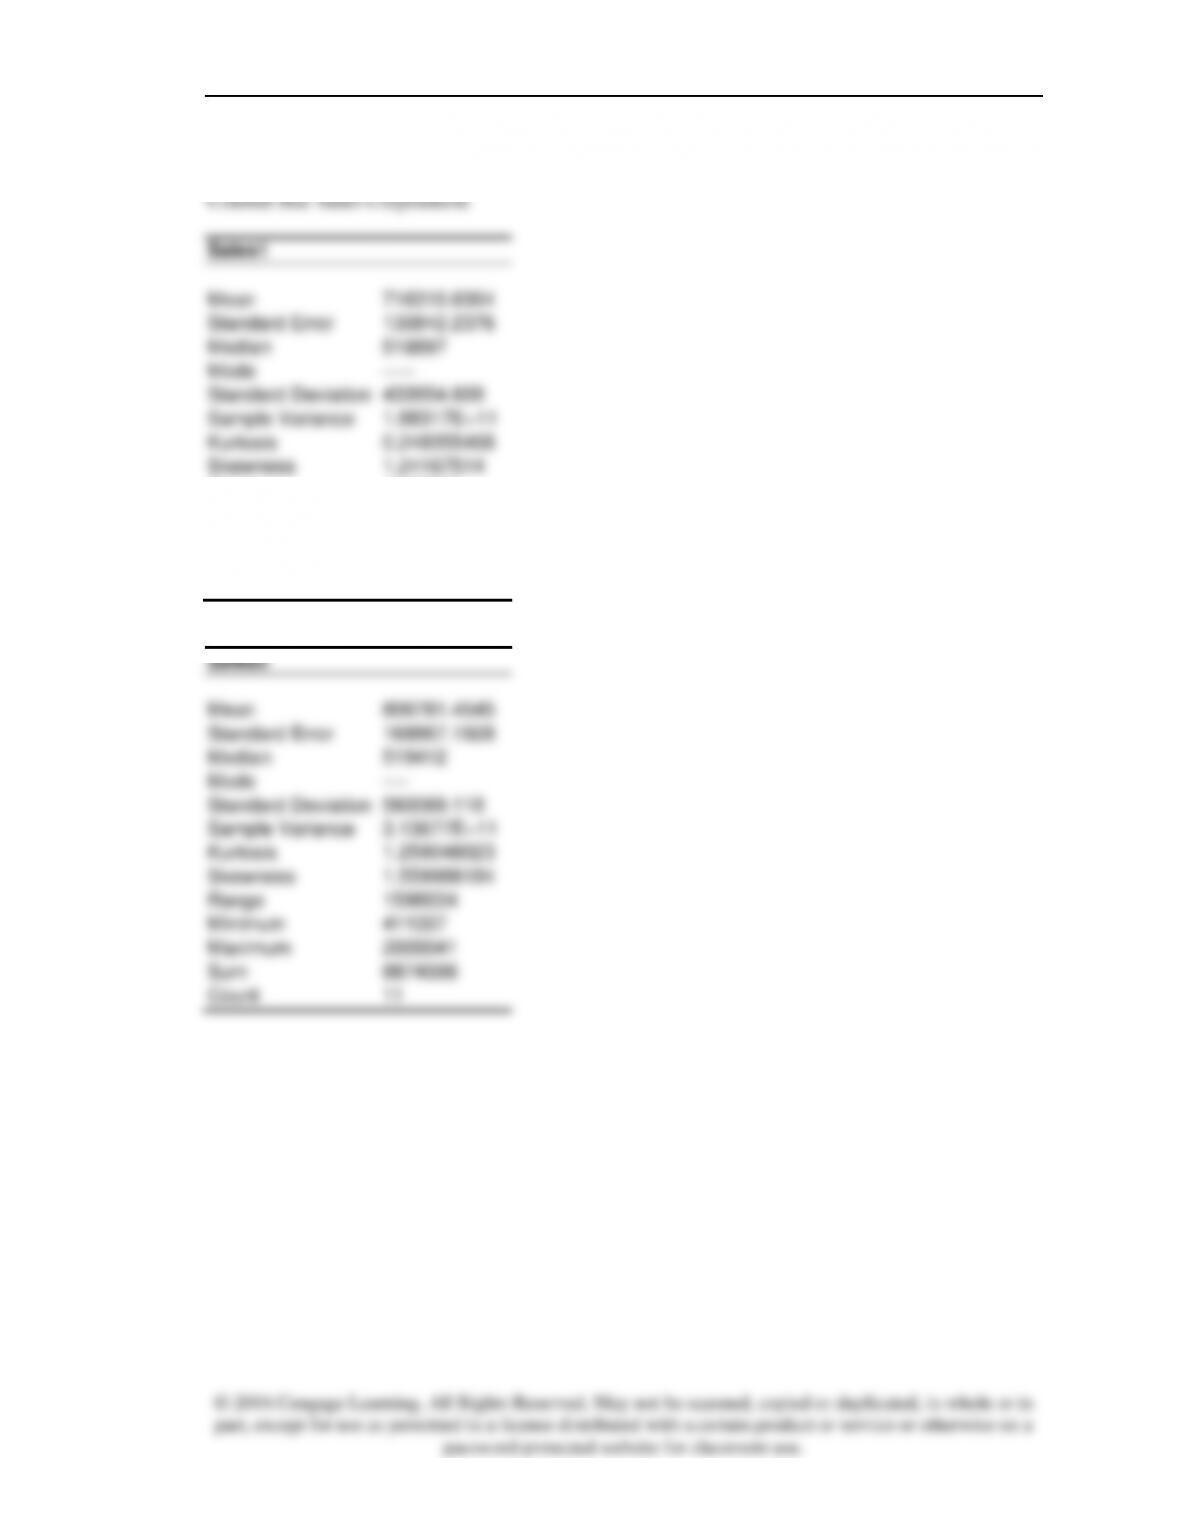
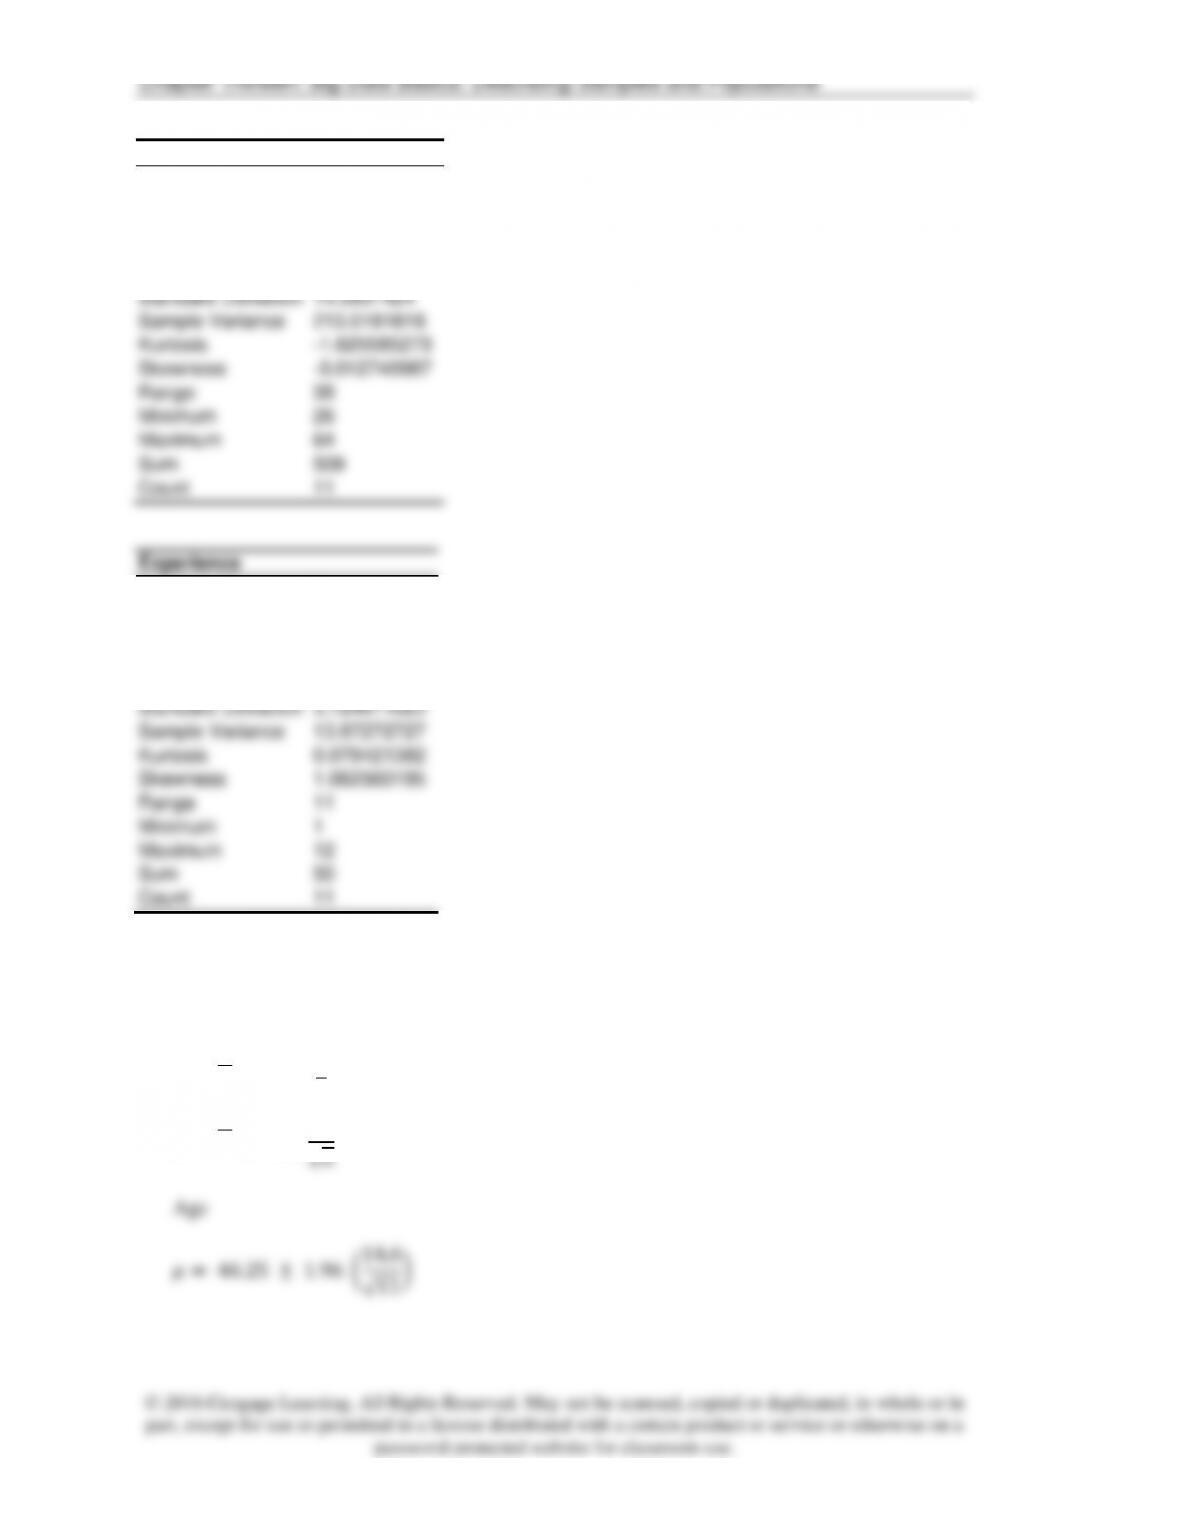
1. Calculate a mean and standard deviation for each variable.
Chapter Thirteen: Big Data Basics: Describing Samples and Populations
EXHIBIT 1
© 2016 Cengage Learning. All Rights Reserved. May not be scanned, copied or duplicated, in whole or in
part, except for use as permitted in a license distributed with a certain product or service or otherwise on a
password-protected website for classroom use.
3. Calculate the median, mode, and range for each variable.
See Exhibit 1.
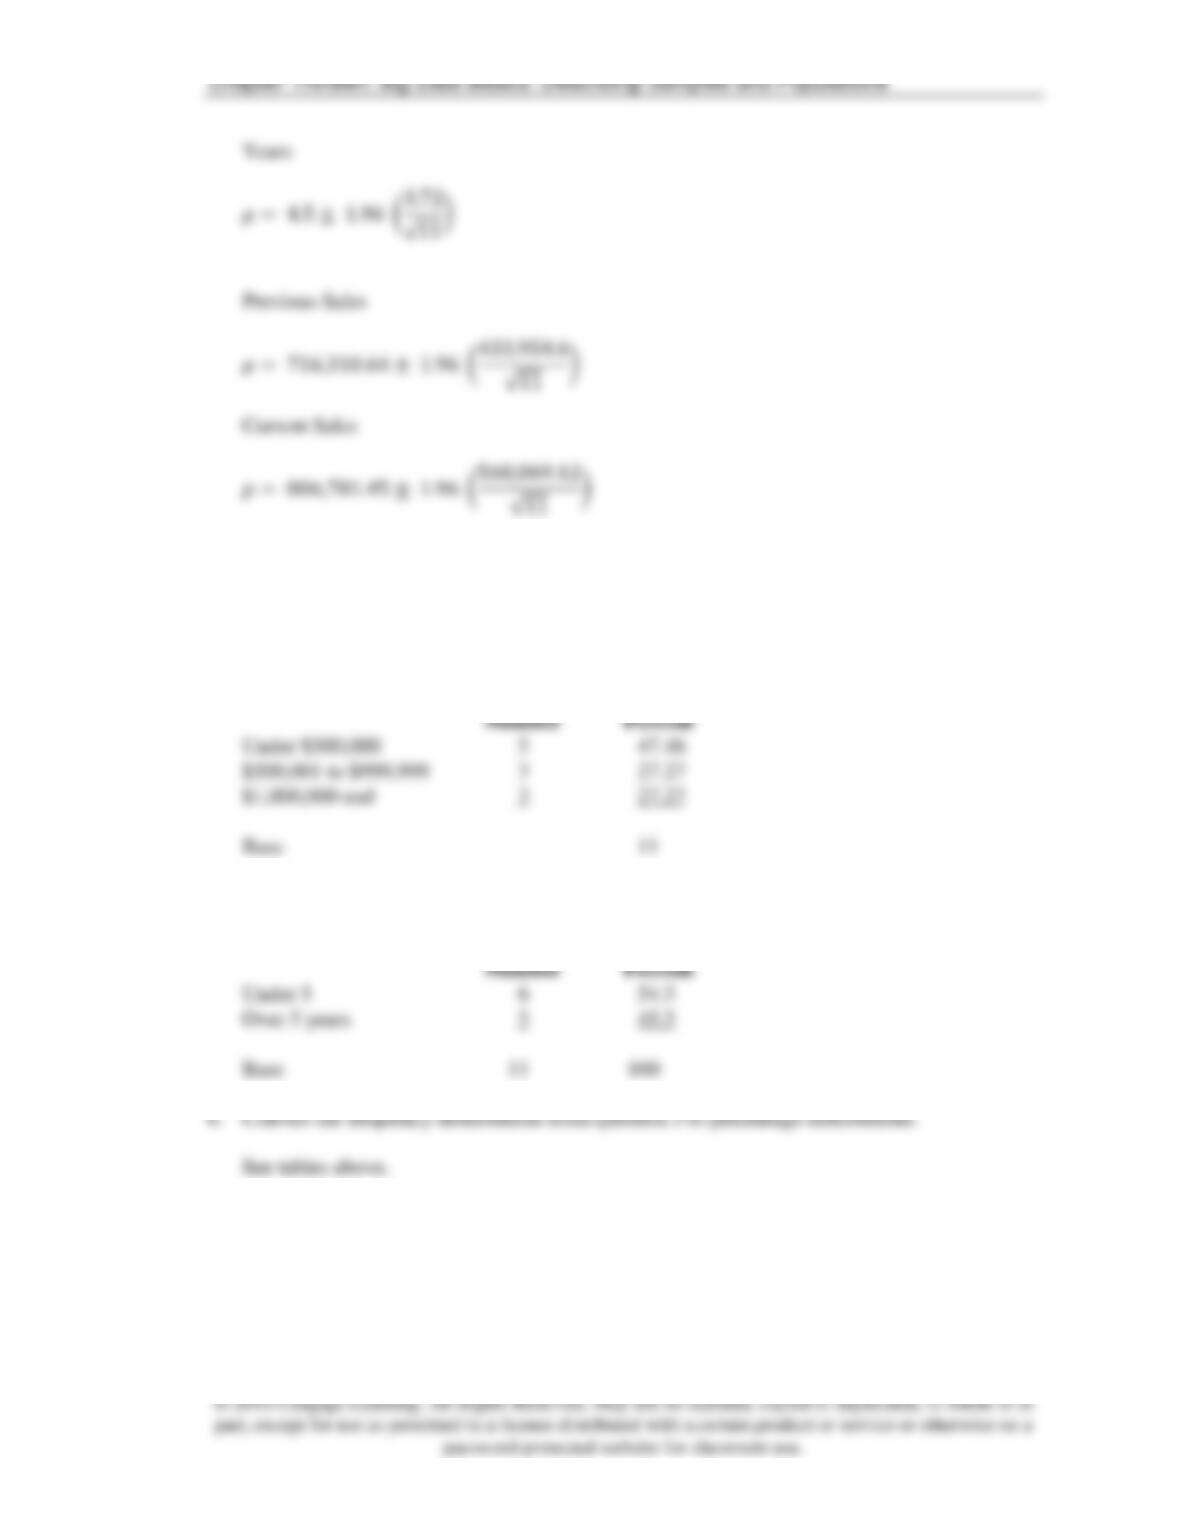
4. Organize the data for current sales into a frequency distribution with three classes: (a) under
$500,000, (b) $500,001 to $999,999, and (c) $1,000,000 and over.
5. Organize the data for years of selling experience into a frequency distribution with two
classes: (a) one less than five years and (b) five or more years.