Comprehensive Case Solutions: Essentials of Marketing Research, 11th Edition,
Cengage. 33
COLOR
Frequency
Percent
Valid Percent
Cumulative
Percent
Valid
BLUE
26
26.0
26.0
26.0
RED
50
50.0
50.0
76.0
WHITE
24
24.0
24.0
100.0
Total
100
100.0
100.0
Cengage. 34
Female students are more likely to like red cars than are male students:
COLOR * SEX Crosstabulation
Count
SEX
MALE
FEMALE
Total
COLOR
BLUE
20
6
26
RED
15
35
50
WHITE
15
9
24
Total
50
50
100
Chi-Square Tests
Value
df
Asymp. Sig. (2-
sided)
Pearson Chi-Square
17.038a
2
.000
Likelihood Ratio
17.697
2
.000
N of Valid Cases
100
a. 0 cells (.0%) have expected count less than 5. The
minimum expected count is 12.00.
Females are significantly more likely than males to commute:
RESIDENCE * SEX Crosstabulation
Count
SEX
MALE
FEMALE
Total
RESIDENCE
COMMUTE
15
34
49
ON CAMPUS
35
16
51
Total
50
50
100
Cengage. 35
Chi-Square Tests
Value
Df
Asymp. Sig. (2-
sided)
Exact Sig. (2-
sided)
Exact Sig. (1-
sided)
Pearson Chi-Square
14.446a
1
.000
Continuity Correctionb
12.965
1
.000
Likelihood Ratio
14.816
1
.000
Fisher’s Exact Test
.000
.000
Linear-by-Linear
Association
14.301
1
.000
N of Valid Cases
100
a. 0 cells (.0%) have expected count less than 5. The minimum expected count is 24.50.
b. Computed only for a 2×2 table
Business students think of a car as a cat or a dog and engineering and liberal arts students think
of it as a mule:
ANIMAL * MAJOR Crosstabulation
Count
MAJOR
BUSINESS
ENGINEERING
LIBERAL ARTS
Total
ANIMAL
CAT
17
6
6
29
DOG
16
7
8
31
MULE
7
17
16
40
Total
40
30
30
100
Chi-Square Tests
Value
df
Asymp. Sig. (2-
sided)
Pearson Chi-Square
14.465a
4
.006
Likelihood Ratio
15.322
4
.004
N of Valid Cases
100
Comprehensive Case Solutions: Essentials of Marketing Research, 11th Edition,
Cengage. 36
Chi-Square Tests
Value
df
Asymp. Sig. (2-
sided)
Pearson Chi-Square
14.465a
4
.006
Likelihood Ratio
15.322
4
.004
a. 0 cells (.0%) have expected count less than 5. The
minimum expected count is 8.70.
3. Assuming a small college town lacked an auto dealership (beyond Ford, GM, and Chrysler),
what two companies should be most interested in this type of location? Use the Internet if
4. What are the weaknesses in basing decisions on this type of research?
5. Are there key issues that may diminish the usefulness of this research?
6. What kinds of themes might emerge from the cartoon drawings?
7. Are there any ethical dilemmas presented in this case?
As is often the case, no blatant ethical breech exists in the TABH, INC case. Looking more deeply
though, a few issues deserve scrutiny from an ethics standpoint. David had to “purchase” the
opportunity to collect data by paying for a booth at the college career fair. Students may discuss
this as a dilemma, but if the “purchase” does not affect the data quality or create error based on
purpose for doing this research for this white paper is to potentially serve as a source of future
customized research projects. So, the research is to some extent a sales pitch or an
advertisement. Whether or not this presents an ethical dilemma is debatable. Many research
Case 7: Knowing the Way
Overview: The case provides an attempt to apply market research procedures in a realistic and
comprehensive way. Practically all facets of the market research process are involved in this
case. Students get to see how the research time goes about translating issues into decision
statement, decision statements into research questions, and then the students become involved
coding errors or implausible responses in the data. Data are available online in the student
resource center that accompanies the log-in for the textbook at cengagebrain.com.
Questions:
Cengage. 38
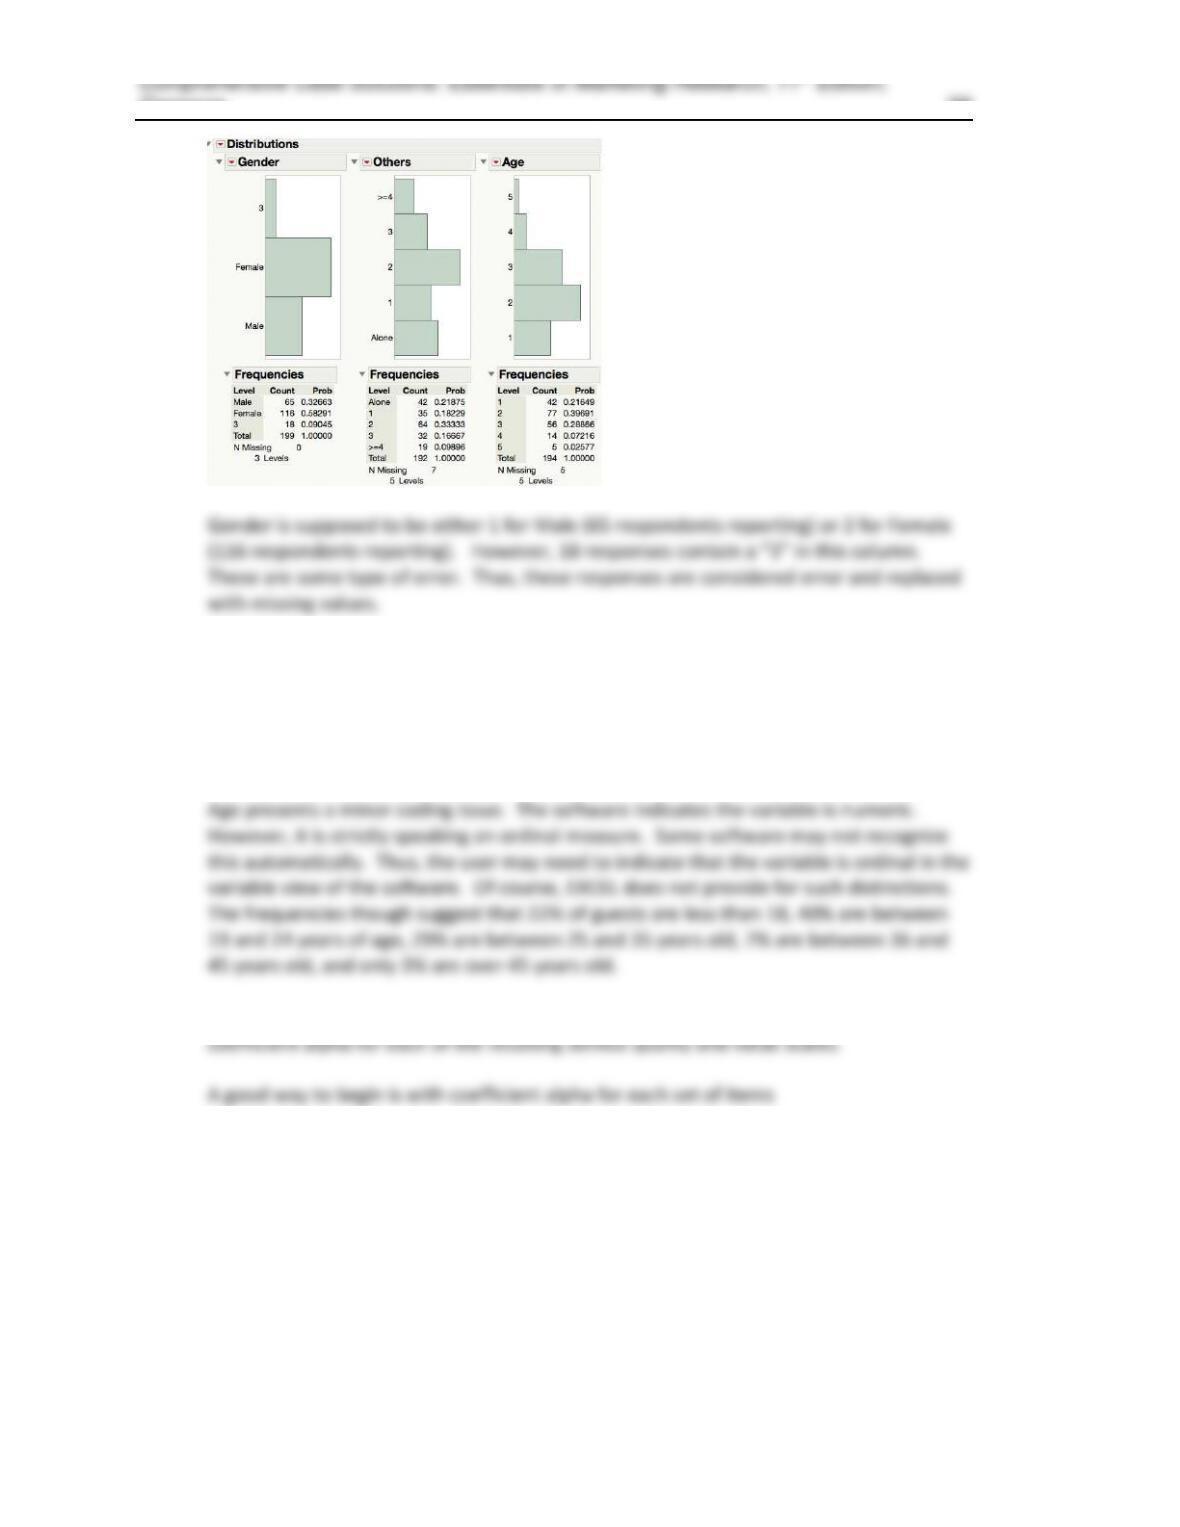
Others presents no apparent coding issues. The counts suggest that 42% of
respondents report going alone to the park, 18% come with one other person, 33%
come with two other guests, 17% come with 3 other guests, and 10% report coming
with more than 3 guests. 7 responses are missing meaning respondents likely did not
answer this question.
2. Compute a composite scale for the five SQ items and the four VAL items. Compute
Cengage. 39
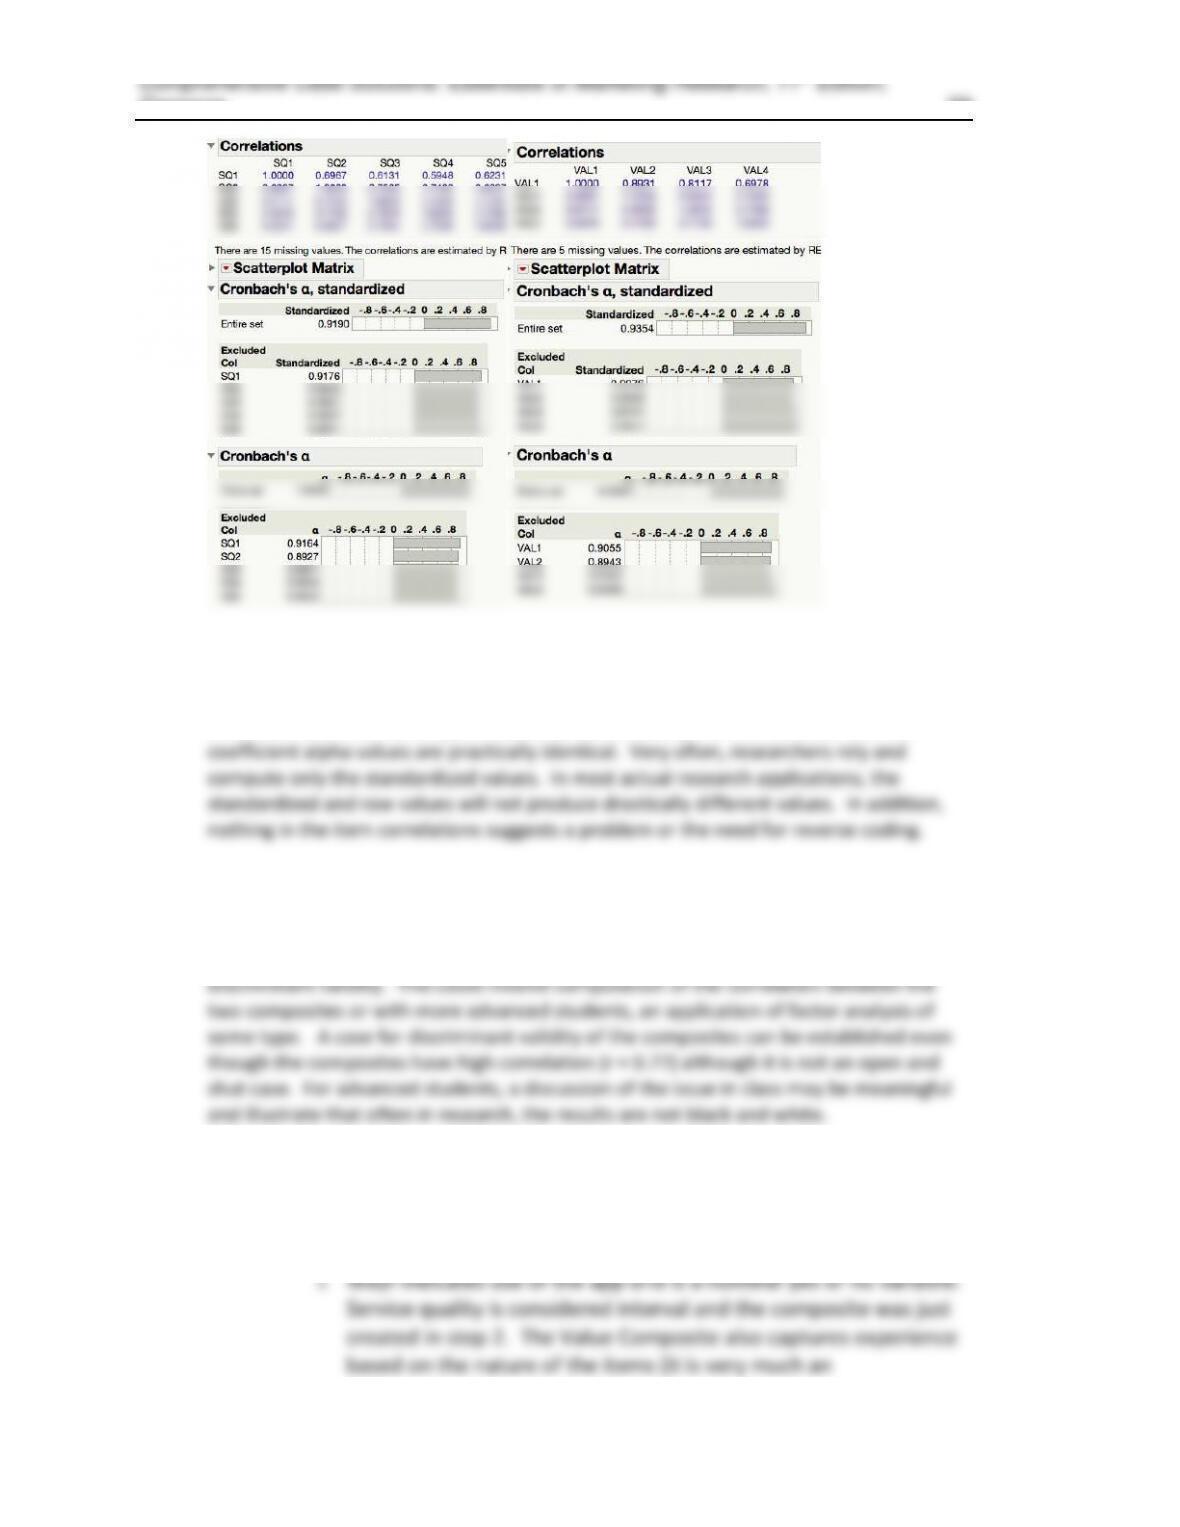
The coefficient alpha is 0.92 for the SQ scale and 0.93 (or 0.94 based on rounding of
standardized values). In both cases, these coefficient alpha values suggest sufficient
convergent validity to support forming composite scales. In this case, given the scales
consistent all of the same type of scales (5-point scales), the standardized and raw
The mean SQ Composite, based on a summated scale, is 20.4. The mean VAL Composite
is 17.4.
If the instructor wanted to push advance students, he/she could ask for an analysis of
3. Perform an appropriate test of each research question RQ1-RQ5.
a. RQ1 – Do patrons using a mobile phone navigation app report higher
service quality and have improved experience relative to those who do
not?
Cengage. 40
experiential/hedonic value concept in terms of its face validity).
Thus, either one-way ANOVA, independent samples-t-tests, or
ii. An initial check of the frequencies reveals several “9” entries for
Wayf, which should be coded yes or no. These values should be
coded as missing values (by either deleting or setting the value as
missing in the software) prior to analysis. After doing so, the
following results are found:
1. For the SQ composite, a significant difference emerges.
For park guests using the navigation app, a service quality
2. For the VAL composite, a significant difference emerges
3. If students for another composite for the Feel1-Feel4
variables to represent experience, you should consider
0.001). The lower mean in this case among the yes group,
based on the scoring, indicates they had better feelings
than the no group.
b. RQ2: Do those using the app have a greater likelihood of an upgrade?
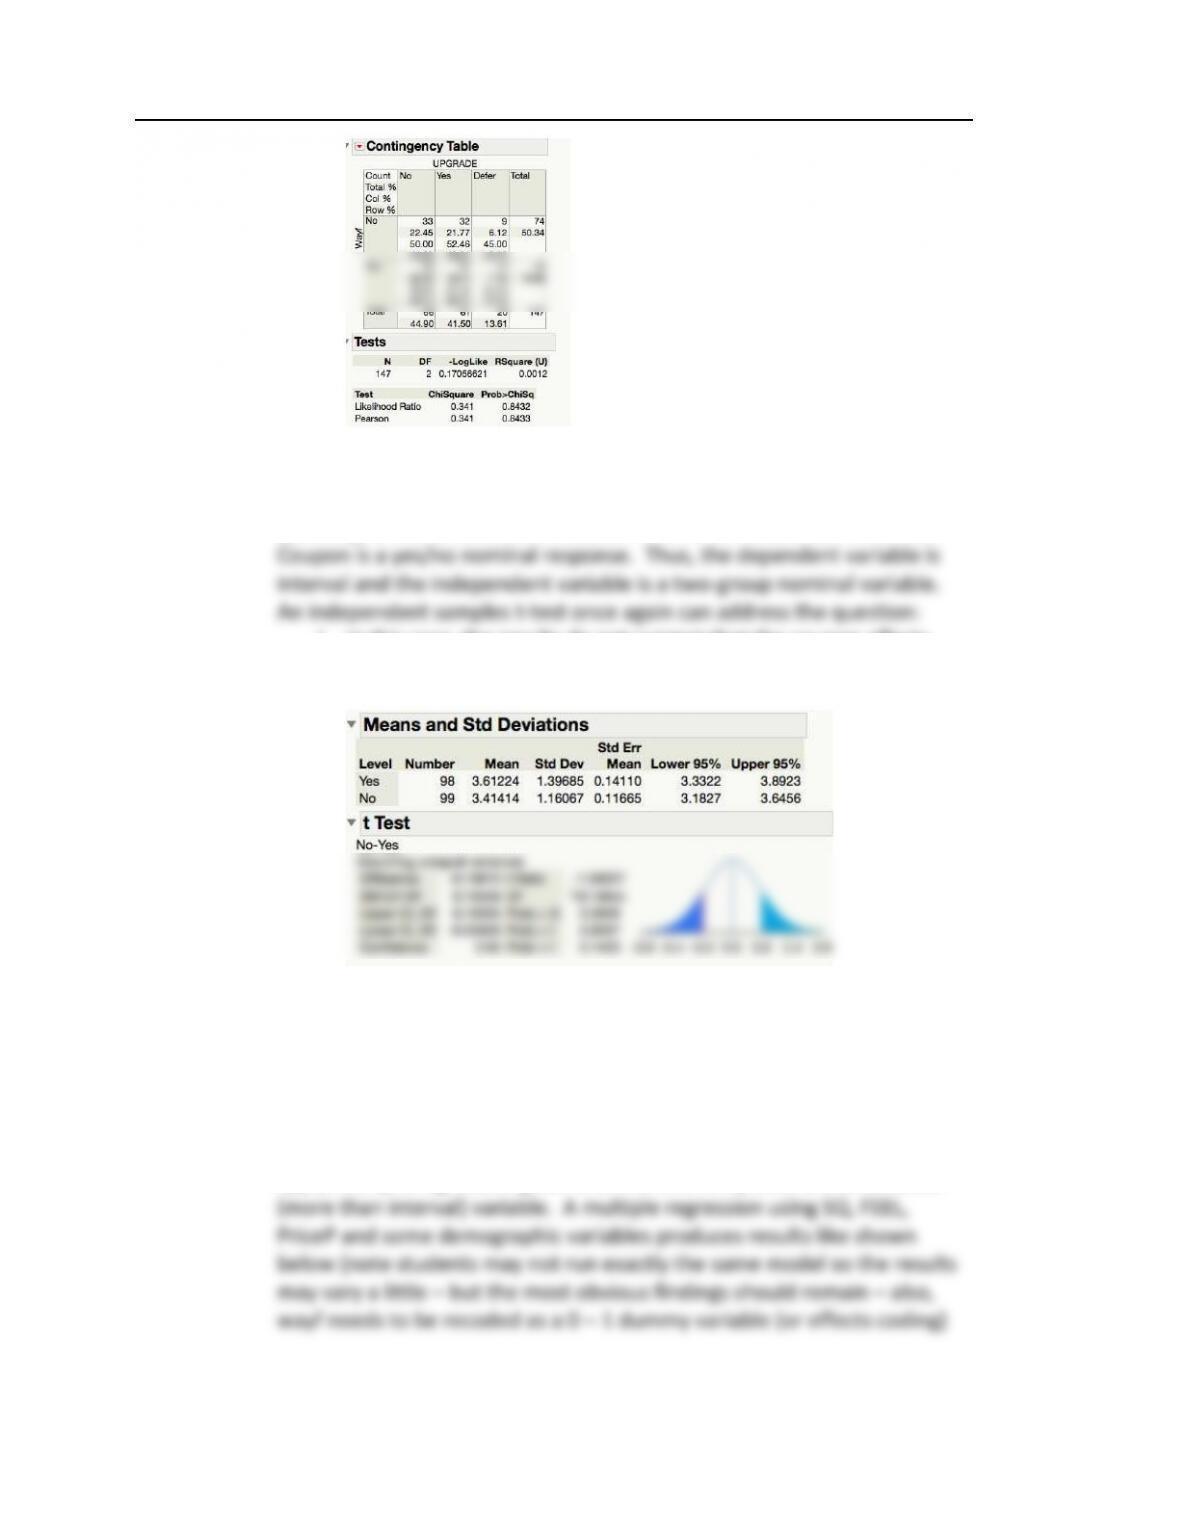
Comprehensive Case Solutions: Essentials of Marketing Research, 11th Edition,
Cengage. 41
c. RQ3: Do patrons who use a coupon report more positive price
perceptions? Pricep is a five-point Likert scale. Although it is strictly
speaking, ordinal, we assume they are interval as described in the text.
i. In this case, the results do not suggest that the coupon affects
perceptions of price fairness (diff = -0.2, t = -1.1, p > .1, notice 0 in
the confidence interval):
d. RQ4: Do patronswho use the mobile app have a greater likelihood of
upgrading to a season pass? This mistakenly repeats RQ2 and need not
be reanalyzed.
e. RQ5: What factors contribute to improved value perceptions? Here, the
student is given a chance to explore some possibilities. Correlations
could be taken among the composite constructs available and among
some of the demographic variables. However, this is an opportunity to
apply multiple regression given that the VAL composite is a continuous
Cengage. 42
to be included in this analysis, as would be the case for any of the
dichotomous variables):
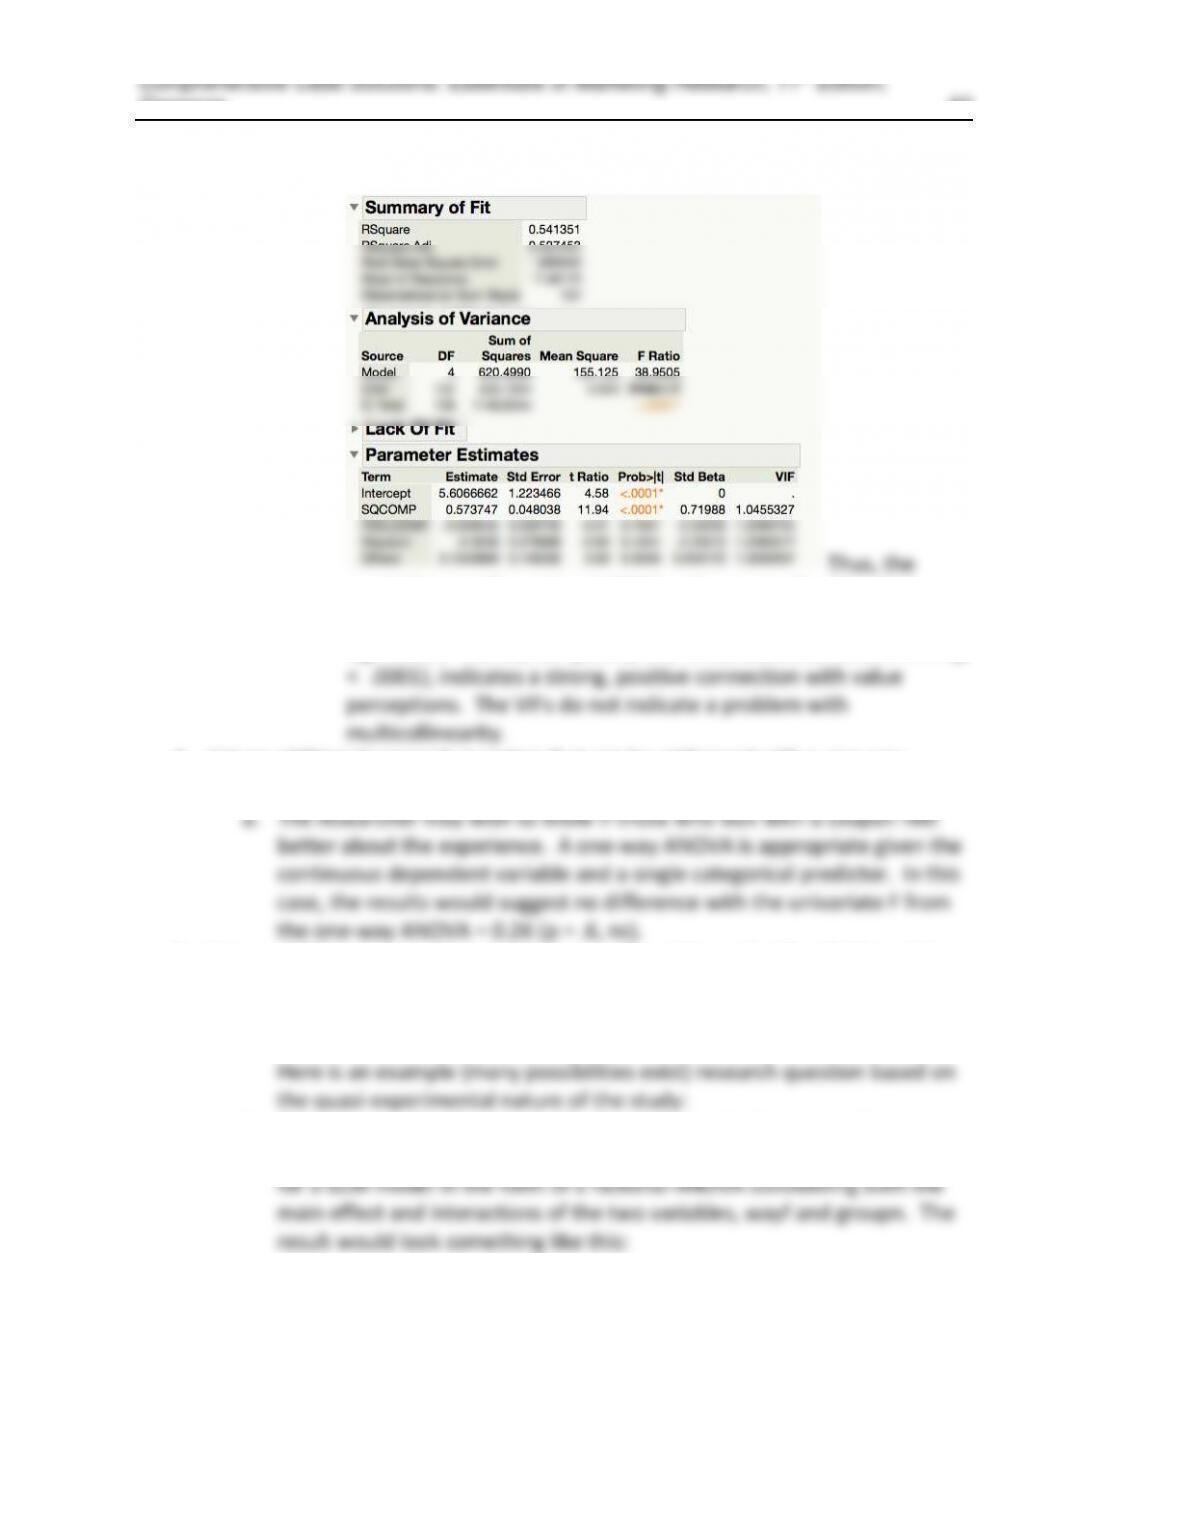
model F is significant (p < 0.0001) and accounts for 54% of the
variance in the VAL composite. Only one independent variable is
significant. The SQ Composite, with a standardized beta of 0.72 (p
4. List an additional research question that can be addressed with a one-way
ANOVA. Conduct the test.
5. List an additional research question that can be addressed with a GLM model.
Conduct the test.
a. This is a fairly advanced question and the instructor may consider making
it “extra credit” or not assigning unless the students are fairly advanced.
b. Does the use of technology in the form of a navigation app and a groupon
coupon influence the value perceptions of guests in any way? This calls
Cengage. 43
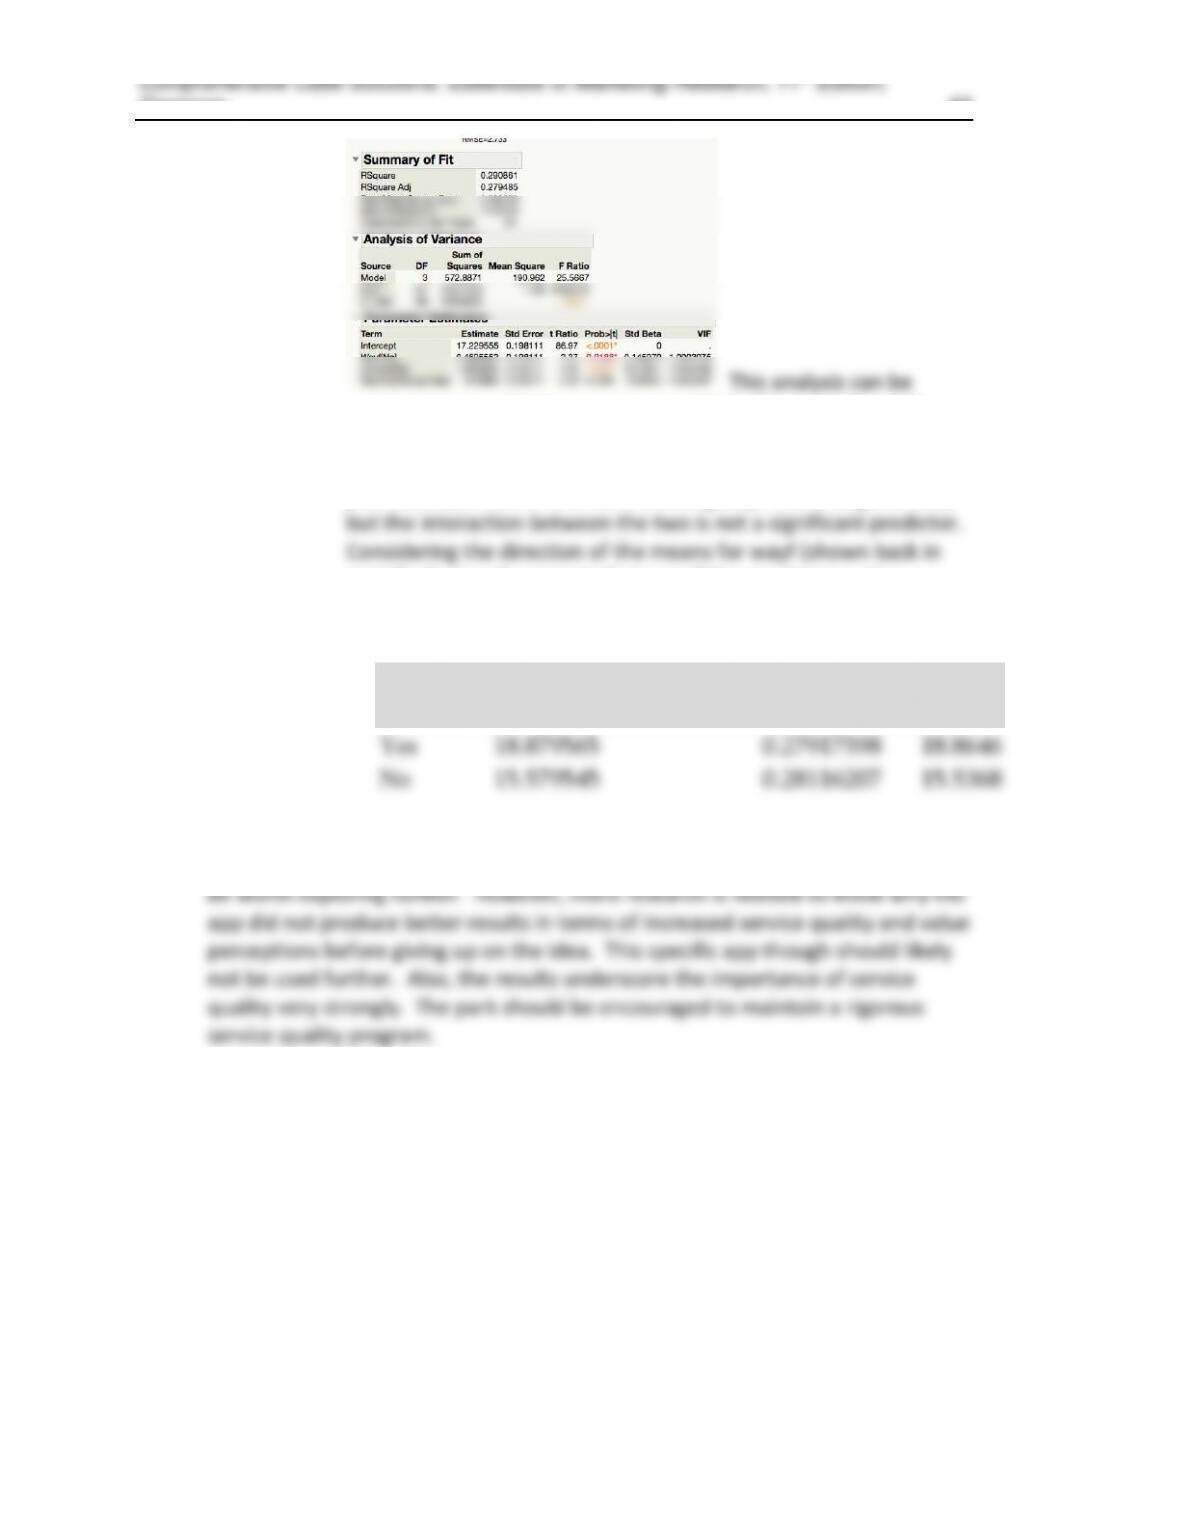
conducted using GLM – univariate in SPSS, “Fit Model” in JMP,
“Proc GLM” in SAS. The model F of 25.6 suggests a significant
model (p < 0.0001). Both wayf and groupn are significant
predictors (as seen in the table above groupn has a larger effect)
part 2), the result suggests that use of the app lowers value
perceptions. In contrast, those who use a coupon report
significantly higher value perceptions:
6. Thus, from the results above the coupon appears to pay off in increased value
perceptions but the app does not. Investments in promotional technologies may
Level
Least Sq
Mean
Std Error
Mean
Yes
18.879565
0.27917598
18.8646
No
15.579545
0.28116207
15.5368