Comprehensive Case Solutions: Essentials of Marketing Research, 11th Edition,
Cengage. 21
Descriptives
N
Mean
Std.
Deviation
Std.
Error
95% Confidence Interval
for Mean
Minimu
m
Maximu
m
Lower
Bound
Upper
Bound
fun
1
54
2.9444
1.20403
.16385
2.6158
3.2731
1.00
6.00
2
36
2.4167
.96732
.16122
2.0894
2.7440
1.00
6.00
3
54
2.8148
1.06530
.14497
2.5240
3.1056
1.00
7.00
Total
144
2.7639
1.10931
.09244
2.5812
2.9466
1.00
7.00
belong
1
54
2.8889
1.47516
.20074
2.4862
3.2915
1.00
6.00
2
35
3.2857
1.61921
.27370
2.7295
3.8419
1.00
7.00
3
54
2.9630
1.44016
.19598
2.5699
3.3561
1.00
7.00
Total
143
3.0140
1.49641
.12514
2.7666
3.2614
1.00
7.00
respect
1
54
2.3704
1.13763
.15481
2.0599
2.6809
1.00
6.00
2
35
2.3143
1.02244
.17282
1.9631
2.6655
1.00
5.00
3
54
2.5000
1.32821
.18075
2.1375
2.8625
1.00
7.00
Total
143
2.4056
1.18225
.09886
2.2102
2.6010
1.00
7.00
selfful
1
54
2.0926
1.06874
.14544
1.8009
2.3843
1.00
7.00
2
35
1.9429
.83817
.14168
1.6549
2.2308
1.00
4.00
3
54
2.5370
1.22417
.16659
2.2029
2.8712
1.00
6.00
Total
143
2.2238
1.10326
.09226
2.0414
2.4062
1.00
7.00
accomp
1
54
1.8889
.92485
.12586
1.6365
2.1413
1.00
6.00
2
36
1.7222
.77868
.12978
1.4588
1.9857
1.00
4.00
3
54
2.1852
1.08287
.14736
1.8896
2.4808
1.00
5.00
Total
144
1.9583
.96712
.08059
1.7990
2.1176
1.00
6.00
warm
1
54
2.1481
1.20388
.16383
1.8196
2.4767
1.00
7.00
2
36
2.7500
1.69664
.28277
2.1759
3.3241
1.00
7.00
3
54
2.6852
1.37119
.18659
2.3109
3.0594
1.00
7.00
Total
144
2.5000
1.41915
.11826
2.2662
2.7338
1.00
7.00
security
1
55
1.9818
.95240
.12842
1.7243
2.2393
1.00
5.00
2
36
2.4444
1.55737
.25956
1.9175
2.9714
1.00
6.00
3
54
2.3704
1.35000
.18371
2.0019
2.7388
1.00
7.00
Total
145
2.2414
1.28169
.10644
2.0310
2.4518
1.00
7.00
selfres
1
54
1.6111
.87775
.11945
1.3715
1.8507
1.00
5.00
2
36
1.6667
.86189
.14365
1.3750
1.9583
1.00
4.00
3
54
1.9074
1.26295
.17187
1.5627
2.2521
1.00
7.00
Total
144
1.7361
1.03766
.08647
1.5652
1.9070
1.00
7.00
Cengage. 22
One-way ANOVA reveals only one value—self-fulfillment—with significant differences among
the groups:
ANOVA
Sum of
Squares
df
Mean Square
F
Sig.
fun
Between Groups
6.241
2
3.120
2.592
.078
Within Groups
169.731
141
1.204
Total
175.972
143
belong
Between Groups
3.570
2
1.785
.795
.454
Within Groups
314.402
140
2.246
Total
317.972
142
respect
Between Groups
.840
2
.420
.298
.743
Within Groups
197.635
140
1.412
Total
198.476
142
selfful
Between Groups
8.990
2
4.495
3.841
.024
Within Groups
163.849
140
1.170
Total
172.839
142
accomp
Between Groups
5.046
2
2.523
2.764
.066
Within Groups
128.704
141
.913
Total
133.750
143
warm
Between Groups
10.787
2
5.394
2.743
.068
Within Groups
277.213
141
1.966
Total
288.000
143
security
Between Groups
6.088
2
3.044
1.876
.157
Within Groups
230.463
142
1.623
Total
236.552
144
selfres
Between Groups
2.602
2
1.301
1.212
.301
Within Groups
151.370
141
1.074
Total
153.972
143
(2.1), and the lowest score is for drivers of Japanese cars (1.9).
3. Are there any significant differences on importance of attributes?

Comprehensive Case Solutions: Essentials of Marketing Research, 11th Edition,
Cengage. 24
ANOVA
Sum of
Squares
df
Mean Square
F
Sig.
Comfort
Between Groups
1.937
2
.969
3.852
.023
Within Groups
38.218
152
.251
Total
40.155
154
Safety
Between Groups
.453
2
.226
.625
.536
Within Groups
55.031
152
.362
Total
55.484
154
Power
Between Groups
1.601
2
.800
.631
.533
Within Groups
191.393
151
1.268
Total
192.994
153
Speed
Between Groups
8.021
2
4.011
2.418
.093
Within Groups
250.472
151
1.659
Total
258.494
153
Styling
Between Groups
4.005
2
2.003
3.256
.041
Within Groups
93.479
152
.615
Total
97.484
154
Durabil
Between Groups
2.154
2
1.077
2.472
.088
Within Groups
66.233
152
.436
Total
68.387
154
Lowmc
Between Groups
14.312
2
7.156
6.088
.003
Within Groups
178.656
152
1.175
Total
192.968
154
Rely
Between Groups
.770
2
.385
1.637
.198
Within Groups
35.772
152
.235
Total
36.542
154
warranty
Between Groups
.670
2
.335
.429
.652
Within Groups
117.095
150
.781
Total
117.765
152
Nonpoll
Between Groups
3.161
2
1.580
.698
.499
Within Groups
341.885
151
2.264
Total
345.045
153
Gasmile
Between Groups
2.302
2
1.151
.627
.536
Within Groups
279.092
152
1.836
Total
281.394
154
Repairs
Between Groups
123.694
2
61.847
20.410
.000
Within Groups
451.510
149
3.030
Total
575.204
151
and 4.0, respectively):
Descriptives
repairs
N
Mean
Std.
Deviation
Std. Error
95% Confidence Interval for
Mean
Minimum
Maximum
Lower Bound
Upper Bound
1
57
5.8421
1.62337
.21502
5.4114
6.2728
1.00
7.00
2
37
4.0000
1.76383
.28997
3.4119
4.5881
1.00
7.00
3
58
3.9655
1.83500
.24095
3.4830
4.4480
1.00
7.00
Total
152
4.6776
1.95174
.15831
4.3648
4.9904
1.00
7.00
4. Write a short statement to interpret the results of this research.
Students’ responses will vary. However, there were several instances of significant differences
among owners by type of luxury car. The results above suggest that marketers of American cars
Case 5
Say It Ain’t So! Is This the Real Thing?
Objective: The purpose of this case is for students to gain experience using a qualitative research
approach.
Summary: Chapters 1-4, particularly chapter 5, chapters 6 and 14, may be particularly useful in
addressing issues related to this case. David Ortega is the lead researcher for an upscale
restaurant group hoping to add another chain that would compete directly with the upscale Smith
David decides a qualitative research approach will be useful. He wants to understand how the
fine dining experience offers value and what intangibles create value for consumers. He uses a
phenomenological approach, and the primary tool of investigation is conversational interviewing.
Questions:
1. Comment on the research approach. Do you feel it was an appropriate choice?
Cengage. 28
2. [Ethics Question] David did not inform these respondents that he was doing marketing
research during these conversations. Why do you think he withheld this information and was
it appropriate to do so?
Recall from chapter 4 that research participants and researchers have rights and obligations. One
obligation of participants is to be truthful, so one of their rights is to be dealt with truthfully. Most
marketing research is conducted with the research participant’s consent, especially when actively
participating. In some cases, participants are not informed when participation is passive (i.e.,
monitoring scanner data, many types of everyday tracking based on smartphone or internet
David probably thought people would not be open with him if they were told that he was
conducting research. However, if he was truly conversing with enthusiasts, it would seem as
though they would still behave the same way even if they knew they were participating in
research. One alternative to would be to inform the respondents following the interview of how
the data each provided would be used and giving each the opportunity to opt out of being part of
3. [Internet Question] Using the Internet, try to identify at least three restaurants that Smith and
Wollensky competes with and three with whom the new S&W grill may compete.
Ruth’s Chris is certainly a nationwide chain of fine steakhouses that compete in this category.
4. Try to interpret the discussions above. You may use one of the approaches discussed in the
text. What themes should be coded? What themes occur most frequently? Can the different
themes be linked together to form a unit of meaning?
Cengage. 29
Students’ answers will vary, but they should demonstrate an understanding of concepts
presented in chapter 5. For example, hermeneutics is an approach to understanding
phenomenology that relies on analysis of texts in which a person tells a story about him or herself.
Meaning is then drawn by connecting text passages to one another or to themes expressed
5. What is the result of this research? What should David report back to the restaurant group?
It appears, from this very limited number of conversations with respondents, that something has
to be “real” and “genuine” for the price that is being charged. That doesn’t mean that a high price
is always called for, just that the price is right for the level of genuineness.
However, students should point out that exploratory research cannot take the place of conclusive,
confirmatory research. Since many qualitative tools are best applied in exploratory design, they
are likewise limited in the ability to draw conclusive inferences. One of the biggest drawbacks is
Case 6
TABH, INC., Automotive Consulting
Objectives: To encourage students to think about sampling issues and basic data questions. The
case touches ethical issues as well. Data are available from the instructors and student resources
Summary: This case has aspects that touch on nearly every chapter in the text. TABH
consulting specializes in research for automobile dealers in the United States, Canada, Mexico,
and Europe. While most of their research is custom, they also produce a monthly “white paper”
Michel Gonzalez, a junior analyst assigned to this project, contacts the traffic departments at Cal
Poly University and at Central Missouri State University (Note: this university is now named
University of Central Missouri) to obtain data from the students’ automobile parking registration
records. Both schools are willing to provide anonymous data records for a limited number of
students, and Cal Poly allowed Michel a chance to visit during the registration period. This
The purpose of the white paper is to offer car dealers considering new locations a comparison of
the profile of a small town university with the primary market segments for their particular
automobile. TABH wants to appeal to companies with high sales growth in the U.S. (i.e., Kia and
Questions
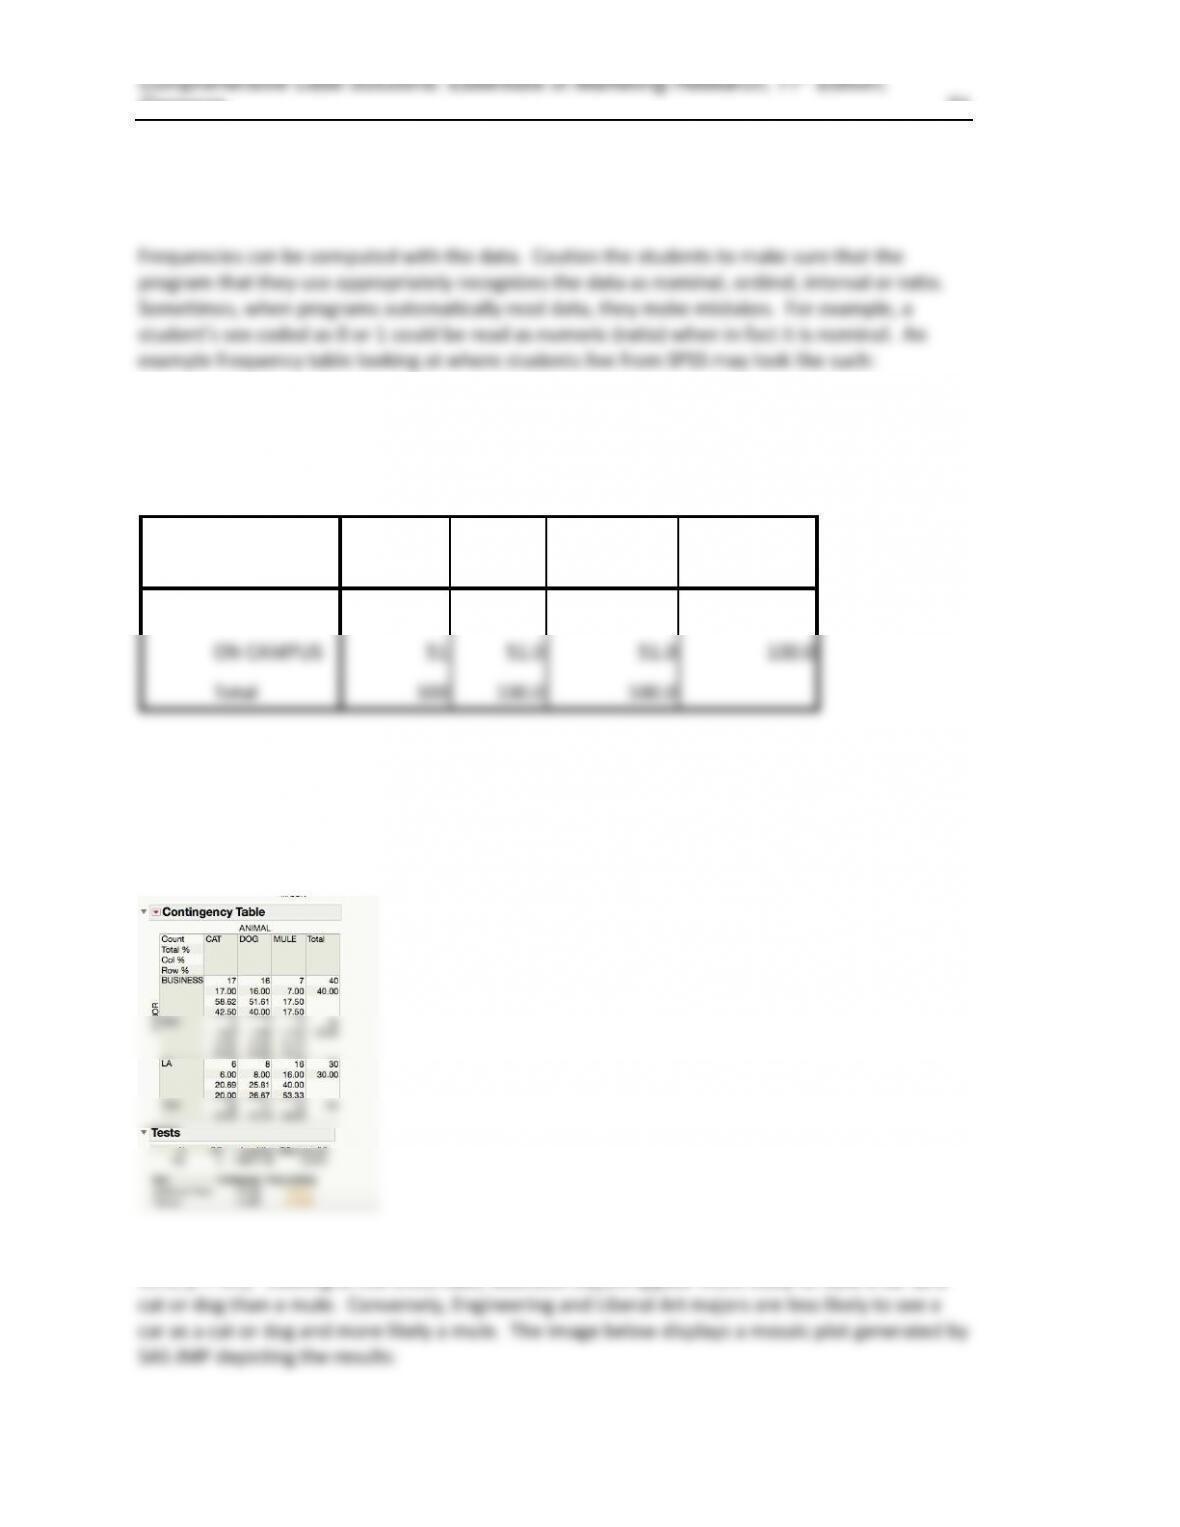
1. What types of tests can be performed using the data that may at least indirectly address the
primary research question?
Cengage. 31
Simple descriptive statistics could be useful. In particular, frequency counts of where students
tend to live could be useful. Frequency counts are appropriate for nominal and ordinal
variables.
RESIDENCE
Frequency
Percent
Valid Percent
Cumulative
Percent
Valid
COMMUTE
49
49.0
49.0
49.0
ON CAMPUS
51
51.0
51.0
100.0
Total
100
100.0
100.0
Realize that all the data are less than interval (nominal/ordinal) so anything beyond frequencies
and cross-tabs is inappropriate. Cross-tabs can be used to look at car type and respondent
characteristics. Here, the “animal” is crossed with the student’s major:
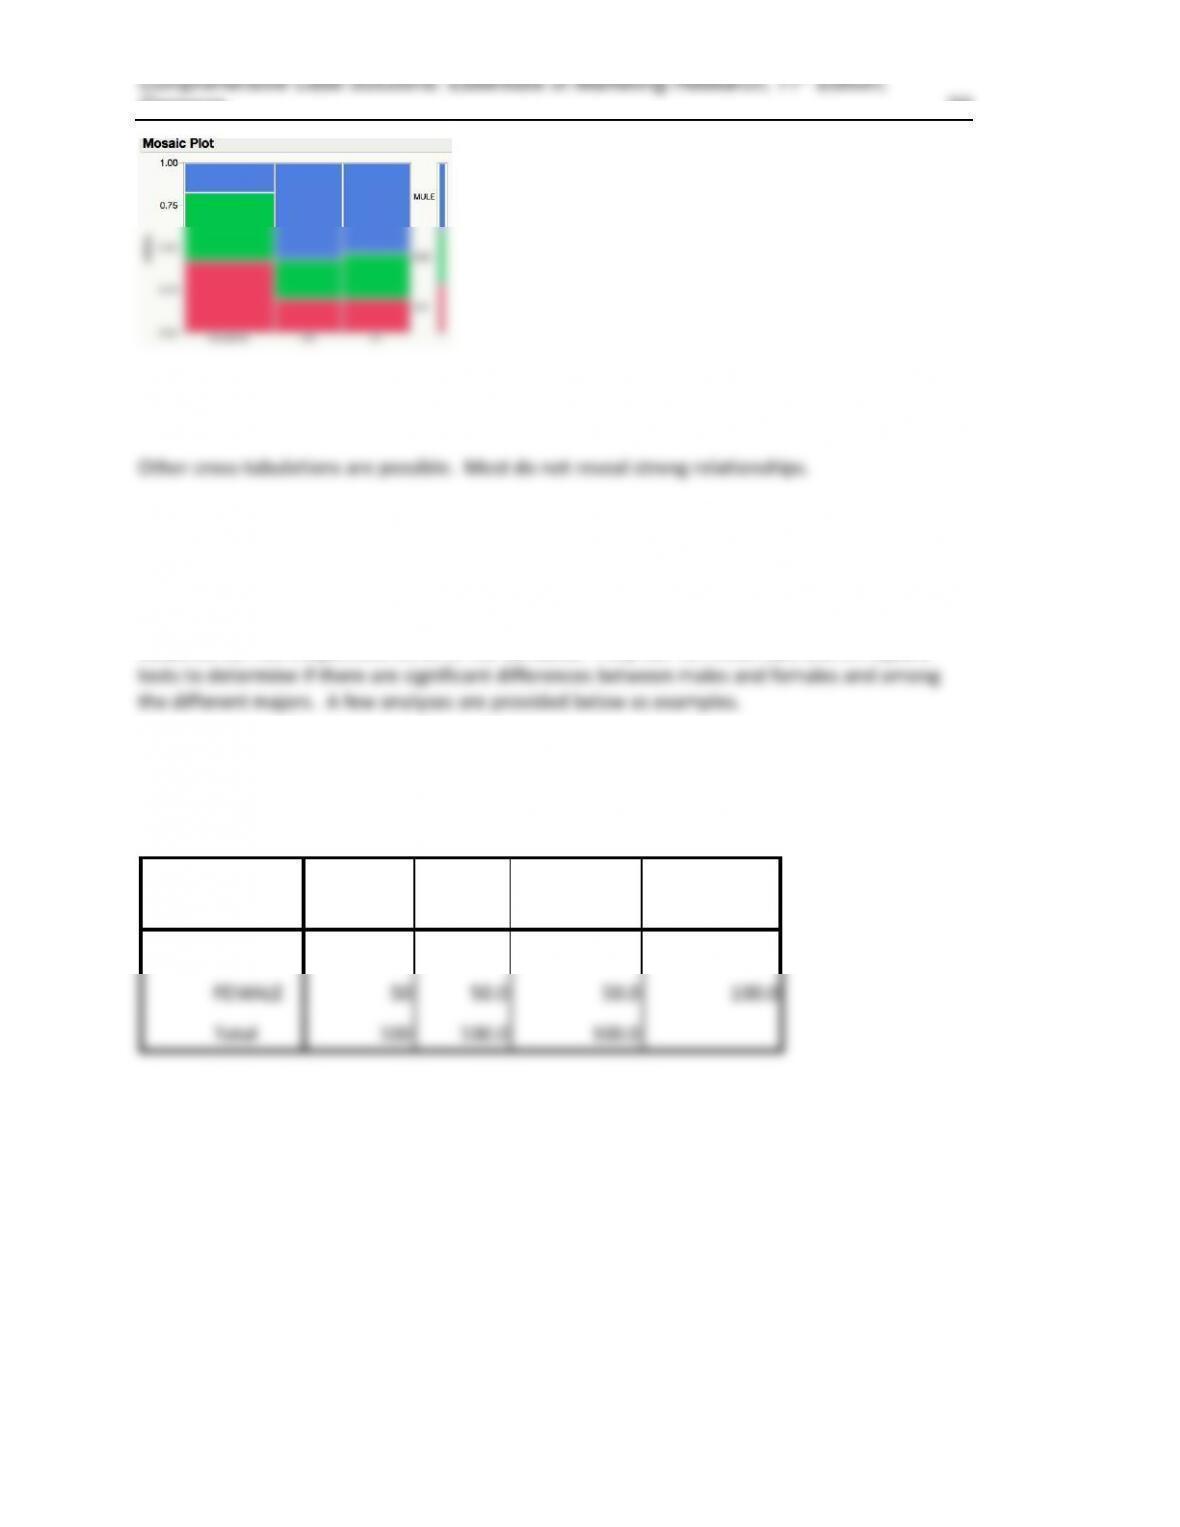
The cross-tabulation suggests a significant relationship between major and animal (chi-square
15.3, p < .01). Looking at the cross-tabs, Business majors appear more likely to view a car as a
Cengage. 32
The disproportionate red and green colors relative to the blue can be helpful in depicting the
results.
2. What do you think the primary conclusions of the white paper will be based on the data
provided?
Students can run frequencies on all of the variables. They can run cross-tabs and chi-square
They tend to be male and female in equal proportions:
SEX
Frequency
Percent
Valid Percent
Cumulative
Percent
Valid
MALE
50
50.0
50.0
50.0
FEMALE
50
50.0
50.0
100.0
Total
100
100.0
100.0
Students in this sample tend to like red cars: