Certain discrete distributions describe many natural phenomena and have broad ap-
plications in statistical process control. Two of them are the binomial distribution and
the Poisson distribution, discussed next. Later, some important continuous probabil-
ity distributions are introduced.
Binomial Distribution
The binomial distribution describes the probability of obtaining exactly x“suc-
cesses” in a sequence of nidentical experiments, called trials. A success can be any one
of two possible outcomes of each experiment. In some situations, it might represent a
E (p)= µ=np
Poisson Distribution
The second discrete distribution often used in quality control is the Poisson distrib-
ution. The Poisson probability distribution is given by
f(x) =
I
MPORTANT
P
ROBABILITY
D
ISTRIBUTIONS
e–µµx
x!
1
Normal Distribution
The probability density function of the normal distribution is represented graphi-
cally by the familiar bell-shaped curve. However, not every symmetric, unimodal
where
µ=the mean of the random variable x
σ2=the variance of x
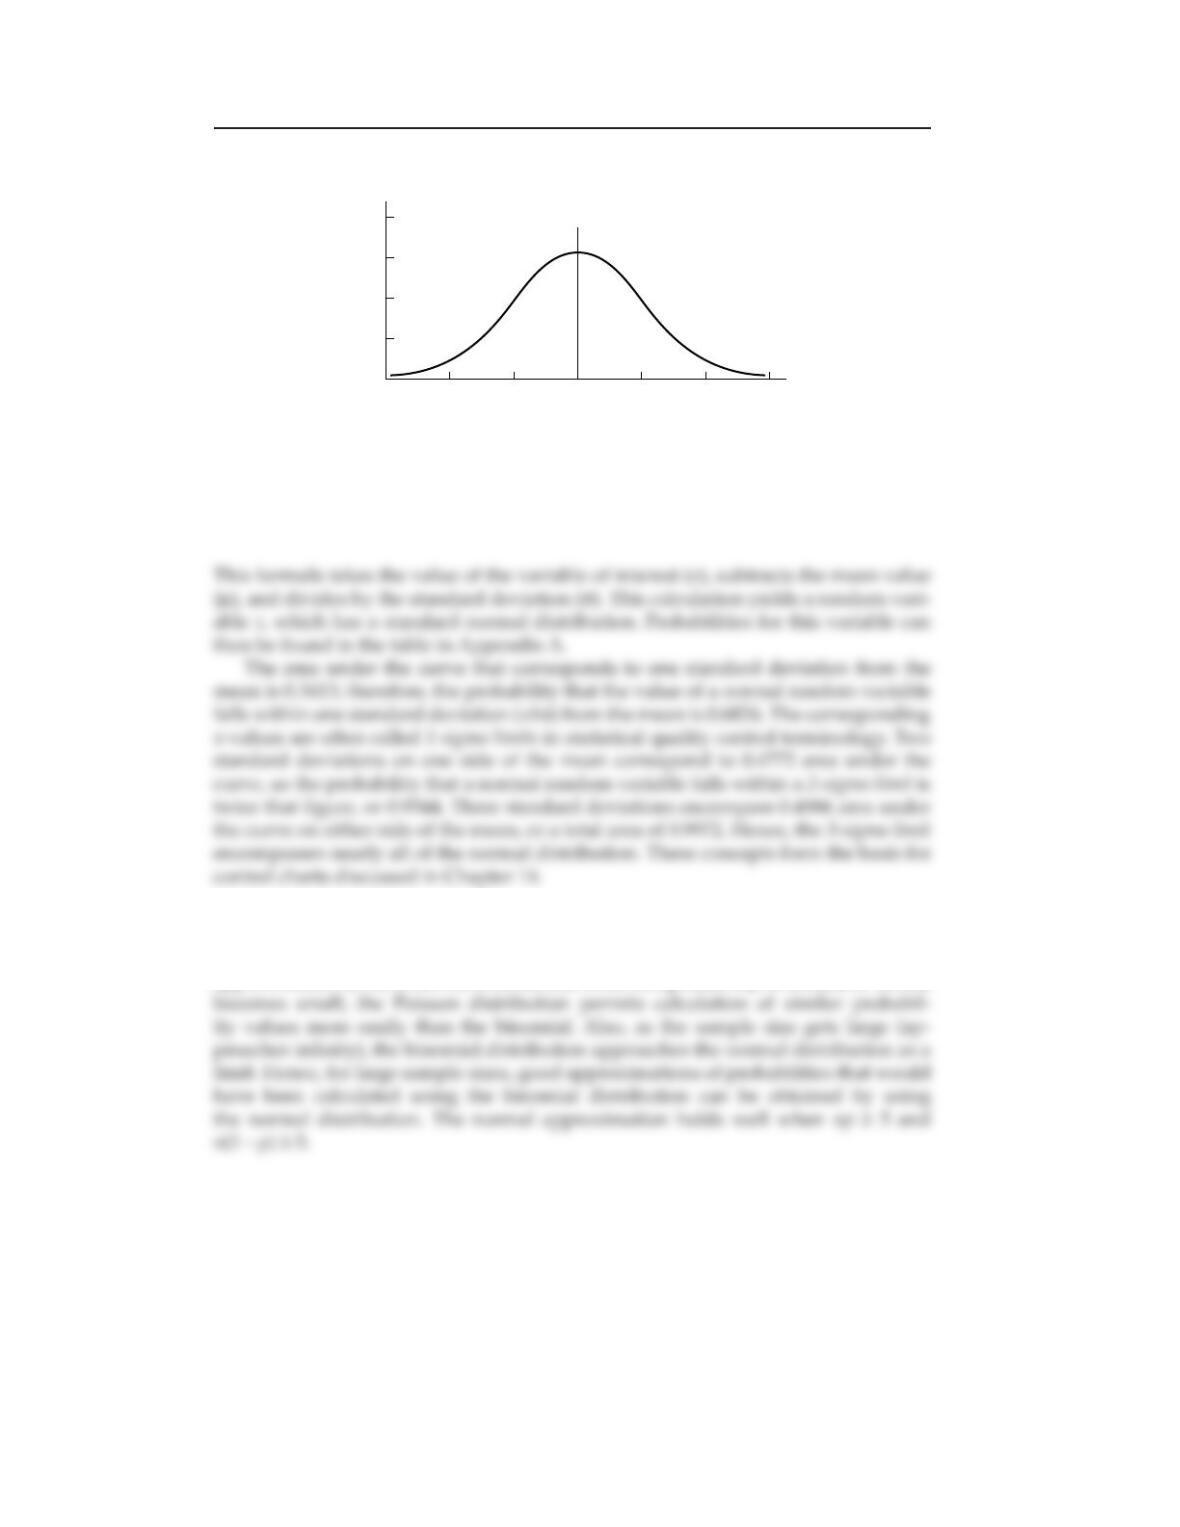
This standard normal distribution function is shown in Figure PD.1. Because σ= 1,
the scale on the zaxis is given in units of standard deviations. Special tables of areas
Table PD.1 Binomial versus Poisson Probability Values
Binomial Poisson
xProbability Probability
00.21464 0.22313
10.33890 0.33467
20.25864 0.25102
2
Normal Approximation to the Binomial Although the binomial distribution is
extremely useful, it has a serious limitation when dealing with either small probabil-
ities or large sample sizes—it is tedious to calculate. The discussion of the Poisson
approximation to the binomial showed that when the probability of success or failure
Exponential Distribution
Another continuous distribution commonly used in quality assurance is the expo-
nential distribution. The exponential distribution is used extensively in reliability
estimation, discussed in Chapter 12. The probability density function for the expo-
nential distribution is much simpler than the one for the normal distribution. There-
fore, direct evaluation is easier, although tabulated values for the exponential distri-
3
0
–2–3 –1 0 1 2 3
z
Standard Deviation Units
0.10
0.20
0.30
0.40
f(z)
Figure PD.1 Standard Normal Distribution
bution are also readily available (see Appendix F). The formula for the exponential
probability density function is
f(x)= e–x/µ,x≥0
1
µ
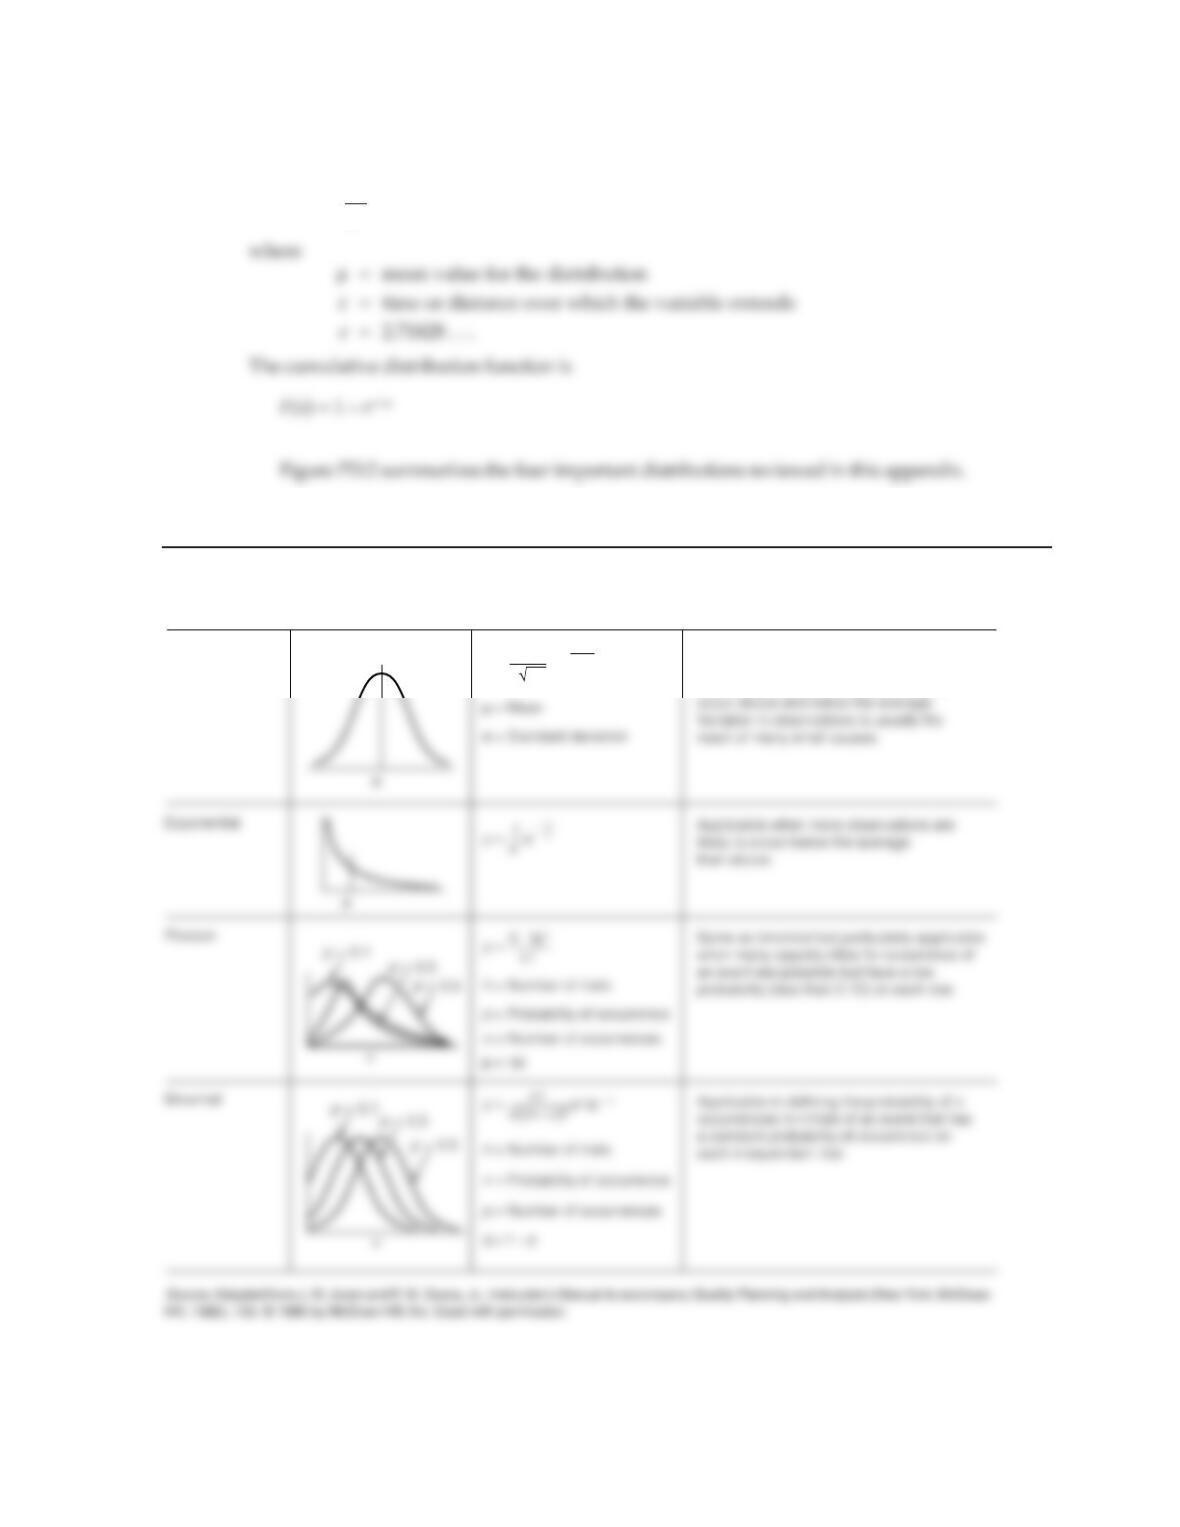
Figure PD.2 Summary of Common Probability Distributions Used in Quality Assurance
Distribution Form Probability Function Comments on Application
Normal
Applicable when a concentration of
observations falls about the average and
when observations are equally likely to
y
=
1
σ
2
π
e
–
(
x –
µ)2
2σ2
4