Unlock document.
This document is partially blurred.
Unlock all pages and 1 million more documents.
Get Access
Understanding Financial Statements
B-
12
Long-Term Debt to Capital Structure. Long-term debt divided by long-term debt
plus shareholders’ equity. It expresses long-term debt as a percentage of the
Debt to Assets Ratio. This shows the percentage of total assets financed by
creditors. It is computed by dividing total debt by total assets. For
Activity Ratios
Activity ratios describe a relationship between an income statement and
Asset Turnover. This is sales divided by total assets. It measures asset
Inventory Turnover. This is the cost of goods sold divided by average
inventory. It measures the number of times inventory is “turned over” or sold
during a year. Using cost of goods sold as the numerator excludes any element
Average Collection Period. For the average collection period, the numerator
is accounts receivable while the denominator is average daily sales (sales
Understanding Financial Statements
B-
13
A CLOSER LOOK AT THE INCOME STATEMENT
Because the income statement shows how much profit a company earned or the
size of the loss it incurred, the income statement is often referred to as
the profit and loss or P&L statement. The income statement shows the results
of operations for the time period specified: it shows revenue earned during
the period and the expenses that were incurred to earn that revenue. A
classified income statement, such as that prepared by Serendipity, separates
sources of revenue and types of expenses.
Revenue. The first item on an income statement is the company’s principal
Cost of Goods Sold (COGS). For a merchandise firm, COGS is the acquisition
cost of the merchandise sold plus the cost of freight-in. For a manufacturer,
Gross Margin (Gross Profit). Gross margin or profit is the excess of net
Depreciation and Amortization. Depreciation and amortization are means to
spread the cost of long-lived assets over the periods they are expected to
benefit. For example, if a company buys a heavy-duty truck with an economic
Selling, General, and Administrative Expenses (SG&A). This amount includes
all usual and recurring operating expenses with the exception of COGS.
Operating Income. This amount is the excess of operating revenues over
operating expenses. Because it excludes the results of financing and
Dividend and Interest Income/Interest Expense. In a classified income
statement, revenues generated by investing activities are shown separately
Income Before Income Taxes and Extraordinary Items. This line shows pre-tax
income from both operating and financing or investing activities. It takes
Understanding Financial Statements
B-
14
Income Taxes. Income taxes are shown as the amount that would be due on
income shown for financial accounting purposes. Because of timing differences
Income Before Extraordinary Items. This line shows after-tax income earned
Extraordinary Items. Companies experience events that can be described as
both unusual and infrequent in some years. The effects of these items are
Net Income. This line shows the net after-tax effect once all revenues and
all expenses for a period of time are considered.
Statement of Changes in Shareholders’ Equity. If there have been many,
complex transactions affecting ownership interests, a company may choose to
Understanding Financial Statements
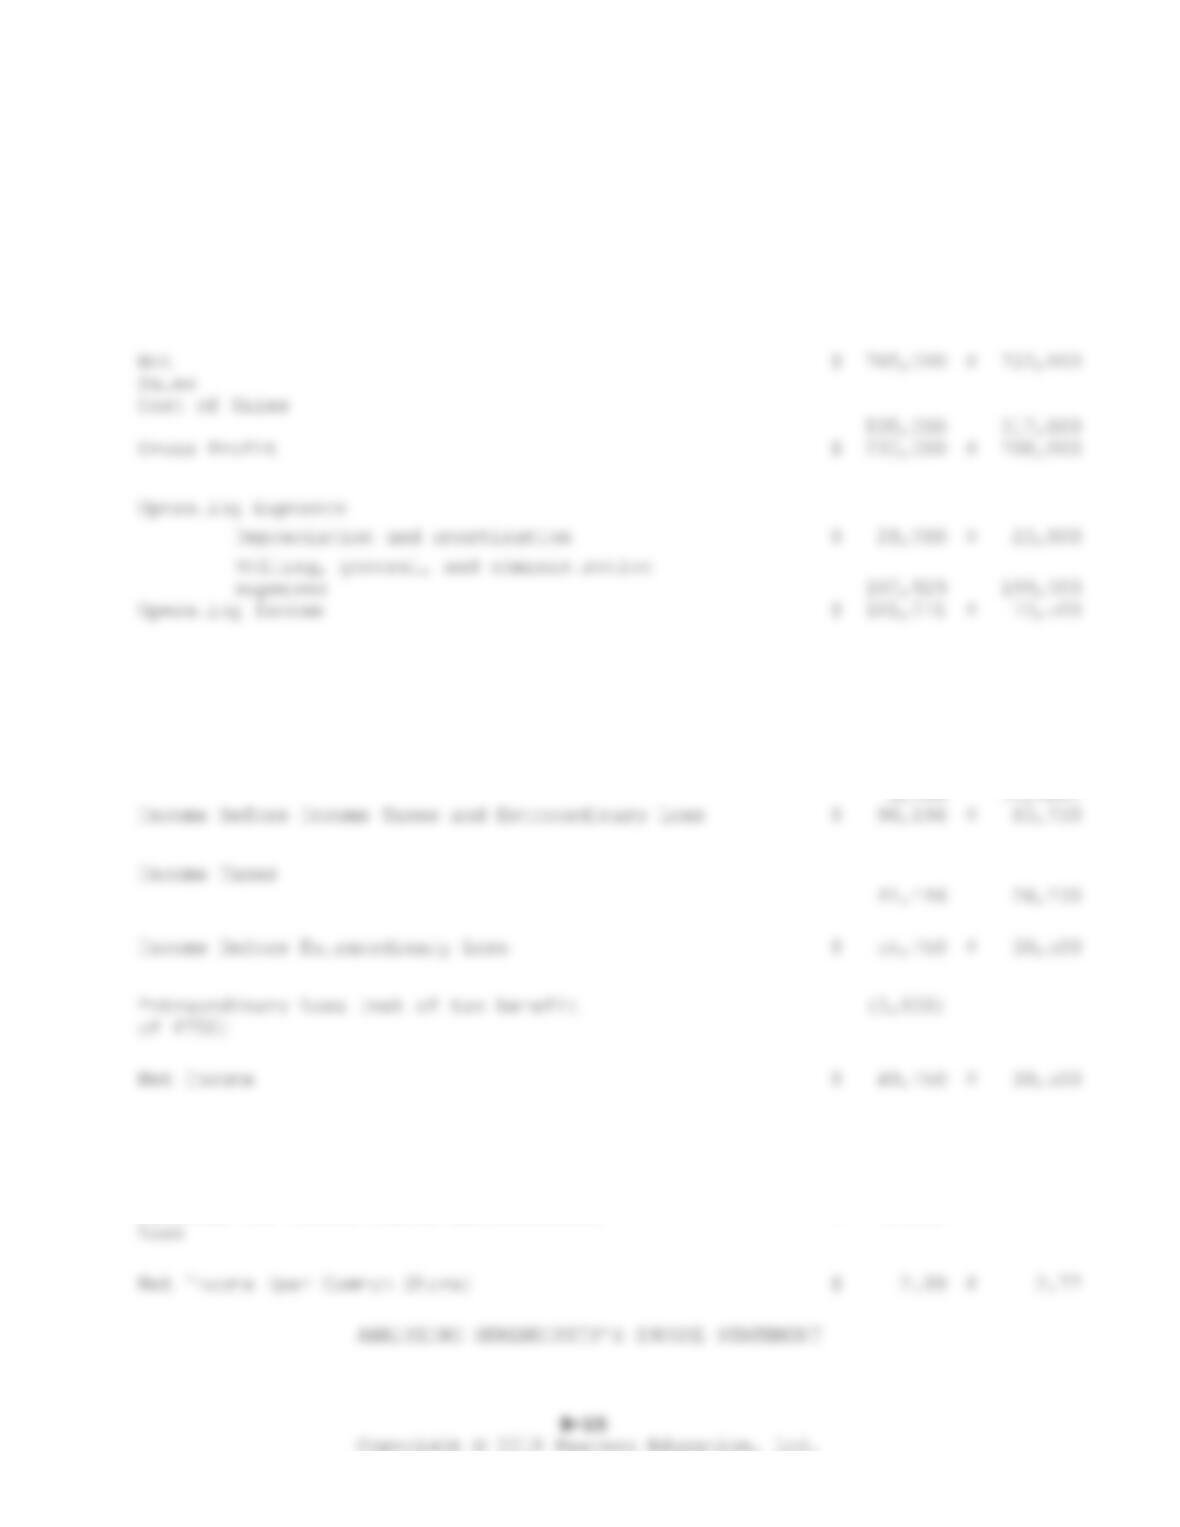
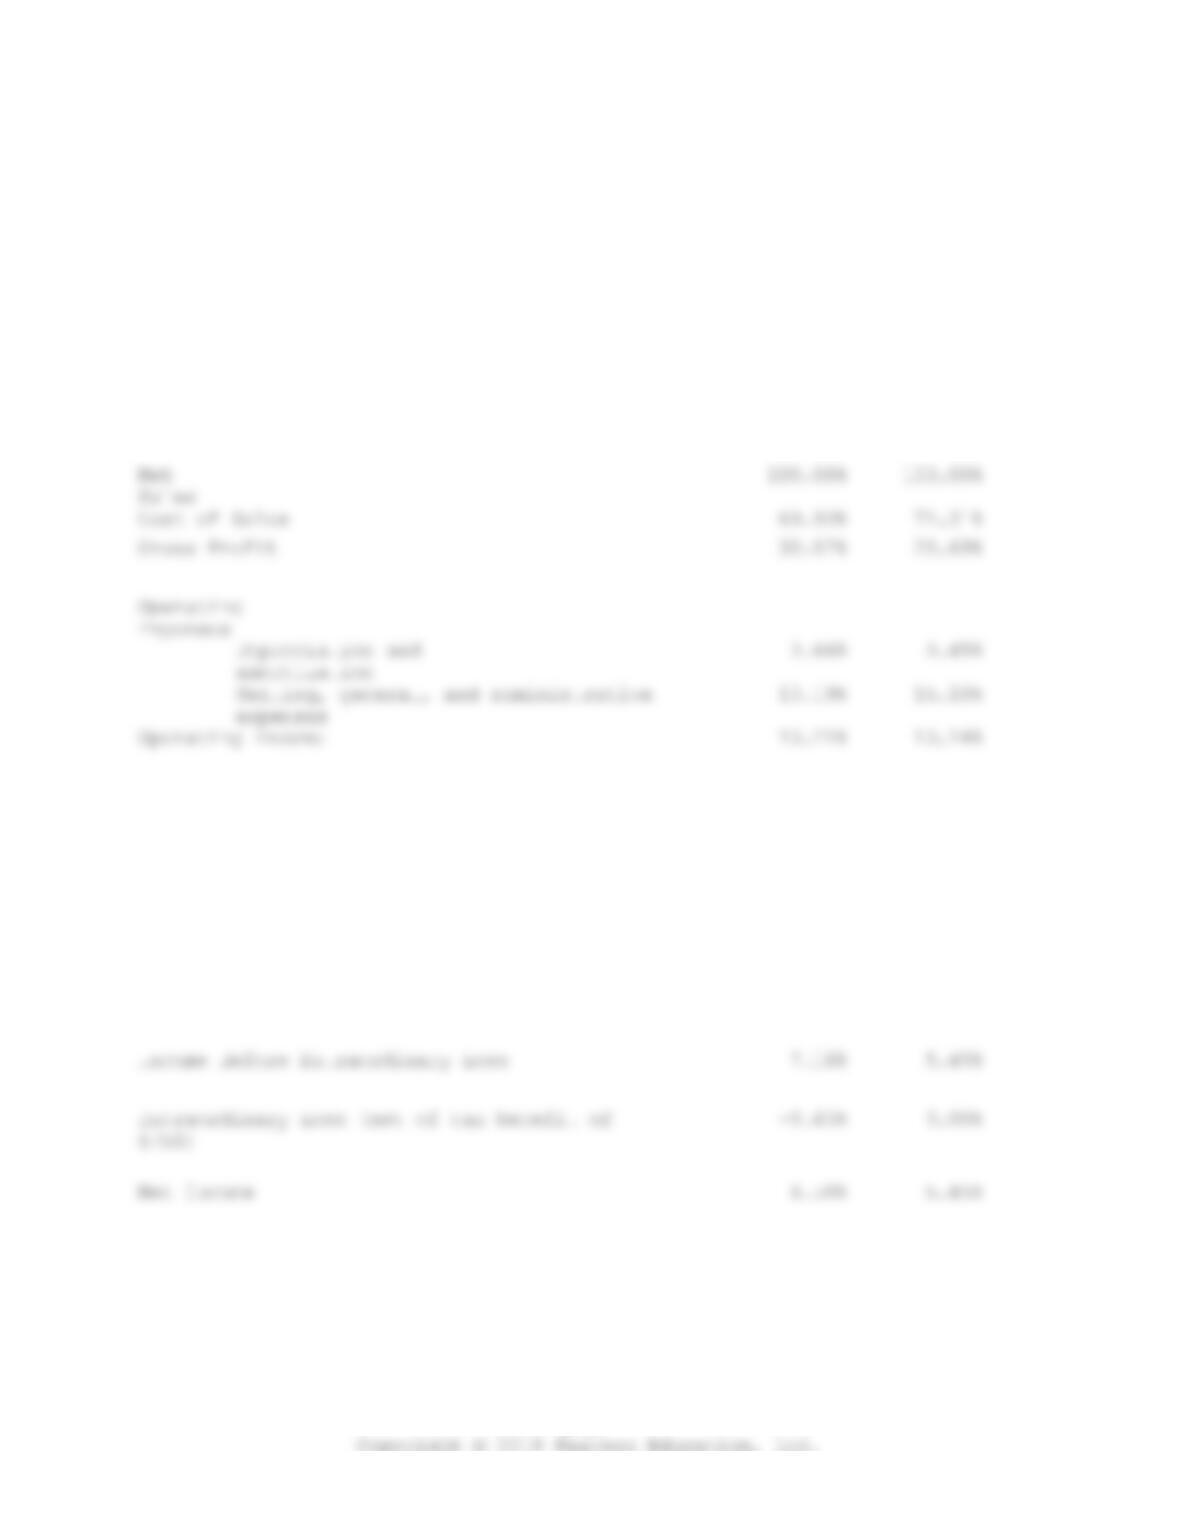
Serendipity Manufacturing Co., Inc.
CONSOLIDATED INCOME STATEMENT
2016
2015
Years ended December 31, 2016 and 2015 (in
thousands)
Other Income (Expense)
Dividend and Interest Income
$ 5,250
$ 9,500
Interest Expense
(12,125)
(16,250)
Foreign Currency gains (losses)
Earnings per Common Share before Extraordinary
Loss
$ 3.32
$ 2.72
Earnings per Common Share, Extraordinary
$ (0.33)
Understanding Financial Statements
B-
16
Gross Profit Margin. Gross margin percentage expresses gross margin as a
percentage of sales. Serendipity’s gross margin was 30.1 percent of sales in
Operating Margin of Profit. Operating margin of profit is computed by
dividing operating profit by sales. For Serendipity, this measure shows that
Net Profit Ratio. Net profit divided by sales is another way to evaluate
Asset Turnover Ratio. As noted in the discussion of the balance sheet
analysis, this ratio shows how many dollars in sales were generated by each
Return on Assets. Return on assets is calculated by dividing net income by
Return on Equity. Return on equity measures the rate of return on the book
value of the shareholders’ total investment in the company. In 2016 ROE for
Times Interest Earned. This measure indicates the ability of a company to
meet its required interest payments on debt. It is computed by adding
A “common size” income statement is an important analytical tool. Because a
common size statement expresses each income statement element as a percentage
of sales, it highlights changes and trends in a company’s operating
performance, and provides a basis for comparison to industry averages:
Understanding Financial Statements
B-
17
Serendipity
Manufacturing
Company, Inc.
CONSOLIDATED INCOME
STATEMENT
(Common Size)
Years ended December 31, 2016 and 2015 (in
thousands)
Other Income (Expense)
Dividend and Interest
Income
Interest Expense
1.58%
2.24%
Foreign Currency gains
(losses)
0.26%
-0.14%
Income Before Income Taxes and Extraordinary Loss
12.57%
9.07%
Income Taxes
5.42%
3.48%
RELATIONSHIP BETWEEN THE INCOME STATEMENTS
AND THE BALANCE SHEET
The balance sheet is prepared at a point in time; it shows what the company
owns (assets) and what the company owes (liabilities owed to outsiders plus
Understanding Financial Statements
B-
18
the residual interest owed to owners) at a specific date. Ownership interest
is increased by (1) owners investing additional cash or property, or (2) the
company earning more revenue than expenses. Earning an excess of revenue over
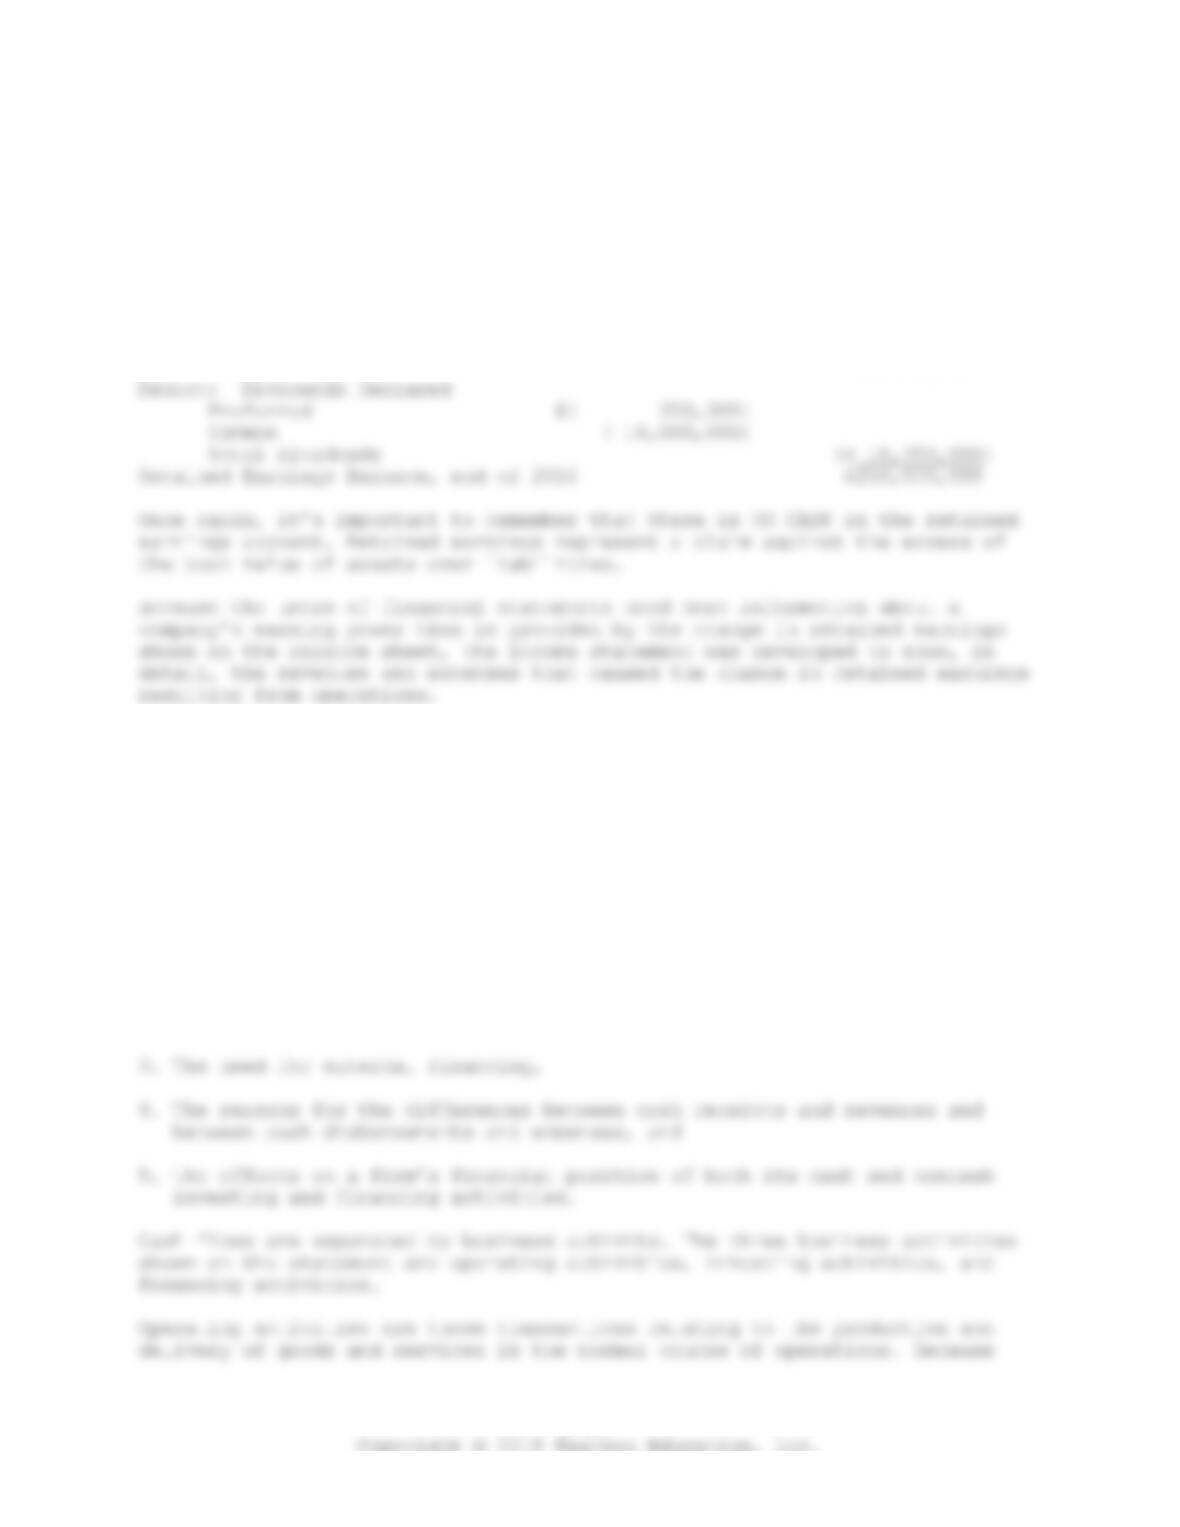
expenses increases an ownership equity account called retained earnings.
Retained earnings are a historical record of earnings retained in the
business. It is increased by earning a net income and decreased by both
losses and declaration of dividends. Using Serendipity as an example, here’s
how it works:
Retained Earnings Balance, end of 2015 $218,600,000
Add: 19X9 Net Income 49,750,000
STATEMENT OF CASH FLOWS
Although the balance sheet and the income statement provide the investor
information about a company’s financial position at a point in time and the
results of operations for a period of time, neither statement shows in any
detail the result of investing and financing activities. The statement of
cash flows was developed to provide detailed information about the impact on
cash of the operating activities of a company (summarized in the income
statement) as well as its investing and financing activities. Specifically,
the statement is intended to help financial statement readers assess:
1. The ability to generate positive future cash flows,
2. The ability to meet its obligations and pay dividends,
Understanding Financial Statements
B-
19
Serendipity’s financial statements are prepared using the accrual basis of
accounting, cash receipts are not equivalent to net income.
Serendipity’s Consolidated Statement of Cash Flows was prepared using the
indirect method. The indirect method begins with net income and makes various
Understanding Financial Statements
B-
20
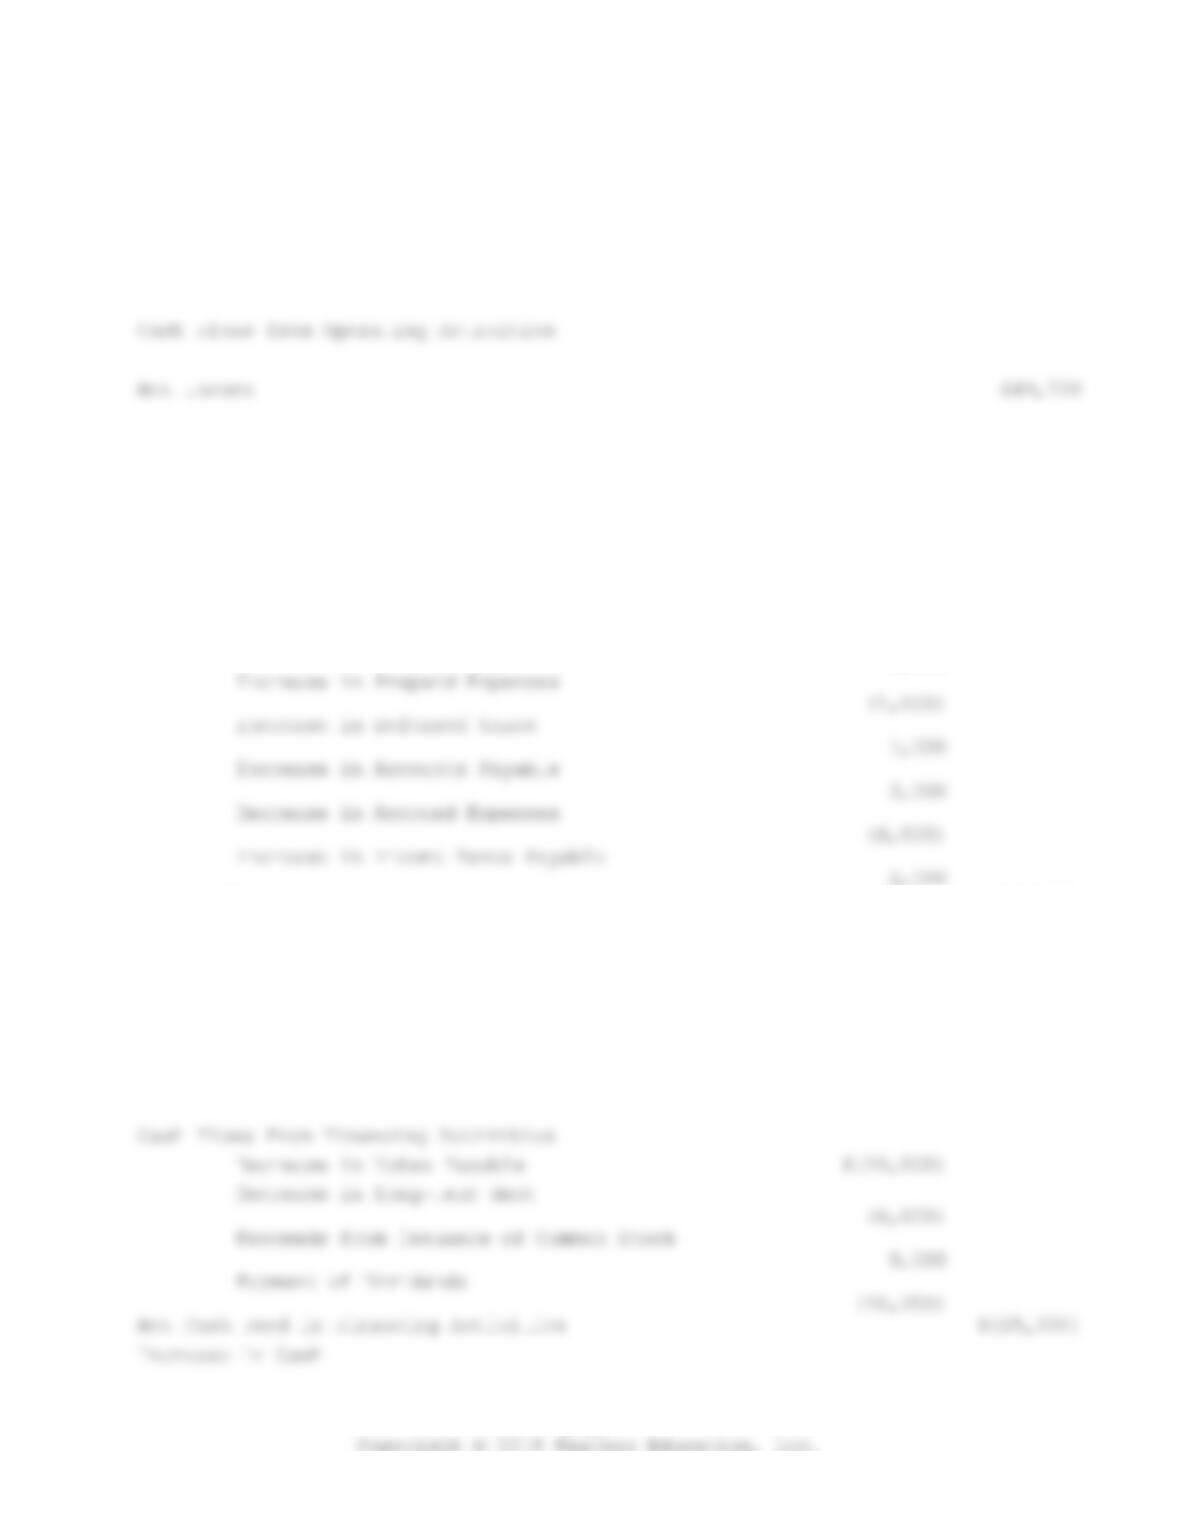
Serendipity Manufacturing Co., Inc.
CONSOLIDATED STATEMENT OF CASH FLOWS
Year ended December 31, 2016 (in thousands)
Adjustments to Reconcile Net Income to
Net Cash
from Operating Activities
Depreciation and Amortization
$28,000
Increase in Marketable
Securities
(8,000)
Increase in Accounts Receivable
(11,000)
Decrease in Inventory
5,000
Total Adjustments
$19,000
Net Cash Provided by Operations
$68,750
Cash Flows from Investing Activities
Purchase of Fixed Assets
$(38,400)
Net Cash Used for Investing Activities
$(38,400)
Understanding Financial Statements
B-
21
5,000
Cash at Beginning of Year
15,000
Cash at End of Year
$20,000
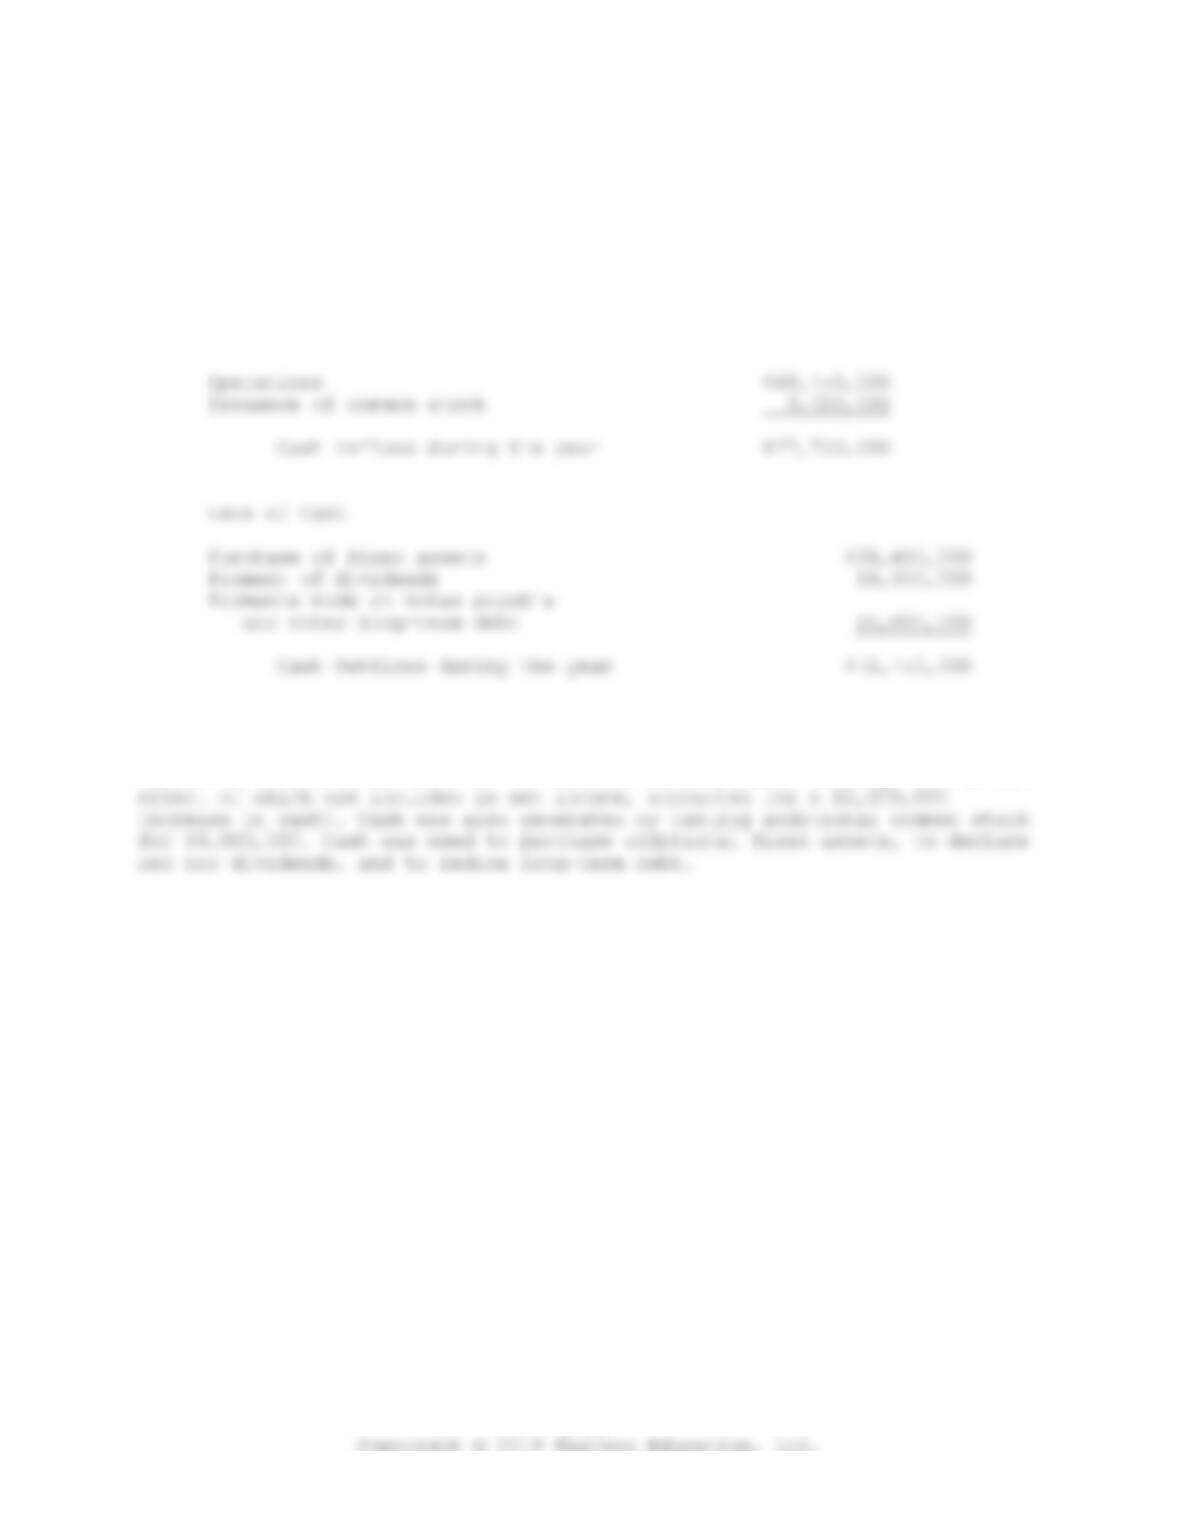
Here’s how we might interpret Serendipity’s cash flow statement:
Sources of Cash:
Serendipity’s cash balance increased by $5,000,000 from the end of 2015 to
the end of 2016. Operations were a significant source of cash, generating an
excess of cash-in over cash-out of $68,750,000 (favorable exchange rates, the


