
1
PART C
Additional Instructor Resources
HANDOUT: UNDERSTANDING FINANCIAL STATEMENTS
The following pages contain a paper by Maryanne Rouse of the University of South Florida. It can be very useful to
those students who need to improve their knowledge of financial analysis, ratios, and so on. You are free to make
UNDERSTANDING FINANCIAL STATEMENTS
Maryanne M. Rouse
University of South Florida
Financial statements serve as both milestones and signposts. As milestones, financial statements help the reader
assess the past financial performance and current financial condition of a proprietorship, partnership, or corporation.
As signposts, financial statements provide information about the past and present that is useful in predicting future
financial performance and condition.
BASES OF ACCOUNTING
Although there are hybrid systems that combine elements of both, the two most widely used bases of accounting are
the cash basis and the accrual basis.
Cash Basis—Under the cash basis of accounting, revenue is recognized when cash is received and expenses are
recognized when cash is disbursed. Many small businesses and most individuals use the cash basis of accounting
Accrual Basis—Under the accrual basis of accounting, revenues are recognized when they are realized and
expenses are matched against revenue.
4
Important measurement assumptions and concepts that underlie the preparation and interpretation of financial
statements include the following.
Entity Assumption—Regardless of its form (corporation, partnership, proprietorship), a business enterprise
exists separate and apart from its owners.
GENERALLY ACCEPTED ACCOUNTING PRINCIPLES
Generally Accepted Accounting Principles (GAAP) is a set of “ground rules” for valuing, recording, presenting, and
disclosing financial information. The principles set forth in GAAP are intended to (1) help ensure consistency in the
financial statements of a given firm from period to period and (2) provide some assurance that the financial
statements of one firm can be compared to those of another.
AUDITED, REVIEWED, COMPILED
A firm’s management is responsible for the content and preparation of financial statements; however, the
involvement of independent accountants enhances the credibility of management-prepared statements.
When a CPA is involved in compiling management-provided financial data in the form of a financial report but
performs no other procedures, she/he will provide a Compilation Report. A Compilation Report informs the reader
that the accountant expresses no opinion on the statements and provides no assurances about the financial
information presented.
5
ELEMENTS OF FINANCIAL POSITION: THE BALANCE SHEET
The balance sheet provides a “snapshot” of a firm’s financial position. Prepared at a point in time, the balance sheet
shows what the firm owns (assets) and owes (liabilities owed to outsiders plus the residual interest owed to
shareholder/owners).
Assets. An asset is something the firm owns that has future economic benefit. An item cannot be recorded as an
Liabilities. Liabilities are obligations to pay or convey assets in the future based on past transactions. Liabilities are
Shareholders’ Equity. Shareholders’ equity is the ownership interest of those who have invested in the company
through the purchase of capital stock. Shareholders’ equity account classifications include capital stock, additional
The Accounting Equation. Assets will always equal liabilities plus shareholders’ equity. This is not sleight of hand
A CLOSER LOOK AT THE BALANCE SHEET
ASSETS
Current Assets
Cash—Cash and cash equivalents including currency, bank deposits, and various marketable securities that can be
Marketable Securities—Short-term equity and debt investments that are readily marketable and which the company
Accounts Receivable—Amounts due from customers that have not yet been collected. Accounts receivable should
Inventories—Represent items that have been manufactured or purchased for resale to customers. The generally
Prepaid Expenses/Other Current Assets—Usually minor elements of the balance sheet, “prepaids” represent
Non-Current Assets
Property, Plant & Equipment—Also referred to as “fixed assets,” PP&E generally includes such long-lived elements
as land, buildings, machinery, equipment, furniture, automobiles, and trucks. PP&E is recorded at historical cost and
Intangibles—Assets with no physical substance but which often have great economic value. Only those intangibles
LIABILITIES
Current Liabilities
Accounts Payable—The amounts the company owes to regular business creditors from whom it has bought goods
7
Other Current Liabilities—Might include warranty obligations and unearned revenue. If interest payable is a
Long-Term Liabilities
Deferred Income Taxes—Created by using different accounting methods for financial and tax purposes. For
example, a company may use accelerated depreciation for tax purposes and straight-line depreciation for financial
Debentures—A major source of funds for large firms, also known as bonds payable. A bond is written evidence of a
long-term loan. It is really a promissory note containing the firm’s promise to (1) pay periodic interest (usually semi–
SHAREHOLDERS’ EQUITY
Preferred Stock—Capital stock with certain preferences as to dividends and distribution of assets in the event of
liquidation. For Serendipity, the preferred stock is $5.83 cumulative $100 par value. Par value is a legal concept: it is
Common Stock—Generally voting stock with no specified dividend payment; however, companies may have
several classes of common stock, which may include non-voting common stock.
Additional Paid-In Capital—Results from selling preferred or common stock at more than its par value. For
example, if 100 shares of $10 par value common stock were sold for $1,500, $1,000 would be shown as common
Retained Earnings—Historical record of earnings retained in the business. It’s important to remember that there is
no cash in retained earnings. Rather, retained earnings represent a claim against the excess of assets over liabilities.
Other Items—Treasury stock is the company’s own stock that has been issued, is fully paid, and has been
8
Serendipity
Manufacturing
Company, Inc
CONSOLIDATED BALANCE SHEET
December 31, 2000 and 1999 (dollars in thousands)
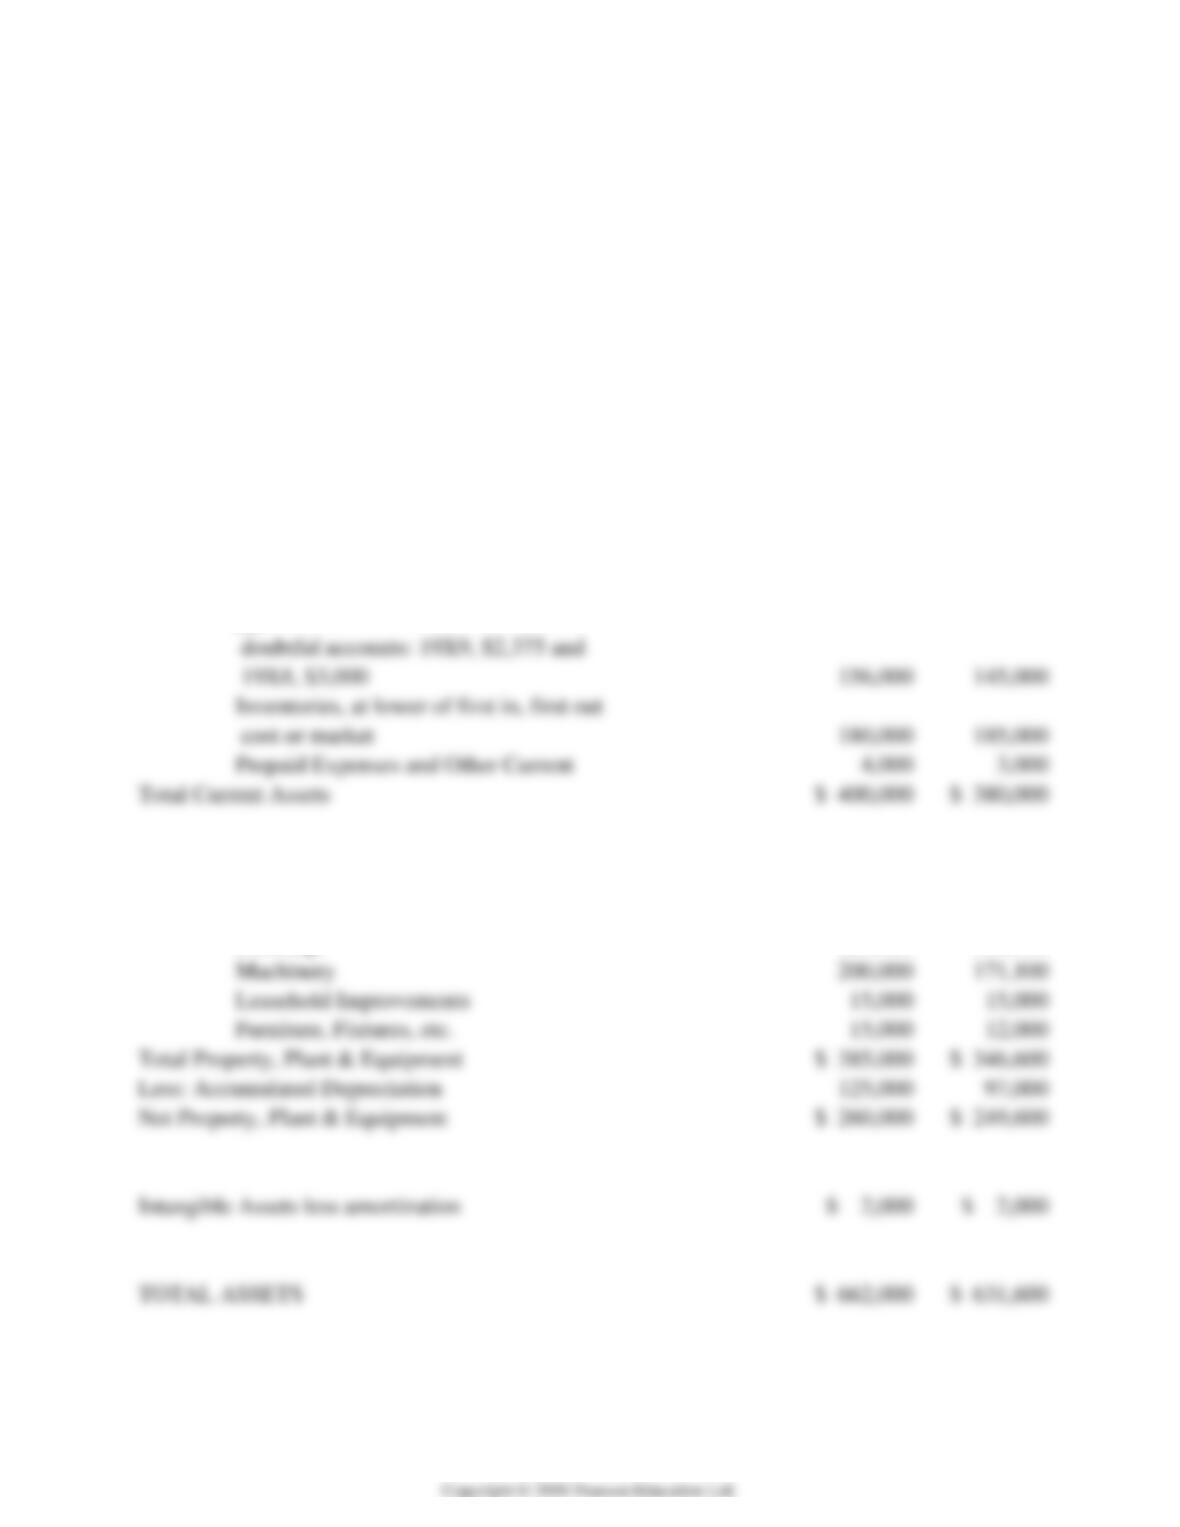
ASSETS
2000
1999
Current Assets
Cash
$ 20,000
$ 15,000
Marketable Securities at market value
40,000
32,000
Accounts Receivable, less allowance
for
doubtful accounts: 19X9, $2,375 and
19X8, $3,000
156,000
145,000
Inventories, at lower of first in, first out
cost or market
180,000
185,000
Prepaid Expenses and Other Current
Property, Plant & Equipment
Land
$ 30,000
$ 30,000
Buildings
125,000
118,500
Machinery
Leasehold Improvements
15,000
15,000
Furniture, Fixtures, etc.
15,000
12,000
Total Property, Plant & Equipment
Less: Accumulated Depreciation
125,000
97,000
Net Property, Plant & Equipment
Intangible Assets less amortization
$ 2,000
$ 2,000
TOTAL ASSETS
9
Serendipity
Manufacturing
Company, Inc
December 31, 2000 and 1999 (dollars in thousands)
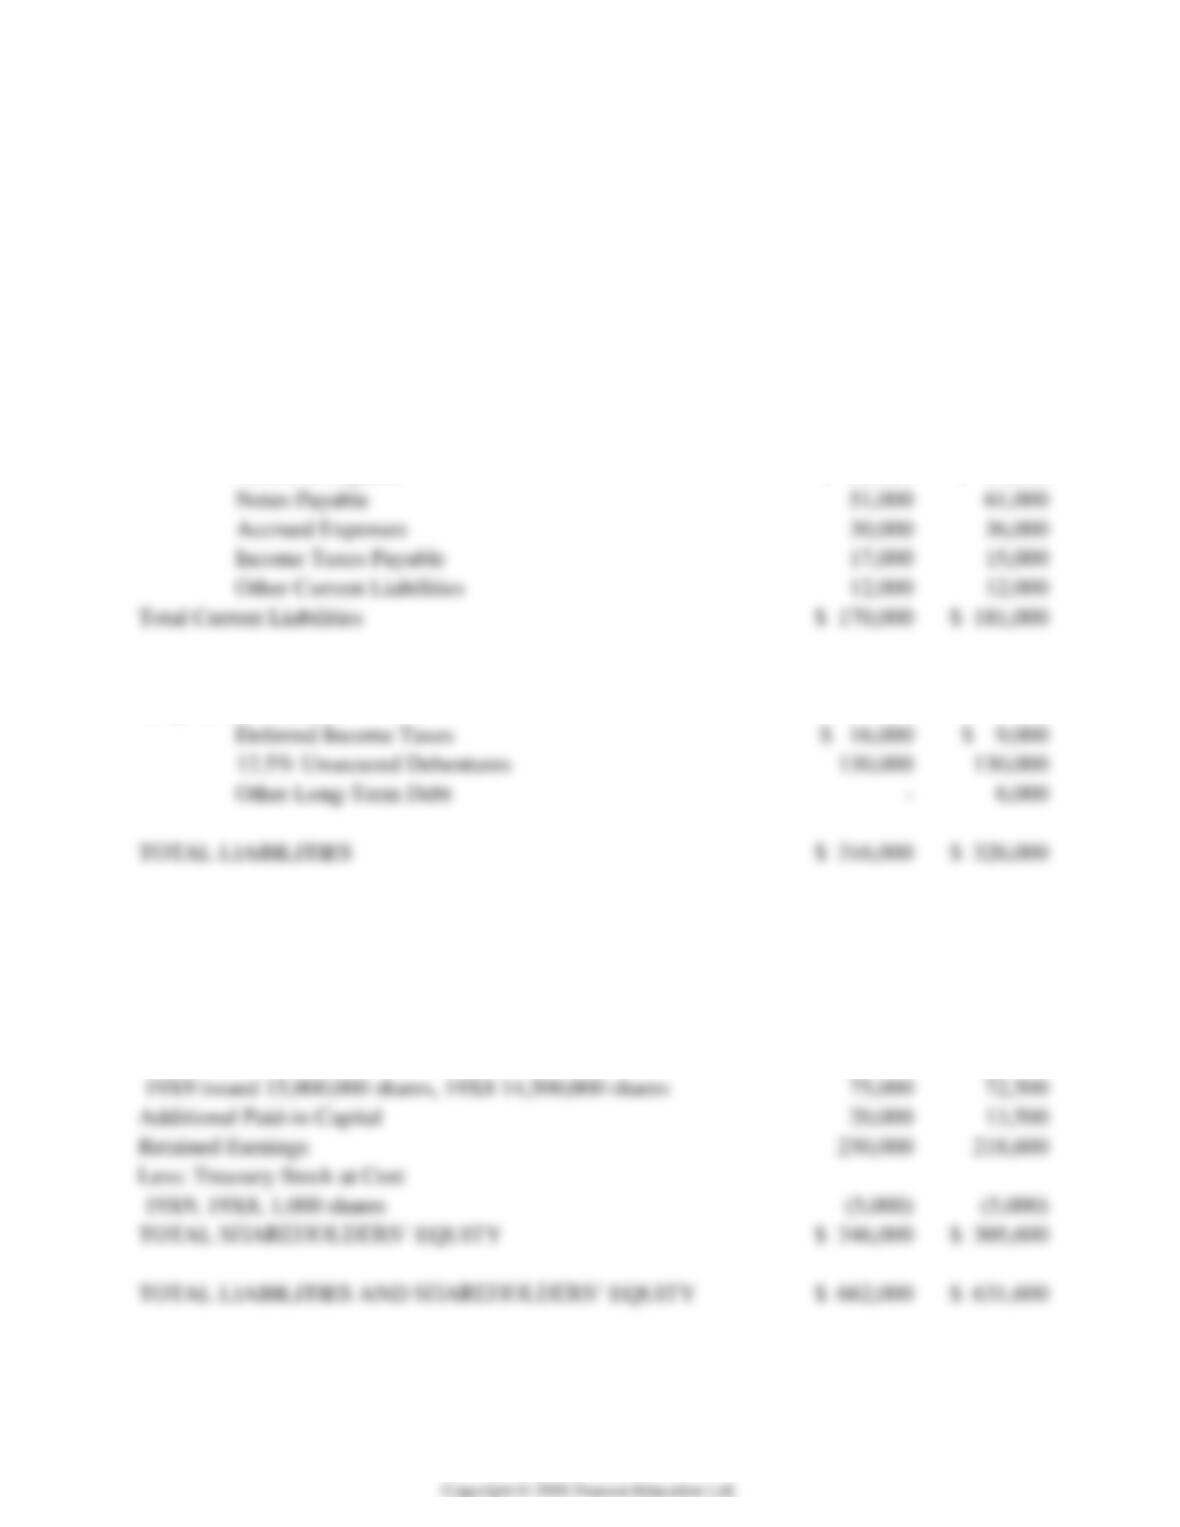
LIABILITIES
2000
1999
Current Liabilities
Accounts Payable
$ 60,000
$ 57,000
Notes Payable
Accrued Expenses
Income Taxes Payable
Other Current Liabilities
Total Current Liabilities
Long-Term Liabilities
Deferred Income Taxes
$ 16,000
$ 9,000
12.5% Unsecured Debentures
TOTAL LIABILITIES
SHAREHOLDERS’ EQUITY
Preferred Stock, $5.83 cumulative, $100 par value,
Authorized, issued, and outstanding, 60,000 shares
$ 6,000
$ 6,000
Common Stock, $5 par value, authorized 20,000,000 shares,
19X9 issued 15,000,000 shares, 19X8 14,500,000 shares
Additional Paid-in Capital
Retained Earnings
Less: Treasury Stock at Cost
19X9, 19X8, 1,000 shares
TOTAL SHAREHOLDERS’ EQUITY
10
ANALYZING SERENDIPITY’S BALANCE SHEET
Investors, creditors, and other users of financial statements often analyze relationships between or among balance
sheet accounts using ratios. The three types of ratios used most often are liquidity ratios, leverage ratios, and activity
ratios.
Liquidity Ratios
Liquidity ratios focus on working capital accounts and provide information about a company’s ability to meet
Current Ratio—Current assets divided by current liabilities. It tells how many dollars of current assets are available
to cover each dollar of current liabilities. For Serendipity, the current ratio for 2000 was $400,000/$170,000 or 2.35
Quick Ratio—“Quick” assets (current assets minus inventories, prepayments, and other current assets) divided by
Cash Ratio—Cash divided by current liabilities. The cash ratio shows how much cash is available for each dollar of
current liabilities. Serendipity’s cash ratio for 2000 was $20,000/$170,000 or .12/1: the company has $.12 of cash
Leverage Ratios
Leverage ratios provide information about the relationship between the financing provided by owners (shareholders’
Debt to Equity Ratio—Total liabilities divided by total shareholder’s equity. Serendipity’s debt to equity ratio for
Long-Term Debt to Capital Structure—Long-term debt divided by long-term debt plus shareholders’ equity. It
expresses long-term debt as a percentage of the sum of long-term debt and equity financing. For 2000, Serendipity’s
Debt to Assets Ratio—Shows the percentage of total assets financed by creditors. It is computed by dividing total
11
Activity Ratios
Asset Turnover—Sales divided by total assets. It measures asset utilization: how many dollars of sales are generated
Inventory Turnover—Cost of goods sold divided by average inventory. It measures the number of times inventory is
“turned over” or sold during a year. Using cost of goods sold as the numerator excludes any element of gross profit.
Average Collection Period—For average collection period, the numerator is accounts receivable while the
A CLOSER LOOK AT THE INCOME STATEMENT
Because the income statement shows how much profit a company earned or the size of the loss it incurred, the
income statement is often referred to as the profit and loss statement, or P&L. The income statement shows the
results of operations for the time period specified: it shows revenue earned during the period and the expenses that
were incurred to earn that revenue. A classified income statement, such as that prepared by Serendipity, separates
sources of revenue and types of expenses.
Cost of Goods Sold (COGS)—For a merchandise firm, COGS is the acquisition cost of the merchandise sold plus
Gross Margin (Gross Profit)—Gross margin/profit is the excess of net sales over COGS. Gross margin is the amount
available to cover operating and financing expenses and provide for a profit.
Depreciation and Amortization—Depreciation and amortization are means to spread the cost of long-lived assets
over the periods they are expected to benefit. For example, if a company buys a heavy-duty truck with an economic
Selling, General, and Administrative Expenses (SG&A)—This amount includes all usual and recurring operating
expenses with the exception of COGS. Showing these amounts separately allows a comparison of gross margin to
12
Operating Income—This amount is the excess of operating revenues over operating expenses. Because it excludes
Dividend and Interest Income/Interest Expense—In a classified income statement, revenues generated by investing
Income Before Income Taxes and Extraordinary Items—This line shows pre-tax income from both operating and
financing/investing activities. It takes into consideration all ordinary income (the plus factors) and ordinary costs
(the minus factors).
Income Taxes—Income taxes are shown as the amount that would be due on income shown for financial accounting
Income Before Extraordinary Items—This line shows after-tax income earned from ongoing operating and financing
activities before taking into consideration gains or losses from unusual, non-recurring items.
Extraordinary Items—There are some years in which companies experience events that can be described as both
unusual and infrequent. The effects of these items are shown separately on a net-of-tax (the dollar amount after
Net Income—This line shows the net after-tax effect once all revenues and all expenses for a period of time are
considered.
Statement of Changes in Shareholders’ Equity—If there have been many complex transactions affecting ownership
13
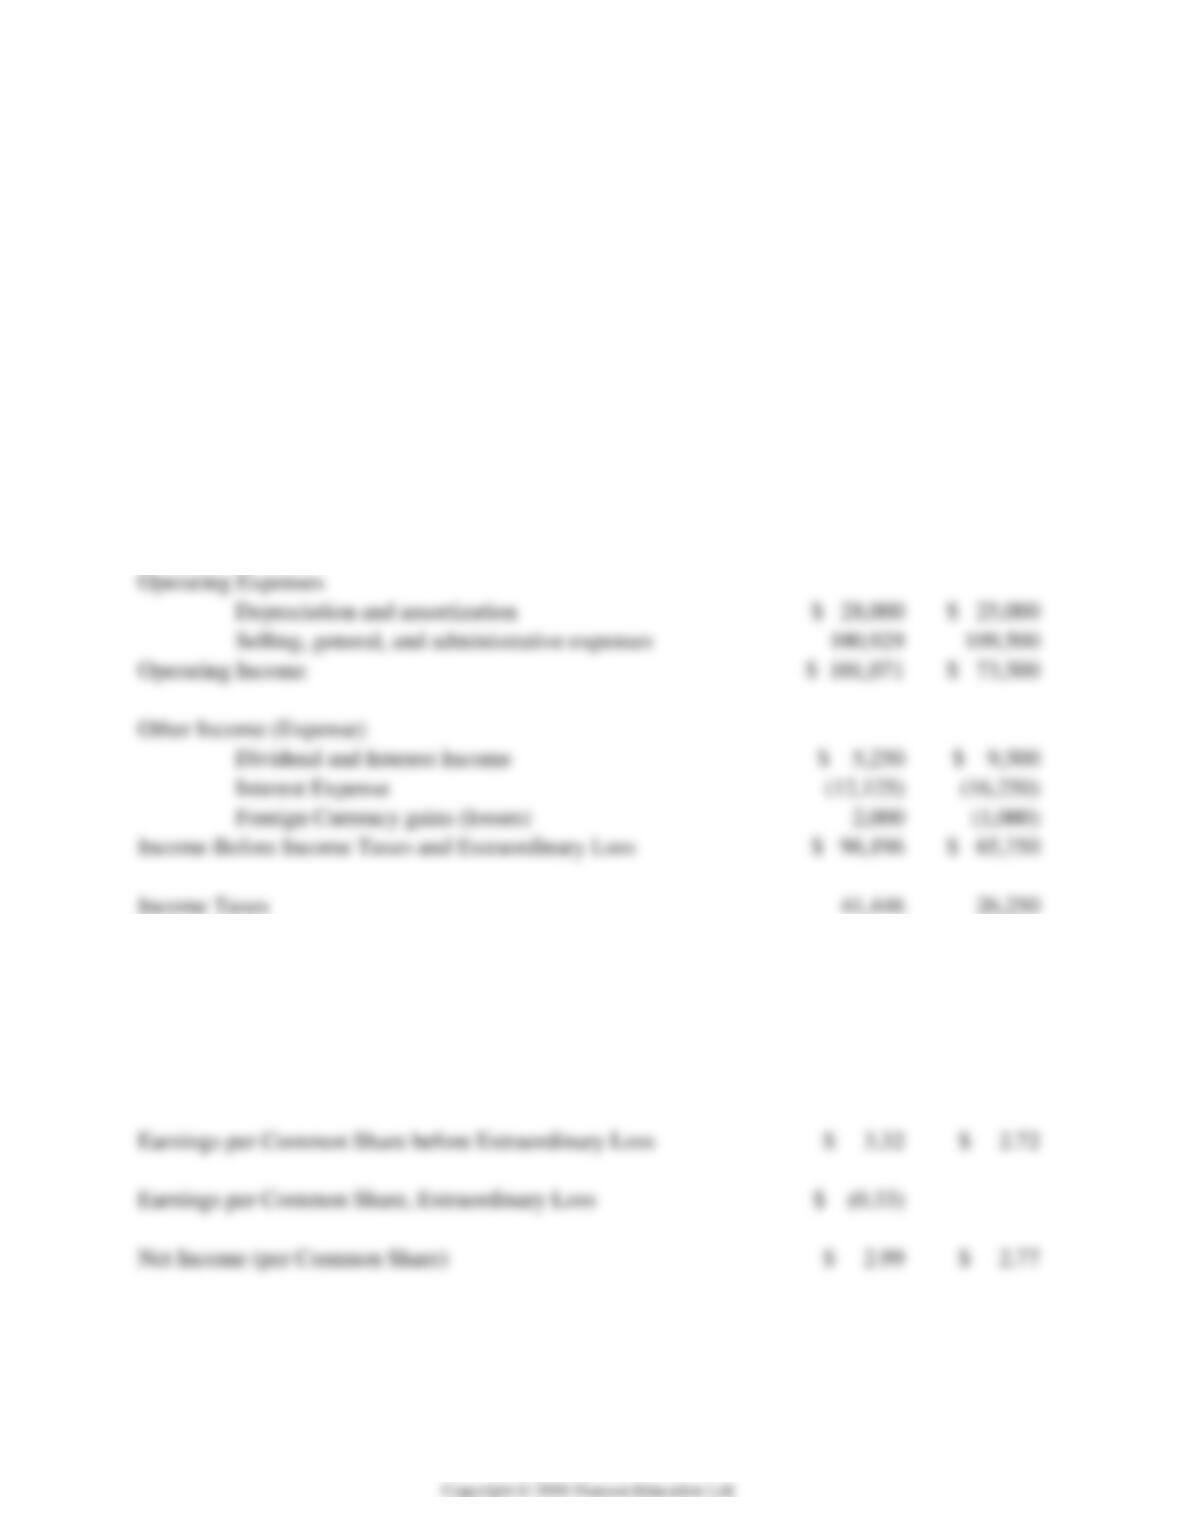
Serendipity
Manufacturing
Company, Inc
CONSOLIDATED INCOME
STATEMENT
2000
1999
Years ended December 31, 2000 and 1999 (in thousands)
Net Sales
$ 765,000
$ 725,000
Cost of Sales
535,000
517,000
Gross Profit
$ 230,000
$ 208,000
Operating Expenses
Depreciation and amortization
$ 28,000
$ 25,000
Selling, general, and administrative expenses
100,929
109,500
Operating Income
$ 101,071
$ 73,500
Other Income (Expense)
Dividend and Interest Income
Interest Expense
Foreign Currency gains (losses)
Income Before Income Taxes and Extraordinary Loss
$ 96,196
$ 65,750
Income Taxes
Income Before Extraordinary Loss
$ 54,750
$ 39,500
Extraordinary Loss (net of tax benefit of $750)
(5,000)
Net Income
$ 49,750
$ 39,500
Earnings per Common Share before Extraordinary Loss
Earnings per Common Share, Extraordinary Loss
Net Income (per Common Share)
14
ANALYZING SERENDIPITY’S INCOME STATEMENT
Gross Profit Margin—Gross margin percentage expresses gross margin as a percentage of sales. Serendipity’s gross
margin was 30.1% of sales in 2000 ($230,000/$765,000), an increase from 28.7% in 1999 ($208,000/$725,000). The
Operating Margin of Profit—Operating margin of profit is computed by dividing operating profit by sales. For
Serendipity, this measure shows that for each dollar of sales, Serendipity earned 13.2 cents in operating profit in
Net Profit Ratio—Net profit divided by sales is another way to evaluate operating performance. For Serendipity, net
profit as a percentage of sales, often referred to as return on sales, grew from 5.45% in 1999 ($39,500/$725,000) to
6.5% in 2000 ($49,750/$765,000).
Asset Turnover Ratio—As noted in the discussion of balance sheet analysis, this ratio shows how many dollars in
sales were generated by each dollar invested in assets. For Serendipity, the asset turnover ratio in 2000 was 1.16/1:
Return on Assets—Return on assets is calculated by dividing net income by total assets. For Serendipity, 2000 ROA
was $49,750/$662,000 or 7.52%. The 1999 ROA was $39,500/$631,600 or 6.25%. Serendipity’s change in ROA
has been positive.
Return on Equity—Return on equity measures the rate of return on the book value of the shareholders’ total
Times Interest Earned—This measure indicates the ability of a company to meet its required interest payments on
15
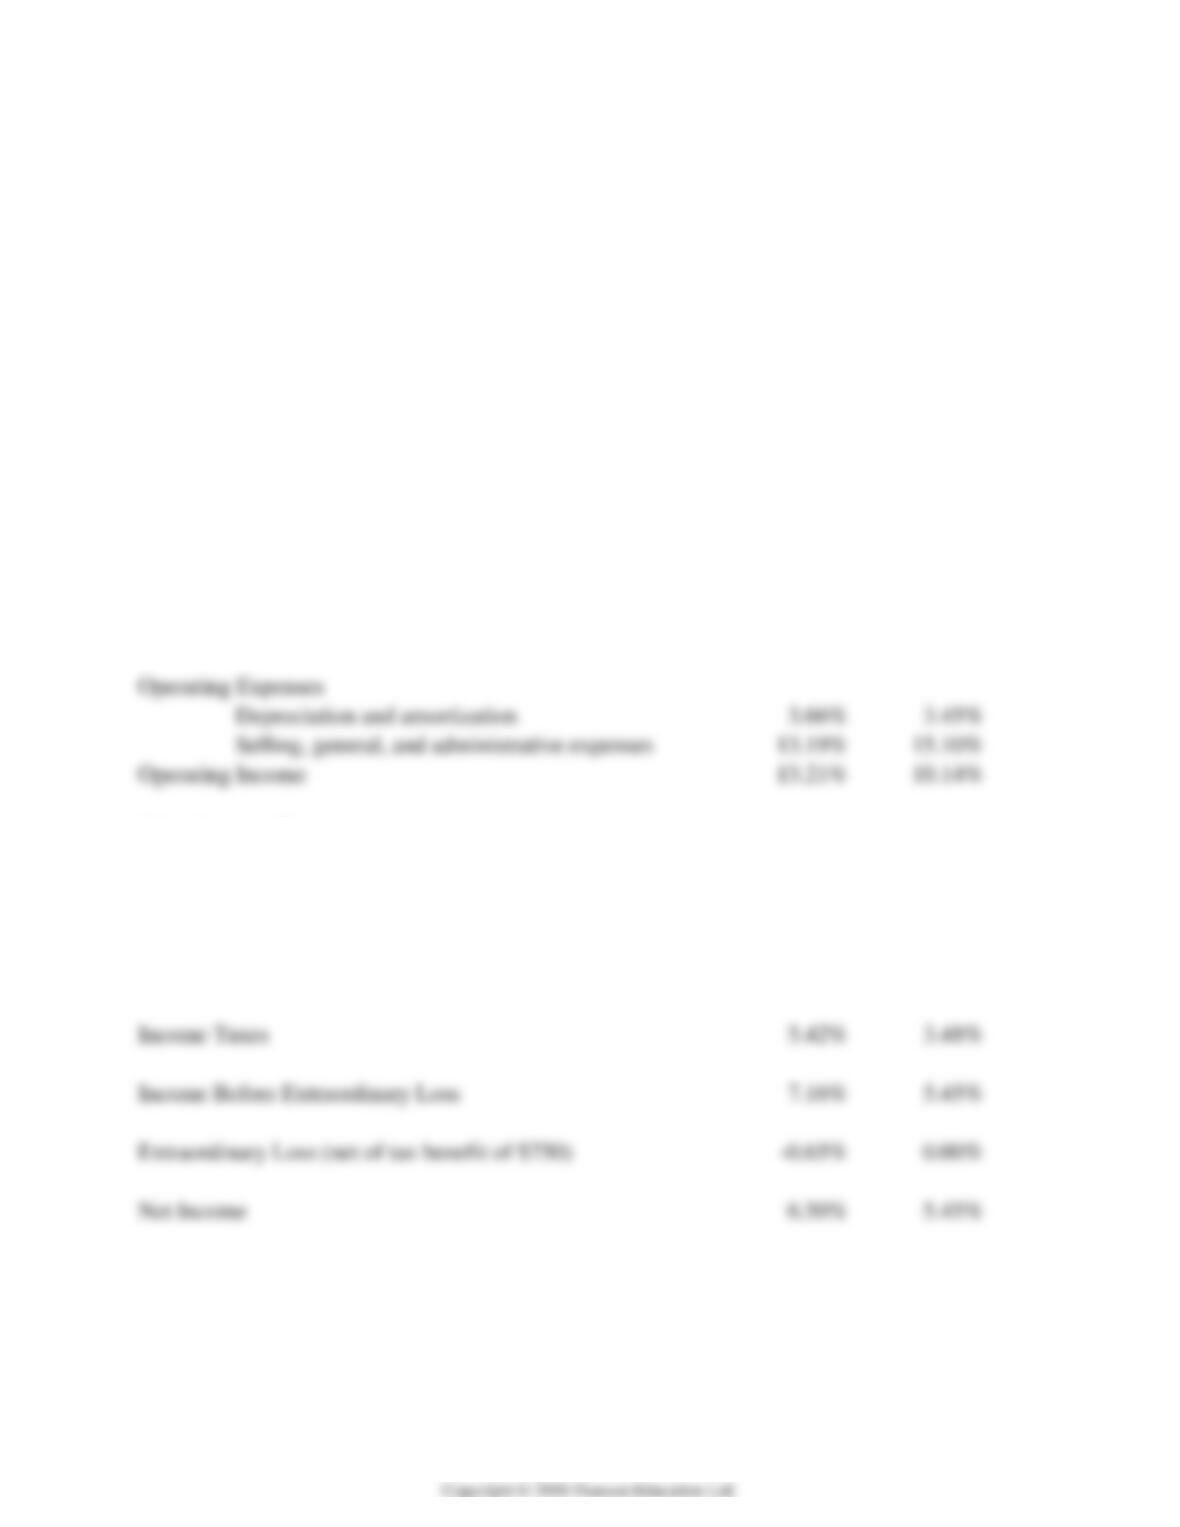
A “common–size” income statement is an important analytical tool. Because a common-size statement expresses
each income statement element as a percentage of sales, it highlights changes and trends in a company’s operating
performance and provides a basis for comparison to industry averages:
Serendipity
Manufacturing
Company, Inc
CONSOLIDATED INCOME
STATEMENT
(Common Size)
Years ended December 31, 2000 and 1999 (in thousands)
Net Sales
100.00%
100.00%
Cost of Sales
69.93%
71.31%
Gross Profit
30.07%
28.69%
Operating Expenses
Depreciation and amortization
3.66%
3.45%
Selling, general, and administrative expenses
Operating Income
13.21%
10.14%
Other Income (Expense)
Dividend and Interest Income
Interest Expense
1.58%
2.24%
Foreign Currency gains
(losses)
0.26%
-0.14%
Income Before Income Taxes and Extraordinary Loss
12.57%
9.07%
Income Taxes
Income Before Extraordinary Loss
7.16%
5.45%
Extraordinary Loss (net of tax benefit of $750)
0.00%
Net Income
16
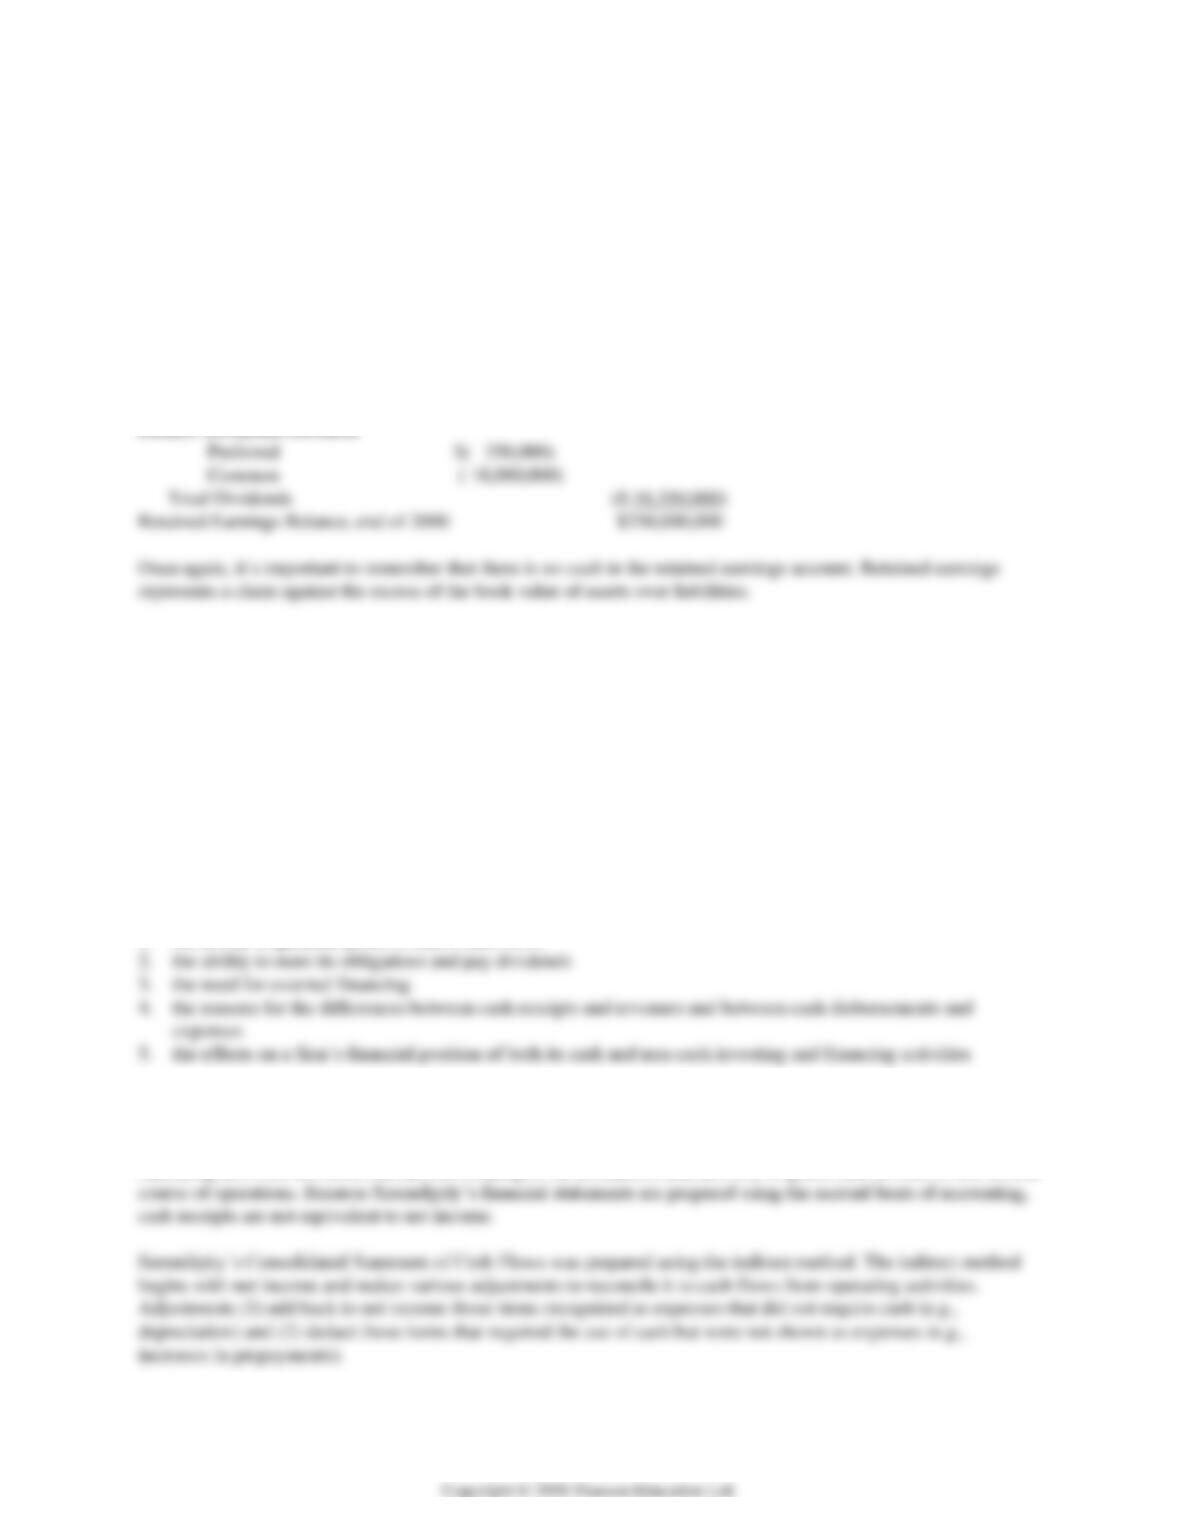
RELATIONSHIP BETWEEN THE INCOME STATEMENT AND THE BALANCE SHEET
The balance sheet is prepared at a point in time; it shows what the company owns (assets) and what the company
owes (liabilities owed to outsiders plus the residual interest owed to owners) at a specific date. Ownership interest is
increased by (1) owners investing additional cash or property or (2) the company earning more revenue than
expenses. Earning an excess of revenue over expenses increases an ownership equity account called retained
earnings. Retained earnings is an historical record of earnings retained in the business. It is increased by earning a
net income and decreased by both losses and declaration of dividends. Using Serendipity as an example, here’s how
it works:
Retained Earnings Balance, end of 1999 $218,600,000
Add: 19X9 Net Income 49,750,000
Because the users of financial statements need more information about a company’s earning power than is provided
by the change in retained earnings shown on the balance sheet, the income statement was developed to show, in
detail, the revenues and expenses that caused the change in retained earnings resulting from operations.
STATEMENT OF CASH FLOWS
Although the balance sheet and the income statement provide the investor with information about a company’s
financial position at a point in time and the results of operations for a period of time, neither statement shows in any
detail the result of investing and financing activities. The statement of cash flows was developed to provide detailed
information about the impact on cash of the operating activities of a company (summarized in the income statement)
as well as its investing and financing activities. Specifically, the statement is intended to help financial statement
readers assess:
1. the ability to generate positive future cash flows
Cash flows are separated by business activity. The three business activities shown on the statement are operating
activities, investing activities, and financing activities.
Operating activities are those transactions relating to the production and delivery of goods and services in the normal
17
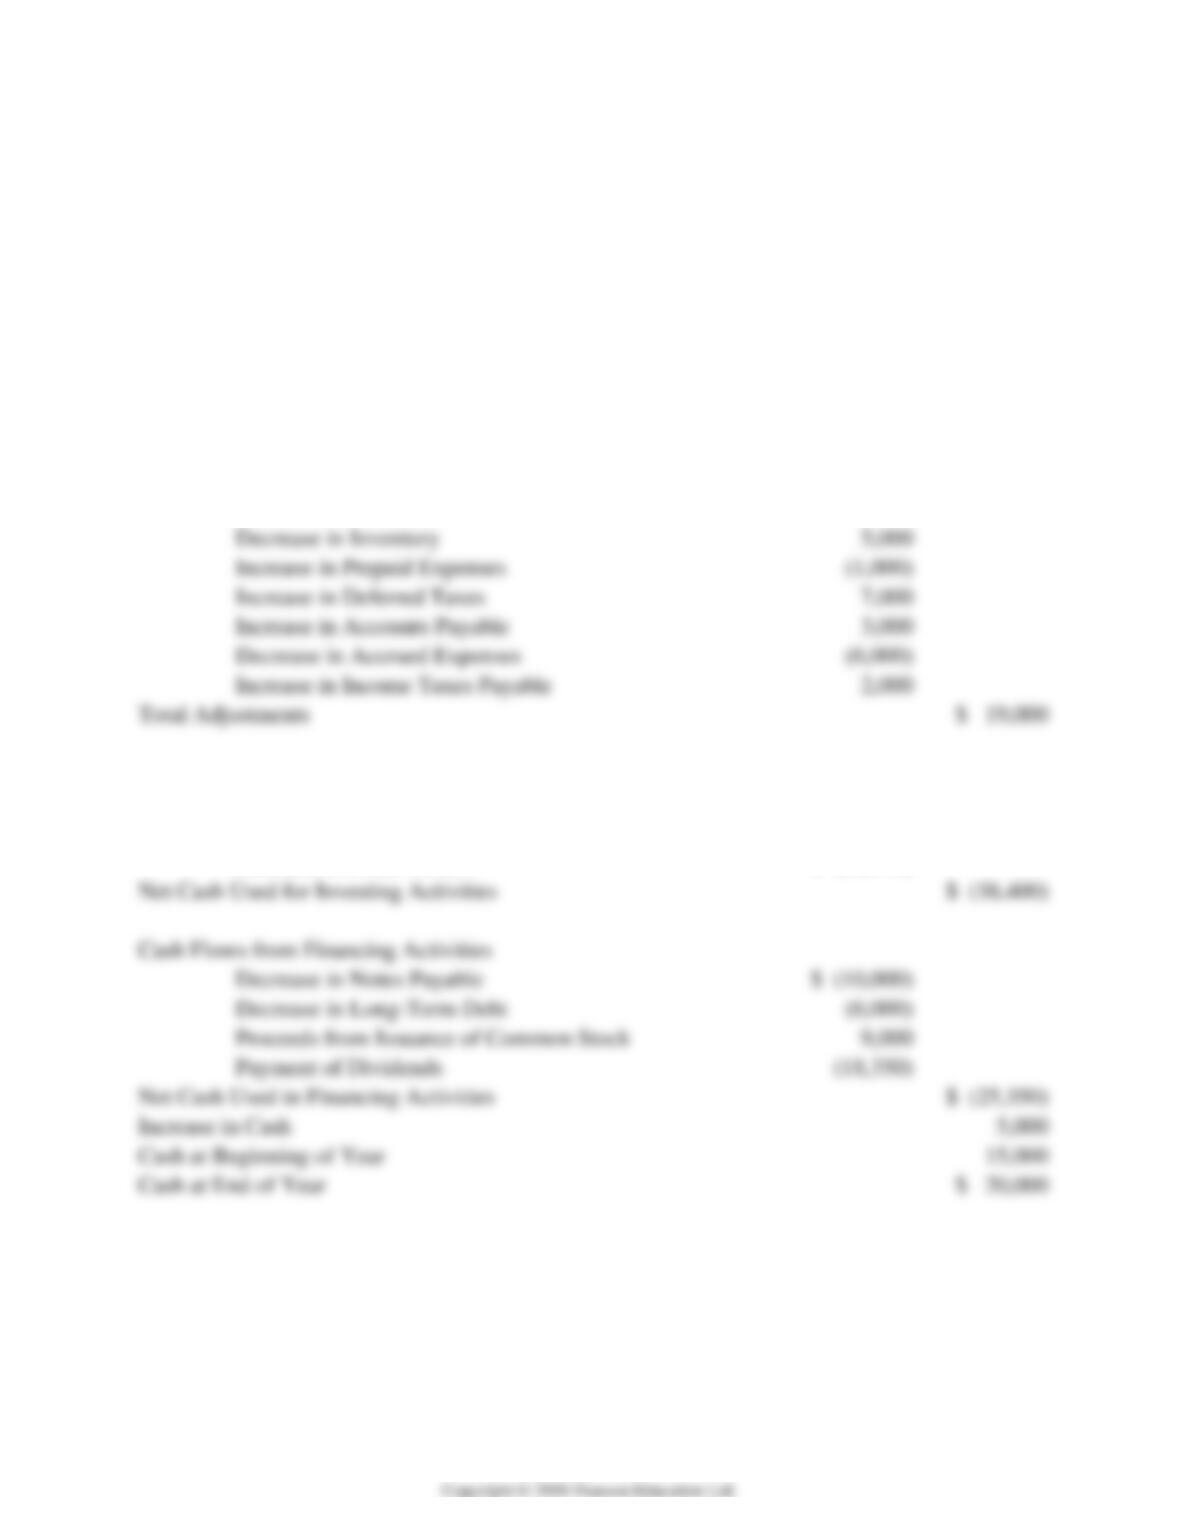
Serendipity Manufacturing Company, Inc.
CONSOLIDATED STATEMENT OF CASH
FLOWS
Year ended December 31, 2000 (in thousands)
Cash Flows from Operating Activities
Net Income
$ 49,750
Adjustments to Reconcile Net Income to Net Cash
from Operating Activities
Depreciation and Amortization
$ 28,000
Increase in Marketable Securities
(8,000)
Increase in Accounts Receivable
(11,000)
Decrease in Inventory
Increase in Prepaid Expenses
Increase in Deferred Taxes
Increase in Accounts Payable
Decrease in Accrued Expenses
(6,000)
Increase in Income Taxes Payable
Total Adjustments
$ 19,000
Net Cash Provided by Operations
$ 68,750
Cash Flows from Investing Activities
Purchase of Fixed Assets
$ (38,400)
Net Cash Used for Investing Activities
$ (38,400)
Cash Flows from Financing Activities
Decrease in Notes Payable
$ (10,000)
Decrease in Long-Term Debt
(6,000)
Proceeds from Issuance of Common Stock
Payment of Dividends
(18,350)
Net Cash Used in Financing Activities
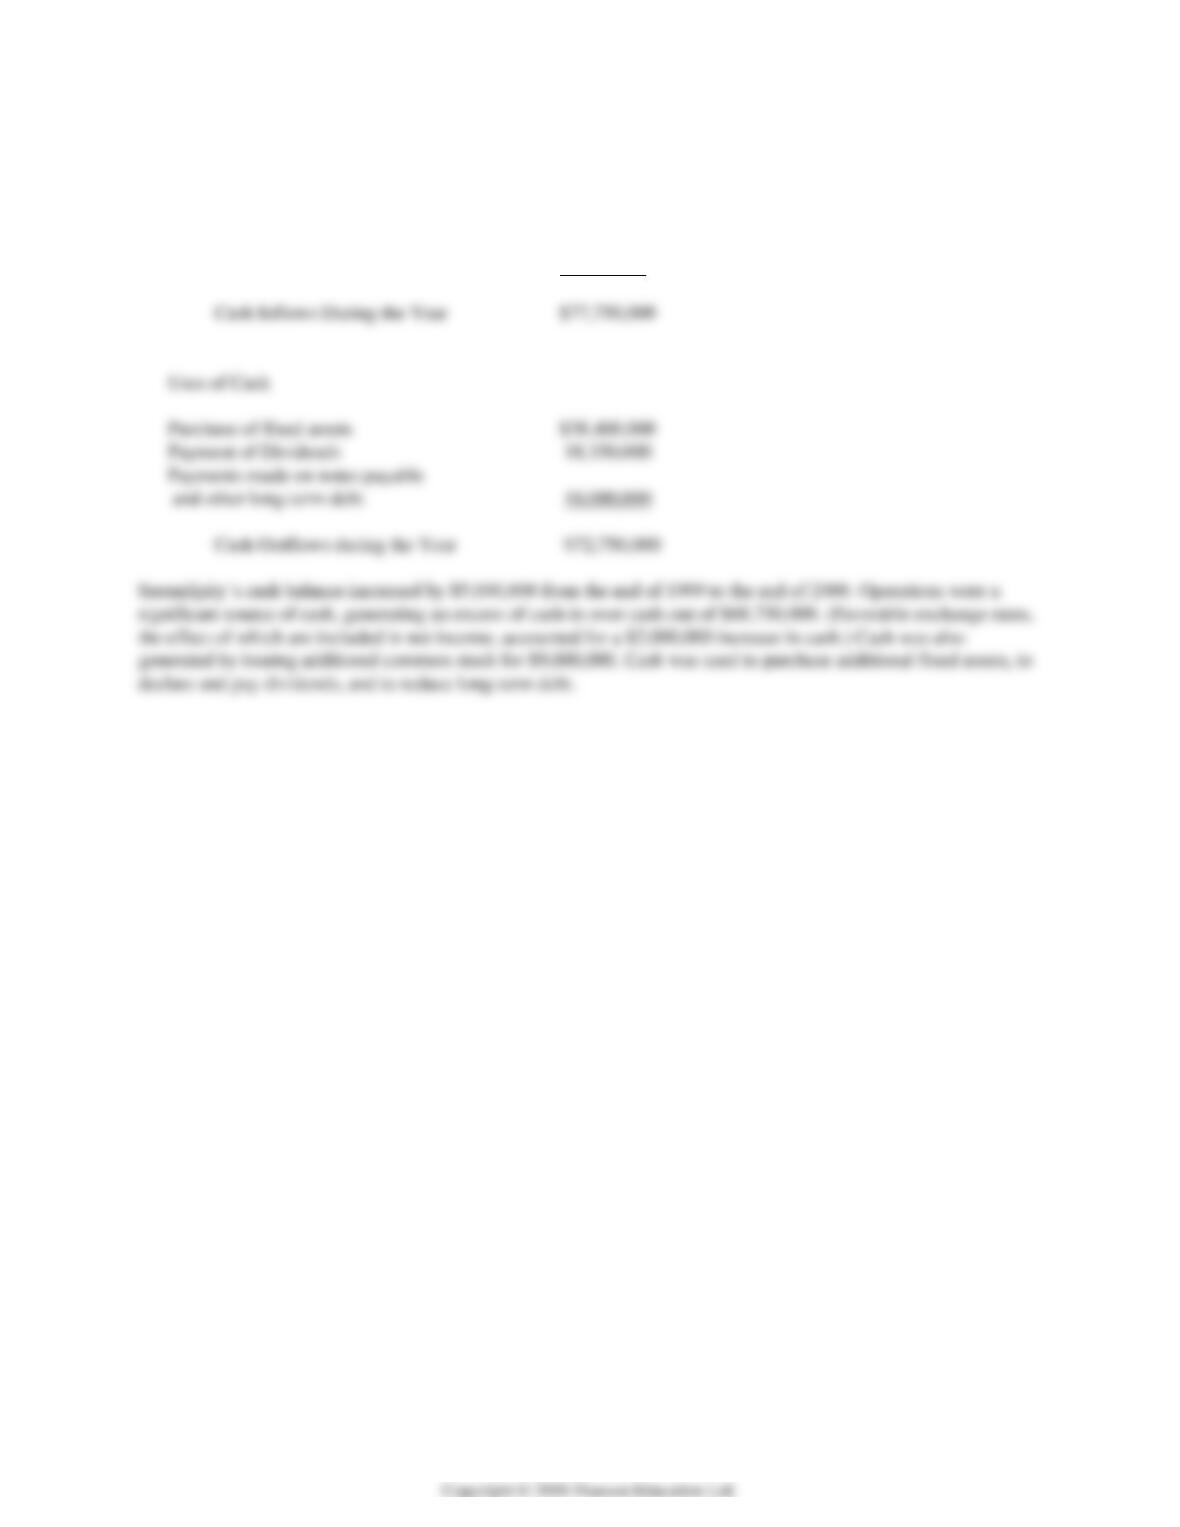
Increase in Cash
Cash at Beginning of Year
Cash at End of Year
$ 20,000
18
Here’s how we might interpret Serendipity’s cash flow statement:
Sources of Cash:
Operations $68,750,000
Issuance of common stock 9,000,000
THE STRATEGY WIZARD
There is an interesting computer program called Strategy Wizard that was written to go with this Wheelen and
Hunger textbook. It is a short (32 kb) executable file that students can download from
www.pearsonhighered.com/wheelen for use with this book. Deena Malkina created the program while she was an
undergraduate student at the University of Colorado, Boulder in July 2001. She wrote the program as part of a
strategy class (BCOR 4000) taught by Leon Schjoedt. She used it in a class presentation to illustrate how
How to Obtain the Strategy Wizard
Using your Internet browser, go to the Pearson website for this textbook. The URL is
How to Use the Strategy Wizard
Select a case for the students to analyze. The case should be a typical comprehensive strategic management case.
Tell your students to download the Strategy Wizard file from www.pearsonhighered.com/wheelen. It is probably
contained in a zip file that needs to be unzipped before it can be used. This is because most servers and virus
protection programs refuse to allow an executable file (a program with .exe as a suffix) to be downloaded onto a
personal computer.
Once the student clicks on the file StrategyWizard.exe, it will open to the first of two pages. The first page lists the
following:
Current Situation
Performance: 3 choices (Weak, Solid, Strong)
Strategic Posture: 3 choices (Weak, Solid, Strong)
20
The second page of the Strategy Wizard lists the following:
SWOT
Strengths: 6 items (Strategy/Management, Cost Leadership, Size/Market Share, Differentiation,
Resources, and Flexibility). Click on the appropriate strengths for the case.
Weaknesses: 6 items (the same items as under Strengths). Click on the appropriate weaknesses.
Once the student completes this page, he/she should click on the Submit! button at the bottom/left of the page. The
program will automatically select what it thinks is the most appropriate corporate strategy for a case. For example, it
Teaching Suggestions
Ask the students to staple pages one and two together, print their name on it, and bring the completed printout to
class.
Begin the class as you usually do. Start the discussion of the assigned case by asking students to describe the
company in the case and the problems or issues that it is facing. Then ask how each person in the class marked the
Performance category on the Strategy Wizard. See if everyone agrees. Ask them to defend their position. Go through
the rest of the Strategy Wizard categories and use it to discuss each student’s analysis of the case. Which categories