Extended Learning Module D (Web Version, Office 2007) – Decision Analysis with Spreadsheet Software
Mod D Web–12
• These five slides provide the screen captures for completing the steps
to add information to a 2D pivot table.
• These five slides provide the screen captures for completing the steps
to add information to a 2D pivot table.
• These five slides provide the screen captures for completing the steps
• These five slides provide the screen captures for completing the steps
to add information to a 2D pivot table.
• These five slides provide the screen captures for completing the steps
to add information to a 2D pivot table.
Extended Learning Module D (Web Version, Office 2007) – Decision Analysis with Spreadsheet Software
Mod D Web–13
• This slide sets up an example of having multiple pieces of information
in the body of a 2D pivot table.
• This slide presents the screen capture in Figure D.13 on page D.15.
• This slide sets up an example of creating a 3D pivot table.
• These final two slides present the steps for creating a 3D pivot table.
• This slide shows how to view information by the third (page)

Extended Learning Module D (Web Version, Office 2007) – Decision Analysis with Spreadsheet Software
Mod D Web–14
• This final slide provides a summary of the decision support features
Back to Jump List

Extended Learning Module D (Web Version, Office 2007) – Decision Analysis with Spreadsheet Software
Mod D Web–15
SHORT-ANSWER QUESTIONS
Back to Jump List
Extended Learning Module D (Web Version, Office 2007) – Decision Analysis with Spreadsheet Software
Mod D Web–16
ASSIGNMENTS & EXERCISES (p. D.19)
1. WHAT PRODUCTION PROBLEMS DO YOU HAVE? Throughout this module, you’ve been
practicing some spreadsheet features using XLMD_Production.xls. It seems you have some
real problems. There are an unacceptable number of defective products being produced.
Your task is to use some combination of Filter, conditional formatting, and pivot tables to
illustrate where the problems seem to be concentrated, perhaps by product, by employee,
by machine, or even by batch size. Based on your analysis, recommend how to correct the
problems.
DISCUSSION
• This assignment has no real “right” or “wrong” answers.
• The point of the assignment is two-fold.
2. EVALUATING TOTAL PURCHASES AND ANNUAL INCOME Using XLMD_Customer.xls,
create a pivot table that illustrates the relationship between TOTAL PURCHASES and
ANNUAL INCOME. What trends do you see in the information? Suppose your task is to
concentrate marketing efforts and resources. On which annual income level would you
concentrate? Why? If you were a marketing manager, what additional information would
be helpful as you make your decision? Where would you be able to obtain such
information?
DISCUSSION
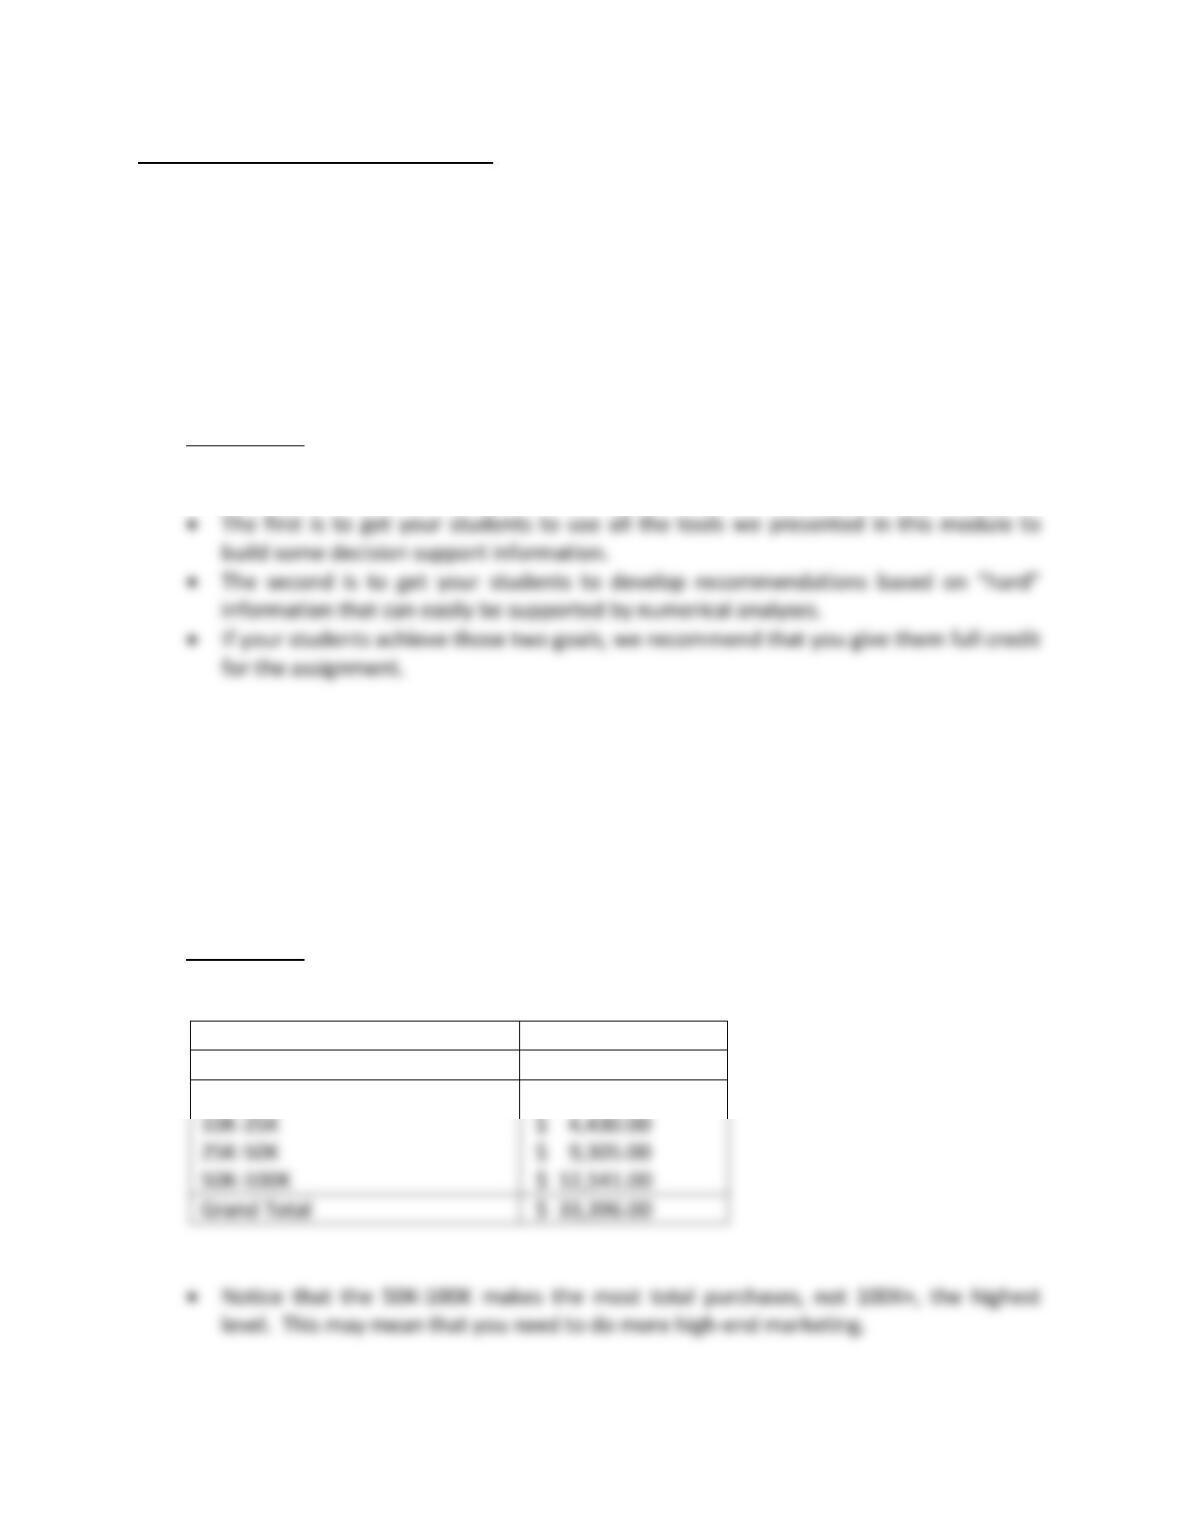
• Below you can see the pivot table illustrating the relationship.
Sum of TOTAL PURCHASES
ANNUAL INCOME
Total
100K+
$ 7,120.00
$ 4,430.00
$ 9,305.00
$ 12,541.00
Grand Total
$ 33,396.00
Mod D Web–17
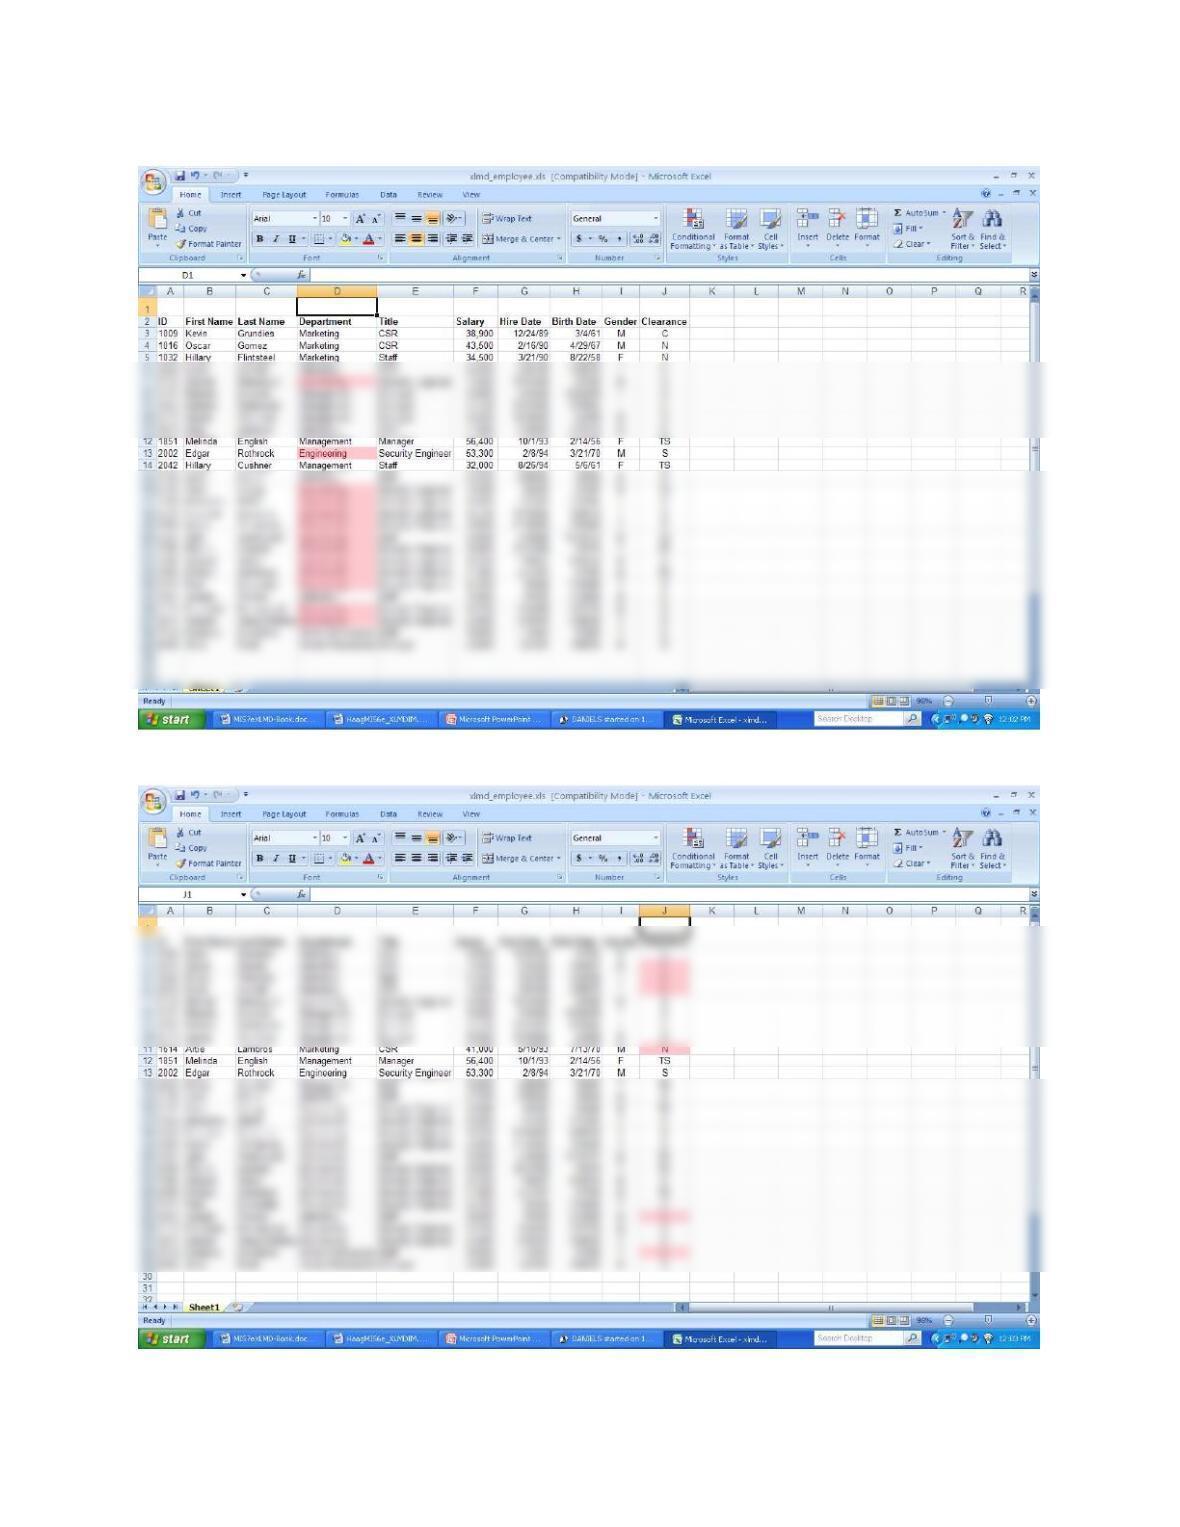
3. FINDING OUR INFORMATION ABOUT YOUR EMPLOYEES Suppose you own a small
business and have a workbook of information on your employees including ID, First Name,
Last Name, Department, Title, Salary, Hire Date, Birth Date, Gender, and Clearance (for
security purposes). This file is XLMD_Employee.xls and is on the Web site at
www.mhhe.com/haag. You are to use the features in this module to build various decision
support information.
DISCUSSION
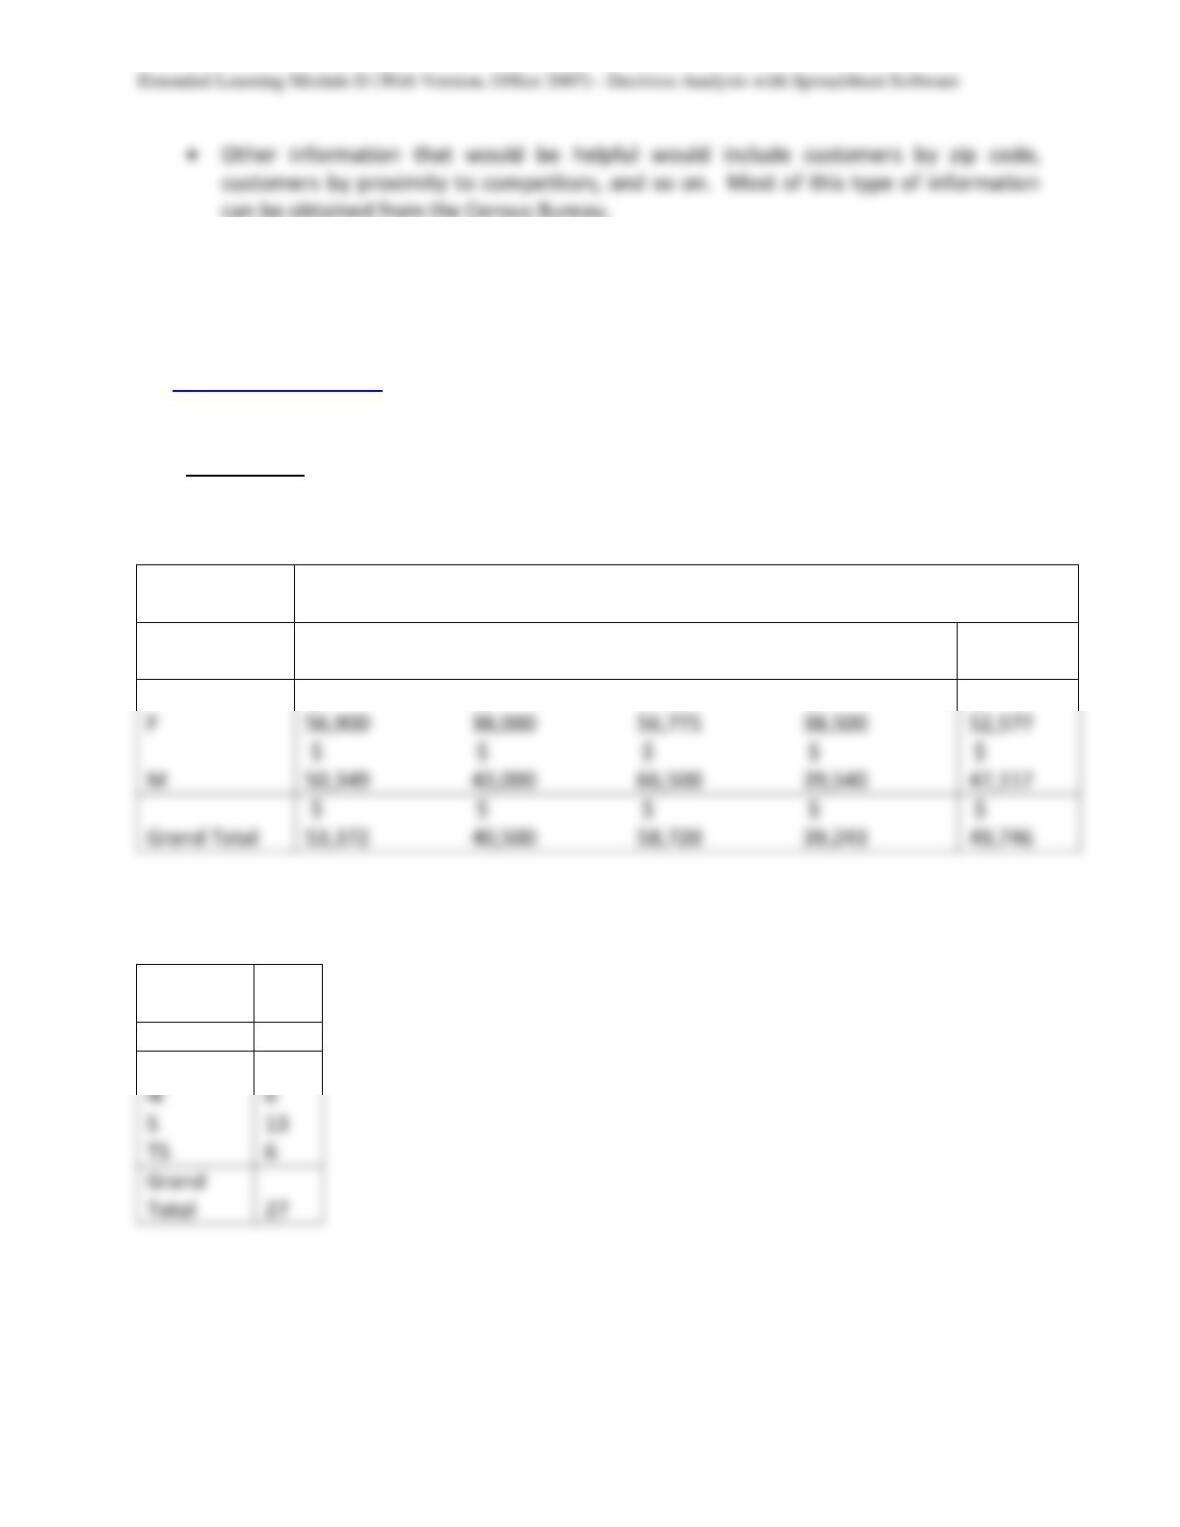
• Below are the screen captures for the 6 tasks your students are required to complete.
Pivot table – average salary by gender within department
Average of
Salary
Department
Gender
Engineering
Human
Resources
Management
Marketing
Grand
Total
F
M
$
$
$
$
$
Grand Total
$
$
$
$
$
$
$
$
$
$
Pivot table – number of employees by clearance
Count of
ID
Clearance
Total
C
2
N
6
S
6
Grand
Total
Extended Learning Module D (Web Version, Office 2007) – Decision Analysis with Spreadsheet Software
Mod D Web–18
Conditional formatting – employees in the Engineering department
Conditional formatting – employees who have no clearance
Extended Learning Module D (Web Version, Office 2007) – Decision Analysis with Spreadsheet Software
Mod D Web–19
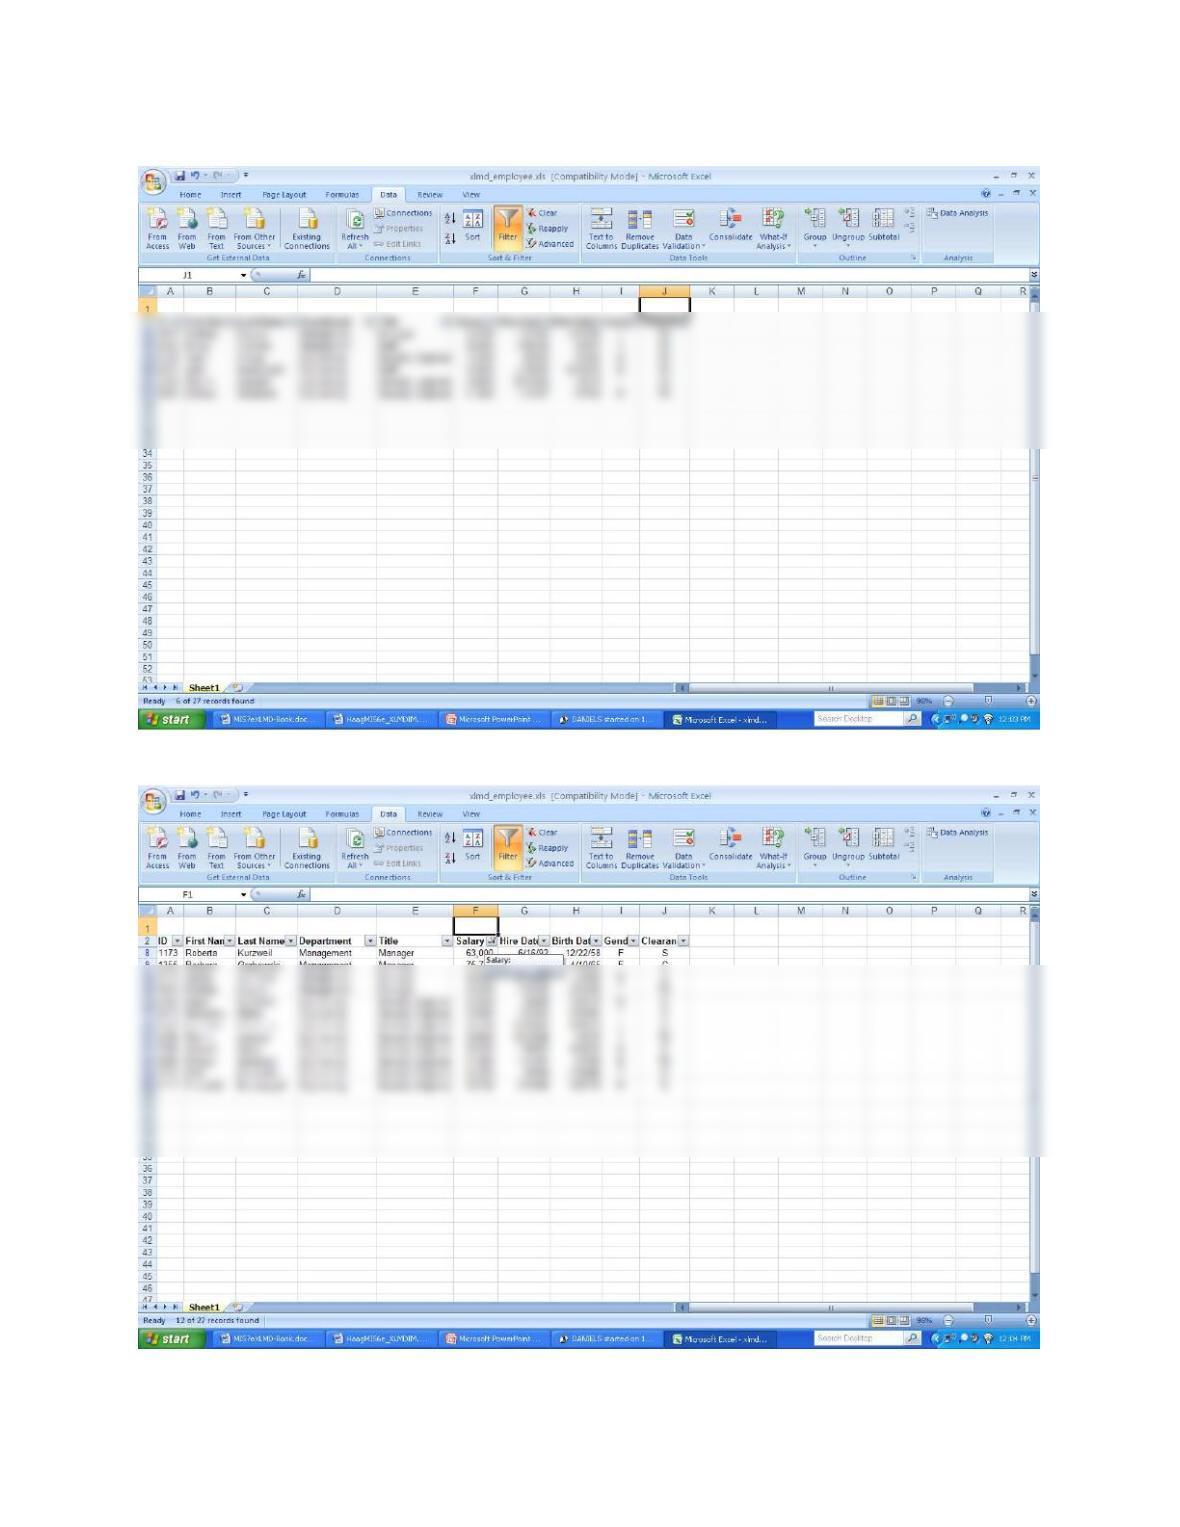
Basic Filter – employees who have top secret clearance
Custom Filter – employees who earn more than $50,000
Mod D Web–20
4. EXPLORING INFORMATION AT B&B TRAVEL Benjamin Travis and Brady Austin are co-
owners of B&B Travel Consultants, a medium-size business in Seattle with several branch
offices. B&B specializes in selling cruise packages. Ben and Brady maintain a workbook that
contains information for each cruise package sale including Location #, Travel Agent #,
Cruise Line, Total Package Price, and Commission. You can find this workbook
(XLMD_Travel.xls) on the Web site at www.mhhe.com/haag. Using the decision support
features in this module, you are to make some recommendations to B&B regarding (1)
which location should be closed, (2) which travel consultants should be downsized, and (3)
on which cruise lines B&B should focus its efforts.
DISCUSSION
• Like the first assignment, the focus of this project is to get your students to use the
5. CREATE A LIST FOR A BOOKSTORE Suppose that you’re the manager for your school’s
bookstore. Your task is to create a list in a workbook that contains information about the
textbooks it sells. In addition to tracking price, first author name, and publisher, identify
five other pieces of information for each textbook. Then build a fictitious list and illustrate
the use of the decision support features presented in this module.
DISCUSSION
Back to Jump List
Extended Learning Module D (Web Version, Office 2007) – Decision Analysis with Spreadsheet Software
Mod D Web–21
ADDITIONAL ASSIGNMENTS AND EXERCISES
LISTS, LIST DEFINITION TABLES, AND USING BASIC FILTER
Note: Use this in the section on Basic Filter
First, create the list definition for it.
Now, perform the following Basic Filter exercises:
2. Show only those customers whose type of business is nonprofit.
USING CUSTOM FILTERS
Note: Use this in the section on Custom Filter
XLMD_Customer2.xls. Now perform the following Custom Filter exercises:
2. Show only those customers who have fewer than 100 employees.
4. Show only those customers in Tennessee who have fewer than 10 employees.
CONDITIONAL FORMATTING
Note: Use this in the section on Conditional Formatting
Go to the Web site that supports this text (www.mhhe.com/haag), select XLM/D, and download
the file called XLMD_Production.xls. Highlight the following by applying conditional
formatting:
1. All batches made by Employee 1111.
3. All batches for which the batch size is greater than 1,000.
4. All batches for Product 10.

Extended Learning Module D (Web Version, Office 2007) – Decision Analysis with Spreadsheet Software
Mod D Web–22
CREATING A TWO-DIMENSIONAL PIVOT TABLE
Note: Use this in the section on pivot tables
Go to the Web site that supports this text (www.mhhe.com/haag), select XLM/D, and download
the file called XLMD_Production.xls. Create separate pivot tables that show:
2. The number of defective products produced by employee by product
Back to Jump List