
Projects – Group Projects: Electronic Commerce Projects
GP – 1
PROJECTS
GROUP PROJECTS:
ELECTRONIC COMMERCE PROJECTS
CONTACT INFORMATION: Stephen Haag is the primary author of all the group projects. If you
GROUP PROJECTS OVERVIEW: You can find the Group Projects on pages 286–309. In all, there
are 22 Group Projects; each applies to one or more chapters or appendices, but you can certainly

GP – 2
CASE 1: ASSESSING THE VALUE OF CUSTOMER RELATIONSHIP MANAGEMENT
Trevor Toy Auto Mechanics
Page 286
THE ISSUE
Trevor Toy Auto Mechanics has grown substantially over the past few years. Based on various
pieces of information, students are asked to help Trevor improve service and add a level of
AVAILABLE INFORMATION
Repair information on cars, mechanics, type of repair, hours worked, number of hours to complete
work, cost of parts, total amount charged.
• CUSTOMER # – A unique number assigned to each customer
• CUSTOMER NAME – the name of the customer
A PRE-ANALYSIS OF THE INFORMATION
• Considering the type of analysis to be performed, all the information is important.
• There are several other important pieces of information that your students will need to derive
IMPORTANT NOTE: If your students are wondering why Trevor Toy employs 21 employees but
only 6 mechanics, alert them to the fact that Trevor has a paint-and-body shop and an industrial
repair division. The information your students are working with deals with only the car repair
portion of Trevor’s business.
THE ANALYSIS
Your students will need to look carefully at the information and determine what other information
Projects – Group Projects: Electronic Commerce Projects
GP – 3
BY CUSTOMER
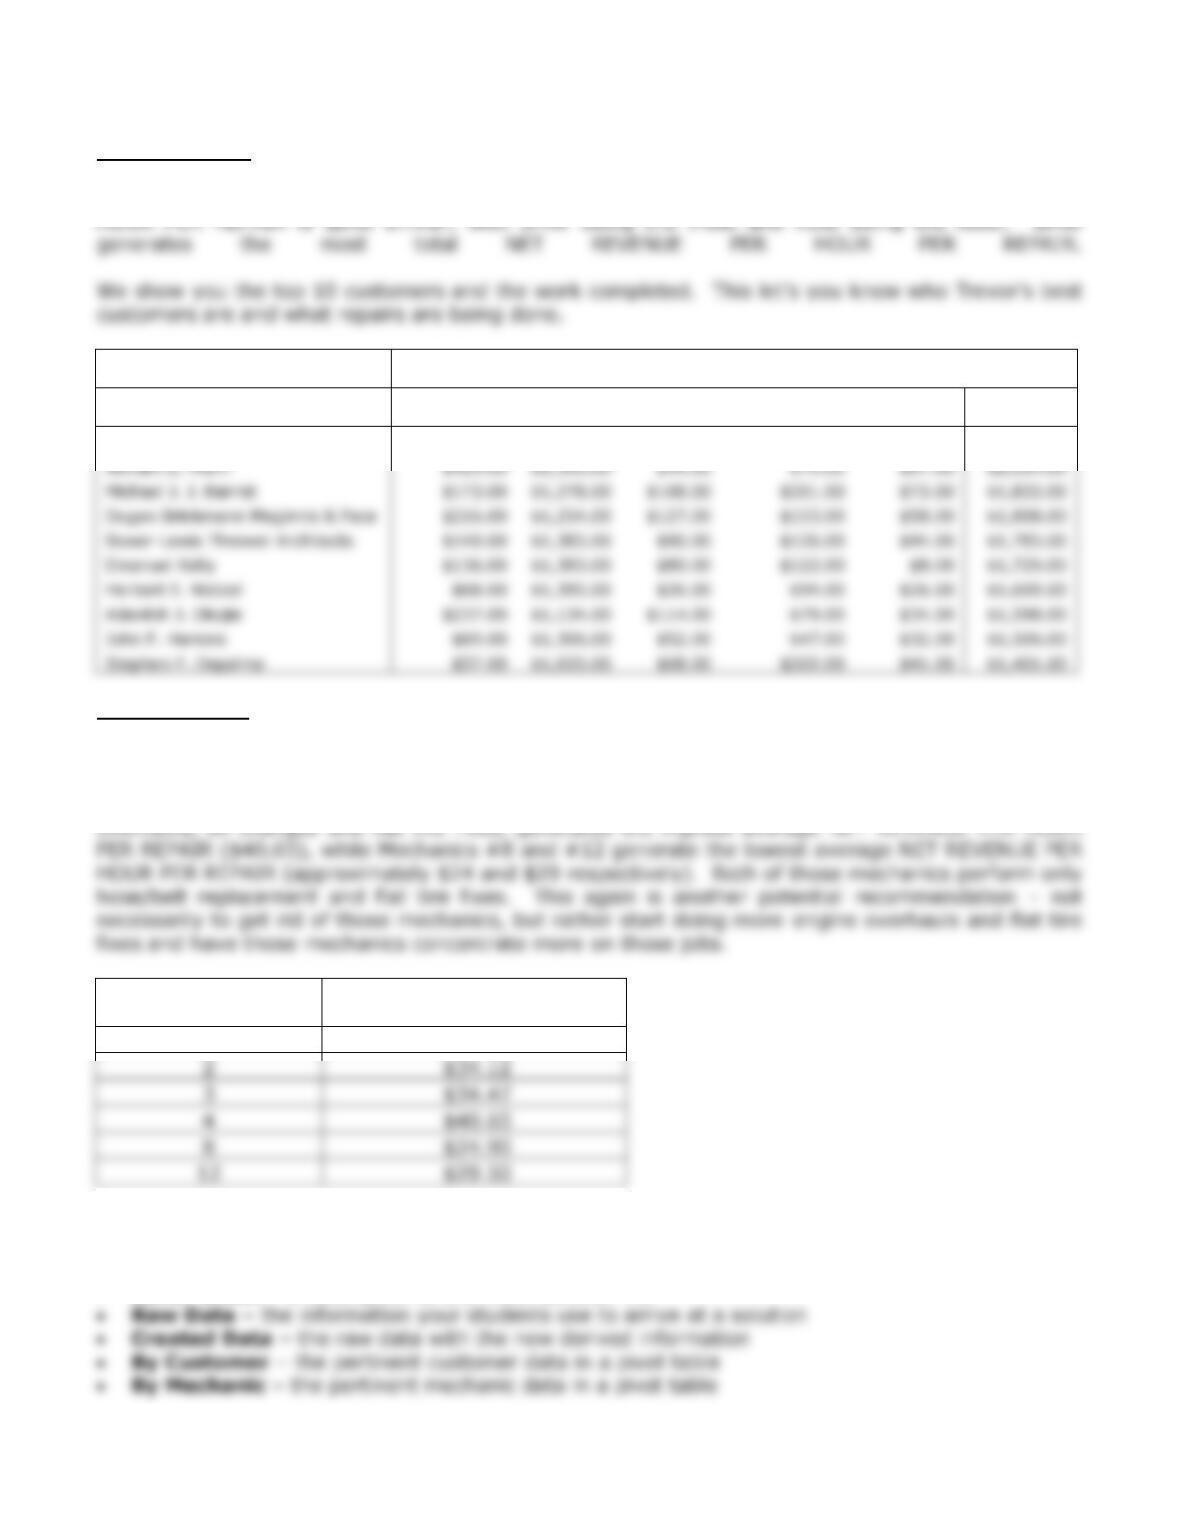
From a worksheet titled “By Customer” in the TREVOR SOLUTION.xls file, we have summarized
the information below for Average Repair By Customer. By car, the average NET REVENUE PER
Sum of Customer Repairs
WORK
COMPLETED
CUSTOMER NAME
Brakes
Engine
Overhaul
Flat tire
fix
Hose/Belt
Replacement
Oil
change
Grand
Total
David P. Montgomery
$665.00
$1,435.00
$216.00
$135.00
$129.00
$2,580.00
Michael J. J. Barrist
$173.00
$1,278.00
$108.00
$201.00
$1,833.00
Dugan Brinkmann Maginnis & Pace
$216.00
$1,254.00
$127.00
$153.00
$1,808.00
Bower Lewis Thrower Architects
$140.00
$1,383.00
$90.00
$126.00
$1,783.00
Emanuel Kelly
$136.00
$1,383.00
$80.00
$122.00
$1,729.00
Herbert E. Wetzel
$1,395.00
$26.00
$1,609.00
Adanfoh J. Okojie
$237.00
$1,134.00
$114.00
$1,598.00
John F. Harkins
$1,306.00
$52.00
$1,506.00
Stephen P. Depalma
$1,033.00
$68.00
$202.00
$1,401.00
BY MECHANIC
From a worksheet titled “By Mechanic” in the TREVOR SOLUTION.xls file, we have summarized
the information below for average NET REVENUE PER HOUR PER REPAIR.
As you can see, these numbers are much different. Mechanic #4, who primarily does engine
MECHANIC
Average NET REVENUE
PER HOUR PER REPAIR
1
$38.94
$29.50
The TREVOR SOLUTION Excel file demonstrates how we performed our analysis. In the Excel
solution file, you will find five worksheets:
• Cover Sheet – a description of the Excel solution file

Projects – Group Projects: Electronic Commerce Projects
GP – 4
One more important thing you should stress to your students – spreadsheet software has powerful

CASE 2: ASSESSING THE VALUE OF INFORMATION
Affordable Homes Real Estate
Pages 287
THE ISSUE
There are 6 different housing development projects currently developing 100 new homes each. As a
partner in small real estate firm, your students must decide in which project to concentrate sales
efforts.
AVAILABLE INFORMATION
Home sales transactions for each of the 6 housing development projects (100 homes each) in phase
1.
• LOT # – the number assigned to a specific home within each project
• PROJECT # – a unique number assigned to each of the six housing development projects
A PRE-ANALYSIS OF THE INFORMATION
• The number assigned to a specific home within each project is used only to identify each home.
It is not important in the analysis.
• Square footage, number of bedrooms and number of bathrooms – while all interesting pieces of
information and vitally important to the selling process itself – are not important when deciding
in which project to focus sales efforts. Your students can perform a regression analysis to
determine this.
• There are three important pieces of information that must be derived in order to make the
correct decision:
1. COMMISSION = the SELL PRICE multiplied by whatever factor is assumed (around 7% in

Projects – Group Projects: Electronic Commerce Projects
GP – 6
THE ANALYSIS
This project looks deceivingly simple. In reality, your students may need to do some exploring in
the real estate environment. By interviewing a few real estate agents, your students will soon learn
that real estate agents make the most money by minimizing the time it takes to a sell a home will
maximizing the commission.
23
47
61
78
92
97
AVERAGE ASK PRICE
$83,917
$82,844
$83,520
$82,898
$84,710
$88,102
AVERAGE DAYS TO SALE
The REALEST SOLUTION Excel file demonstrates how we arrived at the above solution. In the
Excel solution file, you will find five worksheets. They are:
• Cover Sheet – a description of the Excel solution file
To create the Pivot Table worksheet, we did use the pivot table feature. You should definitely

GP – 7
CASE 3: EXECUTIVE INFORMATION SYSTEM REPORTING
Political Campaign Finance Consultants
Pages 288
THE ISSUE
The city of Highlands Ranch, Colorado wishes to organize its campaign contribution records. The city
council is considering various executive information system packages that can show them overall
THE TECHNOLOGY
Spreadsheet software and a spreadsheet file, CONTRIBUTE.xls that contains 7 columns and 606
rows of contribution transactions.
AVAILABLE INFORMATION
Campaign contributions over an eight-month period of time.
• DATE – the actual date that the contribution was made
• CONTRIBUTOR – the name of the person or organization that made the contribution
A PRE-ANALYSIS OF THE INFORMATION
All of the information is important in preparing the reports that illustrate the concept of drilling
down.
THE ANALYSIS
This particular project has no absolute correct answer. Your students should be able to demonstrate
the “drilling down” concept from many different points of view. Numerous possibilities exist for
developing an overall report (or view) that contains within it several examples of drilling down. We
describe one such possibility on the next page.
The first report would show “Total Contributions By District.” Within each district, the next report
would provide the break down of “Total Contribution By Type.” Within each type, the next report

GP – 8
The CONTRIBUTE SOLUTION Excel file demonstrates how we illustrated the concept of drilling
down using the example given at the top of this page. In the Excel solution file, you will find six
worksheets. They are:
• Cover Sheet – a description of the Excel solution file

GP – 9
CASE 4: BUILDING VALUE CHAINS
StarLight’s Customers Define Value
Pages 289
THE ISSUE
StarLight’s VP for Business Information and Planning is in search of information to improve
StarLight’s customer service by examining what customers believe adds value to customer service
THE TECHNOLOGY
DBMS software and a database, STARLIGHT.mdb, which contains 14 fields of information and 246
survey responses.
AVAILABLE INFORMATION
Survey results from the last few months (246 total surveys):
• SURVEY ID – an internally generated survey ID number
• VA_VR – whether this survey reflects value-added or value-reducing figures
• DATE – the date of the survey
• MAF&L – the value attributed management, accounting, finance, and legal processes
• HRM – the value attributed human resource management processes
A PRE-ANALYSIS OF THE INFORMATION
• The objective of this case is to prioritize IT systems development and improvement of existing
processes (i.e., either the process that adds value or the process that reduces value the most).
The value-added takes advantage of areas most favorably viewed by customers and therefore
the most visible. The Value-Reduced are processes that may well be causing us to lose
customers.
• The VA_VR (Value-Added/Value-Reducing) field in the database table is a logical data type field.
So, Access stores a -1 for Value-Added and 0 for Value-Reducing. When displaying table data, a
THE ANALYSIS
Averaging the individual attributes as VA and VR gives us the results below. The value chains for
these solutions are provided on this and the next page.

Projects – Group Projects: Electronic Commerce Projects
GP – 10
MAF&L
HRM
R&T
PUR
R&G
ADV
LOC
DISP
SAL
MARK
FOLW
VA
7.14
2.91
10.12
10.41
7.87
25.05
8.32
5.49
13.80
5.61
3.29
VR
5.05
6.82
5.22
7.99
12.33
4.97
4.98
26.25
8.23
10.92
7.24
The STARLIGHT SOLUTION Access and Excel files demonstrate how we arrived at our solution.
The Access file includes queries that interrogate the survey results and creates separate tables.
These tables are then exported to the Excel solution file as worksheets and used to formulate the
Management, Accounting, Finance, Legal (7.14%)
Human Resource Management (2.91%)
Research and Technical Support (10.12%)
Purchasing (10.41%)
Value
Added

Projects – Group Projects: Electronic Commerce Projects
Management, Accounting, Finance, Legal (5.05%)
Purchasing (7.99%)
Reducing
GP – 12
CASE 5: USING RELATIONAL TECHNOLOGY TO TRACK PROJECTS
Foothills Construction
Pages 291
THE ISSUE
The Foothills Construction Company needs a relational database developed to track project details
according to project name, hours assigned and charges per hour for each job description. From a
THE TECHNOLOGY
The DBMS software of your choice. No student data file is provided for this project.
AVAILABLE INFORMATION
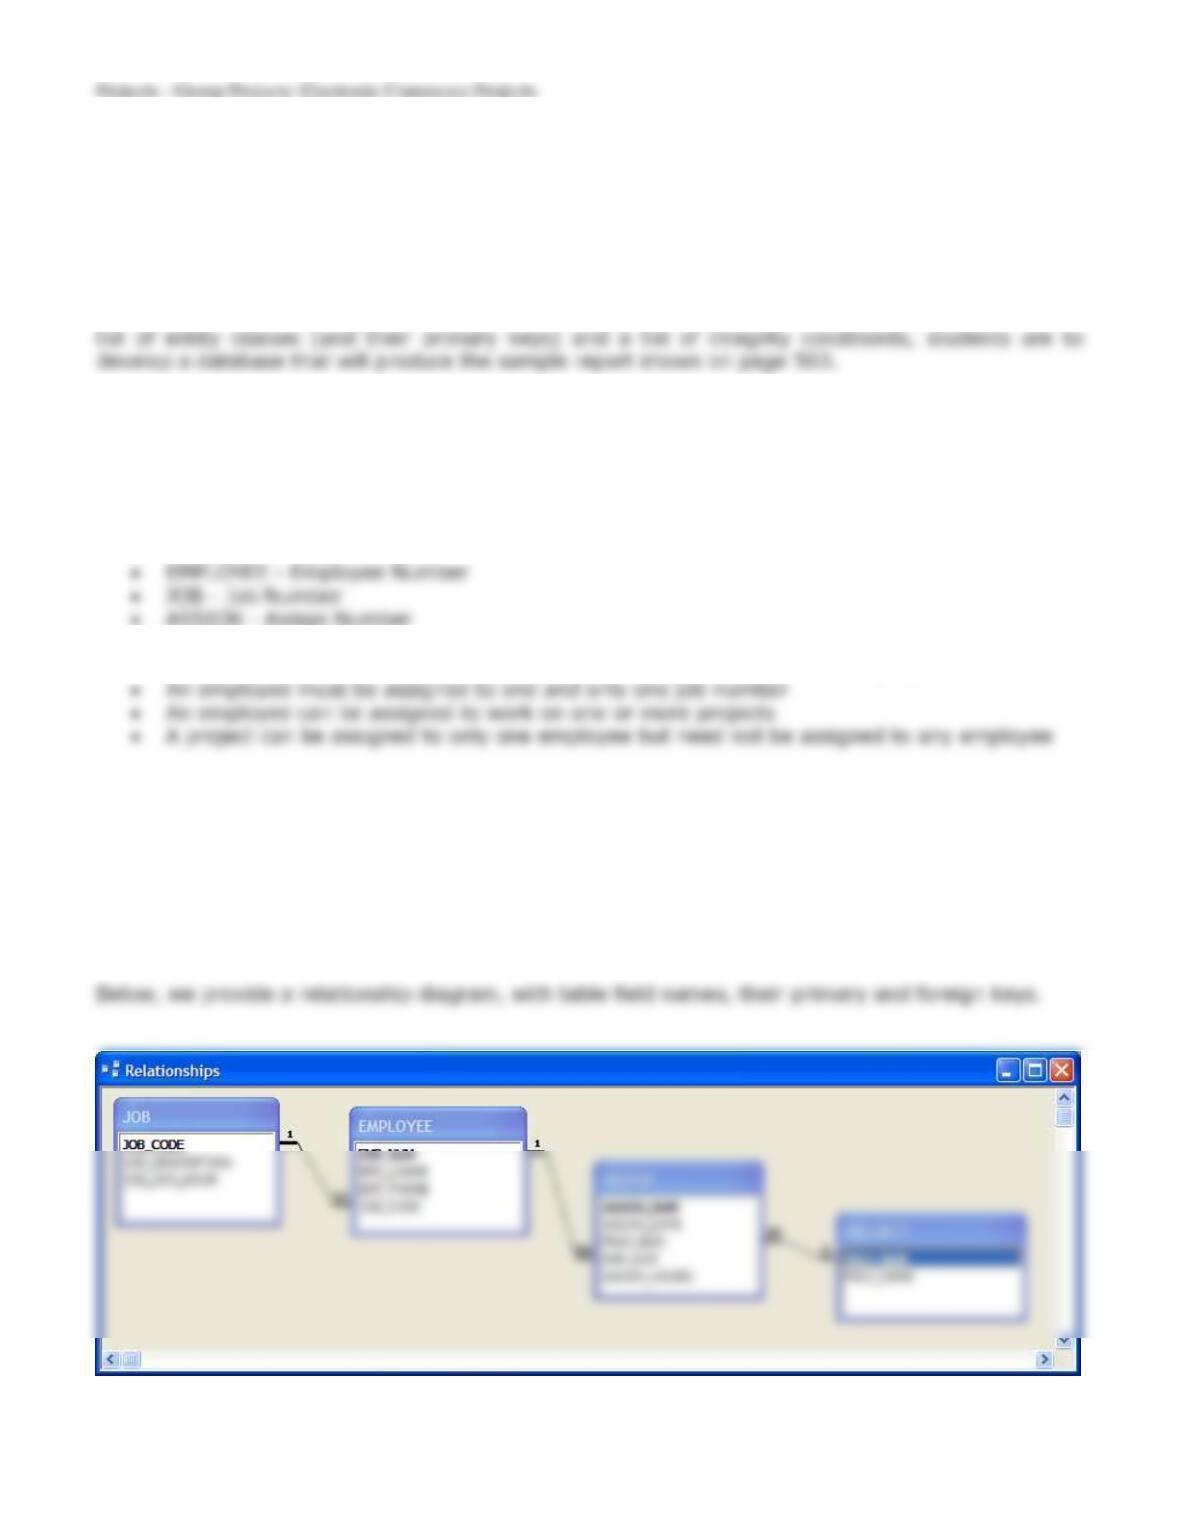
1. A sample report (page 503)
2. A list of entity classes and their primary keys (page 470):
• PROJECT – Project Number
3. A list of integrity constraints (page 470):
• A job can have many employees assigned but must have at least one employee
A PRE-ANALYSIS OF THE INFORMATION
All of the above information is important. You should alert your students to the fact that this is the
type of information they will be given in the real world when asked to design and build a database.
THE ANALYSIS
With only a single report and a list of integrity constraints, your students must build the correct
database structure. In this particular project though, your students will not have to deal with a
many-to-many relationship.

GP – 13
The FOOTHILLS CONSTRUCTION SOLUTION Access file demonstrates our implementation of the
database.
As you take your students through our solution, you might want to make note of the following:
• The E-R diagram (click on Relationships… under Tools on the Main Menu in Access)
• The ASSIGN query was created to gather all the necessary information for the report.
As you discuss the PROJECT report, you will also want to address several of its features, including:
• The report is created using the Report Wizard feature first, and then massaged with the Design
View feature.
• The report is based on the ASSIGN query.

GP – 14
CASE 6: BUILDING A DECISION SUPPORT SYSTEM
Creating an Investment Portfolio
Pages 292
THE ISSUE
Using 10 different stocks compare 16 different portfolios: 5 with 2 stocks each; 5 with 5 stocks
each; 5 with 7 stocks each; and 1 with all 10 stocks.
THE TECHNOLOGY
Word processing software to retrieve the raw data, STOCKS.doc, and spreadsheet software to
perform the analysis.
AVAILABLE INFORMATION
A PRE-ANALYSIS OF THE INFORMATION
• The two years of weekly data include data from June 1999 through June 2001
• The stocks represent a mix of industries. The list includes two stocks from each of the following
industries:
o Network (Cisco and 3COM)
THE ANALYSIS
The only portfolio that will be the same for all students is the one with all 10 stocks. There are many
combinations possible for the other portfolios.
In general, conventional wisdom says that the following is true:
• The standard deviation of each portfolio will tend to be lower than the values for the individual

GP – 15
A sample set of results is in the STOCKS SOLUTION Excel file. We offer a note of caution here.
During the time period of this data (2005), technology stocks went through some wild swings that
skewed the results somewhat. The standard deviation of the portfolios is still less than individual
technology stocks, but the portfolios that contain only technology stocks tend to have a higher
standard deviation than those that have few or no technology stocks.
The STOCKS SOLUTION file has five worksheets:
1. Cover Sheet – a description of the Excel solution file
3. Closing Prices & Calculation -the closing values for the 2 indices and the 10 stocks along with
the percentage change from week to week
4. Dividend Data & Calculations – the dividend data along with the growth rate calculations and
graphs as required in Question 2: Value Each of the Stocks
• The dividend growth model for stock pricing used in the solution is:
– Price = Current Dividend / (Required Rate – Dividend Growth Rate)
– The required rate used is 12%
• The dividend forecast model used in the solution is:
– Future Dividend = (Current Dividend * Growth Rate) + Current Dividend
Notes:
• It may be necessary to remind your students that Excel has a standard deviation function (e.g.,
STDEV).

GP – 16
CASE 7: ADVERTISING WITH BANNER ADS
THE ISSUE
it should develop reciprocal banner ad relationships.
THE TECHNOLOGY
AVAILABLE INFORMATION
A list of customer transactions, including the total purchase for the transaction, from what Web site
the customer came, and to what Web site the customer went.
A PRE-ANALYSIS OF THE INFORMATION
• The number assigned to each customer is not important in this analysis.
• There are three important pieces of information that must be derived in order to make the
correct decisions:
THE ANALYSIS
This project has many dimensions. If your students are only vaguely familiar with how clickstreams
and banner ads work, you should encourage them to contact a Web site such as Yahoo! to learn
more about them.
We developed the file of information in such a way that there are only a few key Web sites to focus
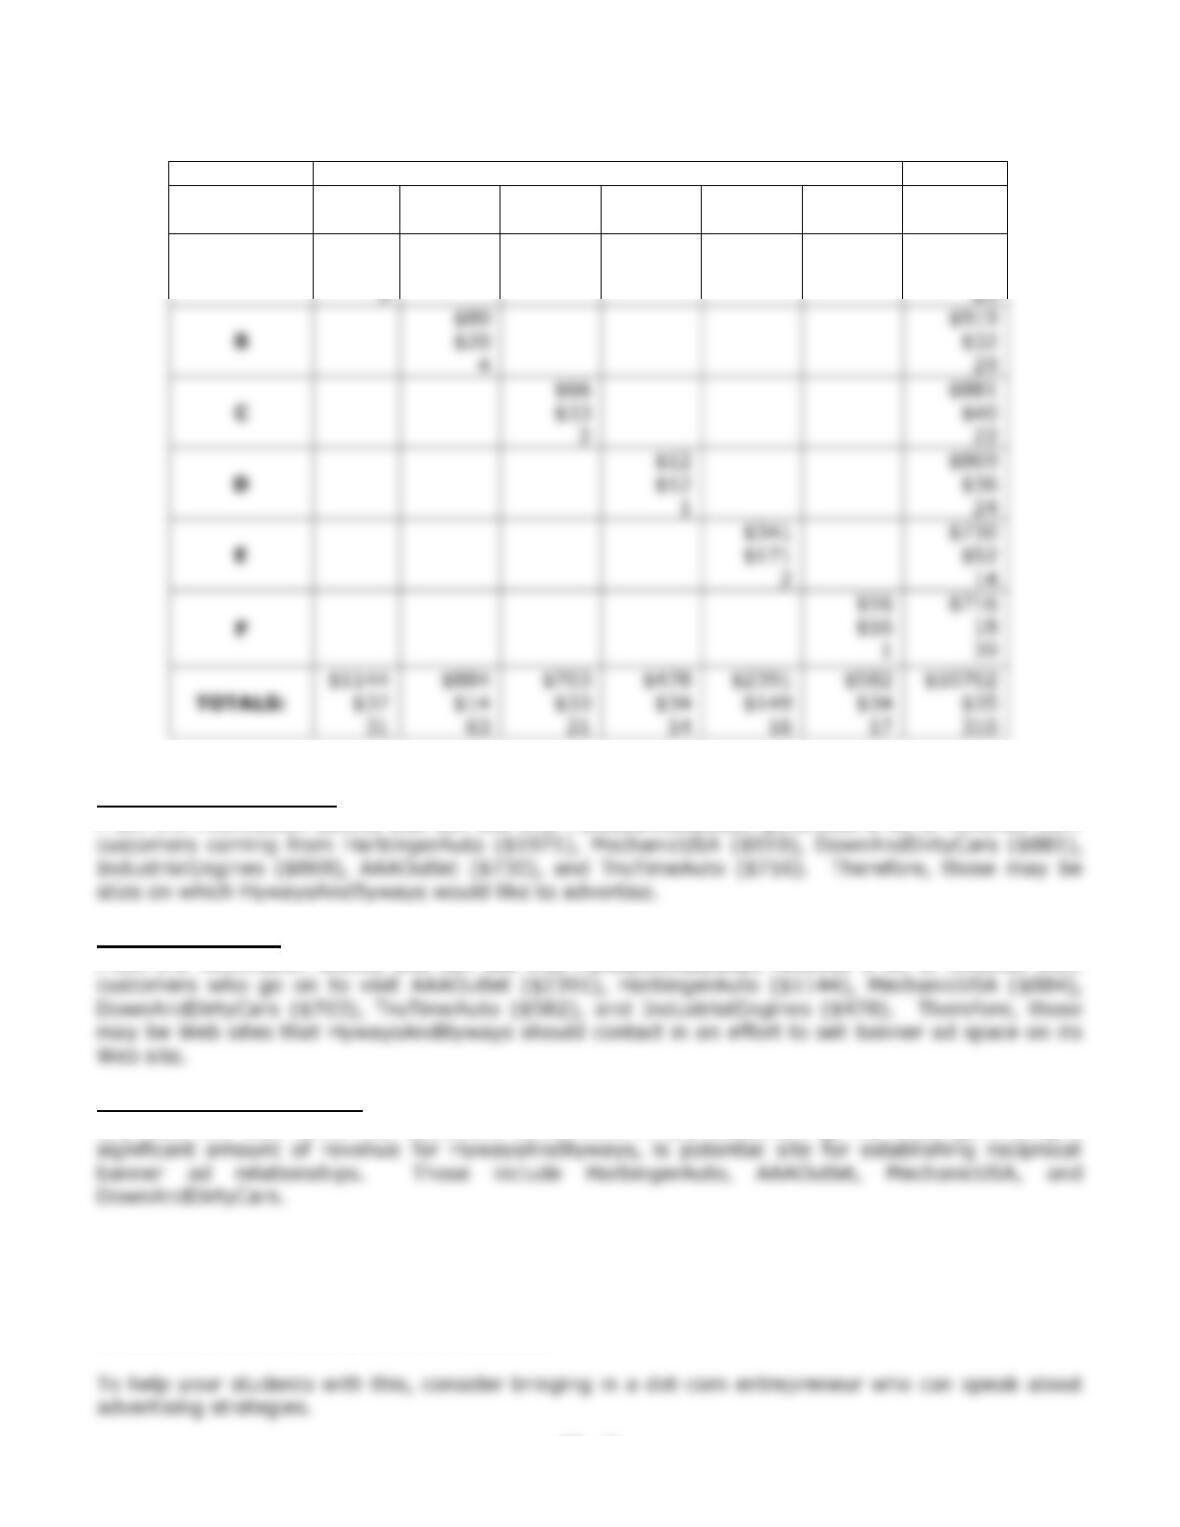
Projects – Group Projects: Electronic Commerce Projects
GP – 17
NEXT WEB SITE
PREVIOUS
WEB SITE
A
B
C
D
E
F
TOTALS
A
$147
$49
$1971
86
PREVIOUS WEB SITES
From the information above, you can see that HywaysAndByways generates a lot of revenue from
NEXT WEB SITES
From the information above, you can see that HywaysAndByways receives a lot of revenue from
RECIPROCAL WEB SITES
Any Web site that either (1) customers come from or (2) customers go to, while generating a
The really important questions center around if HywaysAndByways should buy banner ad space on
Web sites that already send it a lot of business or those that do not send it a lot of business. This is
a key question. If you already generate a lot of sales from a Web site on which you do not advertise
should you start spending money by advertising on it or should you spend your advertising dollars
on sites that do not send you a lot of business?
B
C
E

Projects – Group Projects: Electronic Commerce Projects
The CLICKSTREAMS SOLUTION Excel file demonstrates how we performed our analysis. In the

GP – 19
CASE 8: ASSESSING THE VALUE OF OUTSOURCING INFORMATION TECHNOLOGY
Creating Forecasts
Pages 294
THE ISSUE
Innovative Software is considering whether to outsource its customer service department. Based on
THE TECHNOLOGY
AVAILABLE INFORMATION
• DATE – the actual date of the phone call made to customer service about the search software
A PRE-ANALYSIS OF THE INFORMATION
THE ANALYSIS
• The first step of this analysis is to have your students create a moving average from the number
of phone calls. This is basically done by taking the Actual Calls and dividing that by the Forecast
Calls. Keeping in mind to use a three-day moving average.
• The second step for the students is to make a linear forecast. The TREND worksheet function in
Excel is the easiest way to create a (regression) forecast. When the students perform the
calculation the same intercept and slope values create each forecast value, the forecast does not

Projects – Group Projects: Electronic Commerce Projects
GP – 20
• The table below details our analysis.
Month
Sales volume:
Actual calls:
Forecast:
Trend:
1
12
360
#N/A
316.8095
3
18
559
#N/A
583.4952
4
15
651
716.8381
5
14
744
850.1810
The FORECAST SOLUTION Excel file demonstrates how we arrived at the above solution. In the
Excel solution file, you will find six worksheets: